

The DOI matches its Crossref record; 43 of the 43 references it cites were found in a registry or an index.
Protein language models learn evolutionary statistics of interacting sequence motifs
Open accessPublished version of a preprint
Abstract
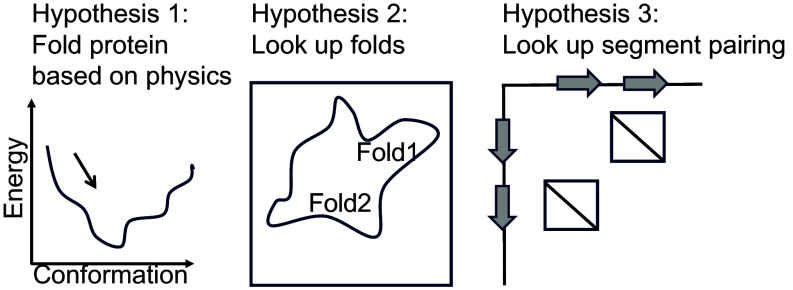
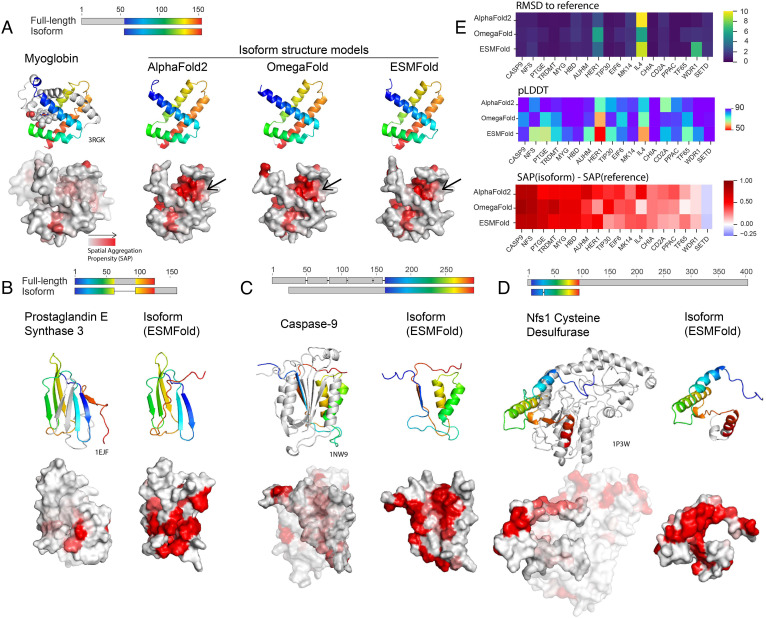
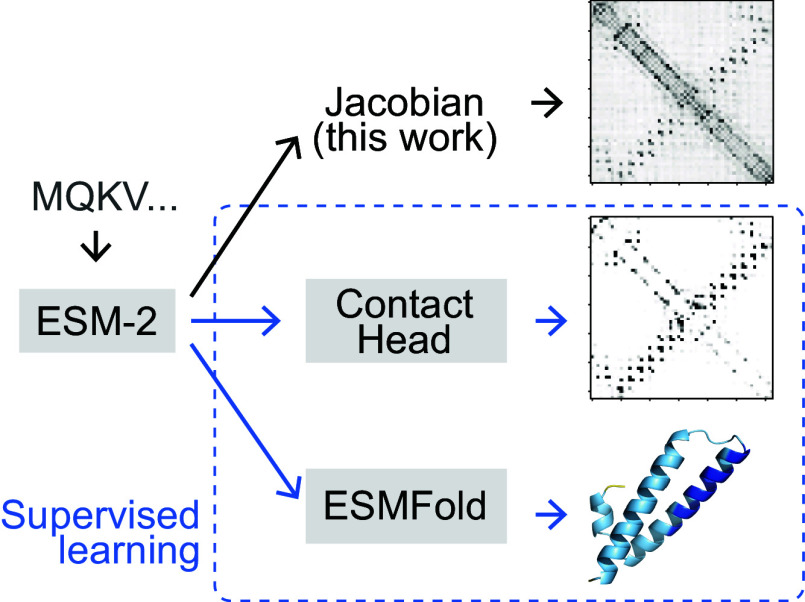
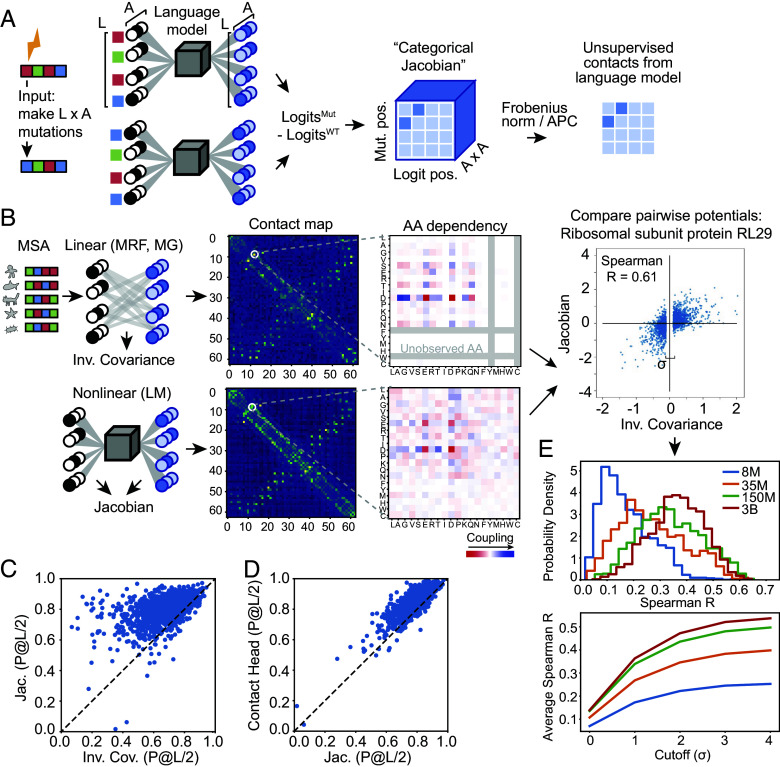
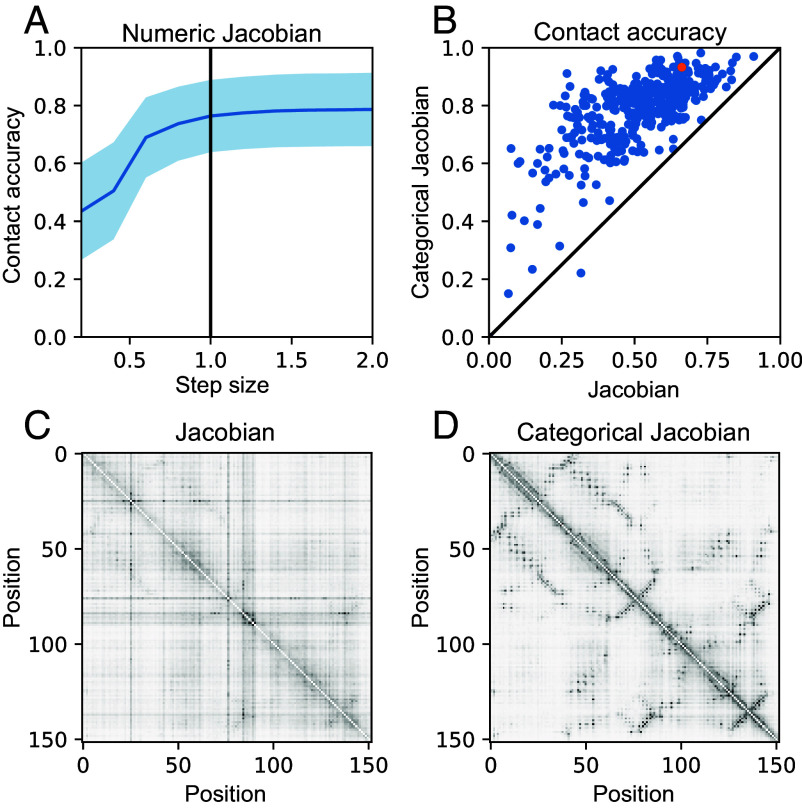
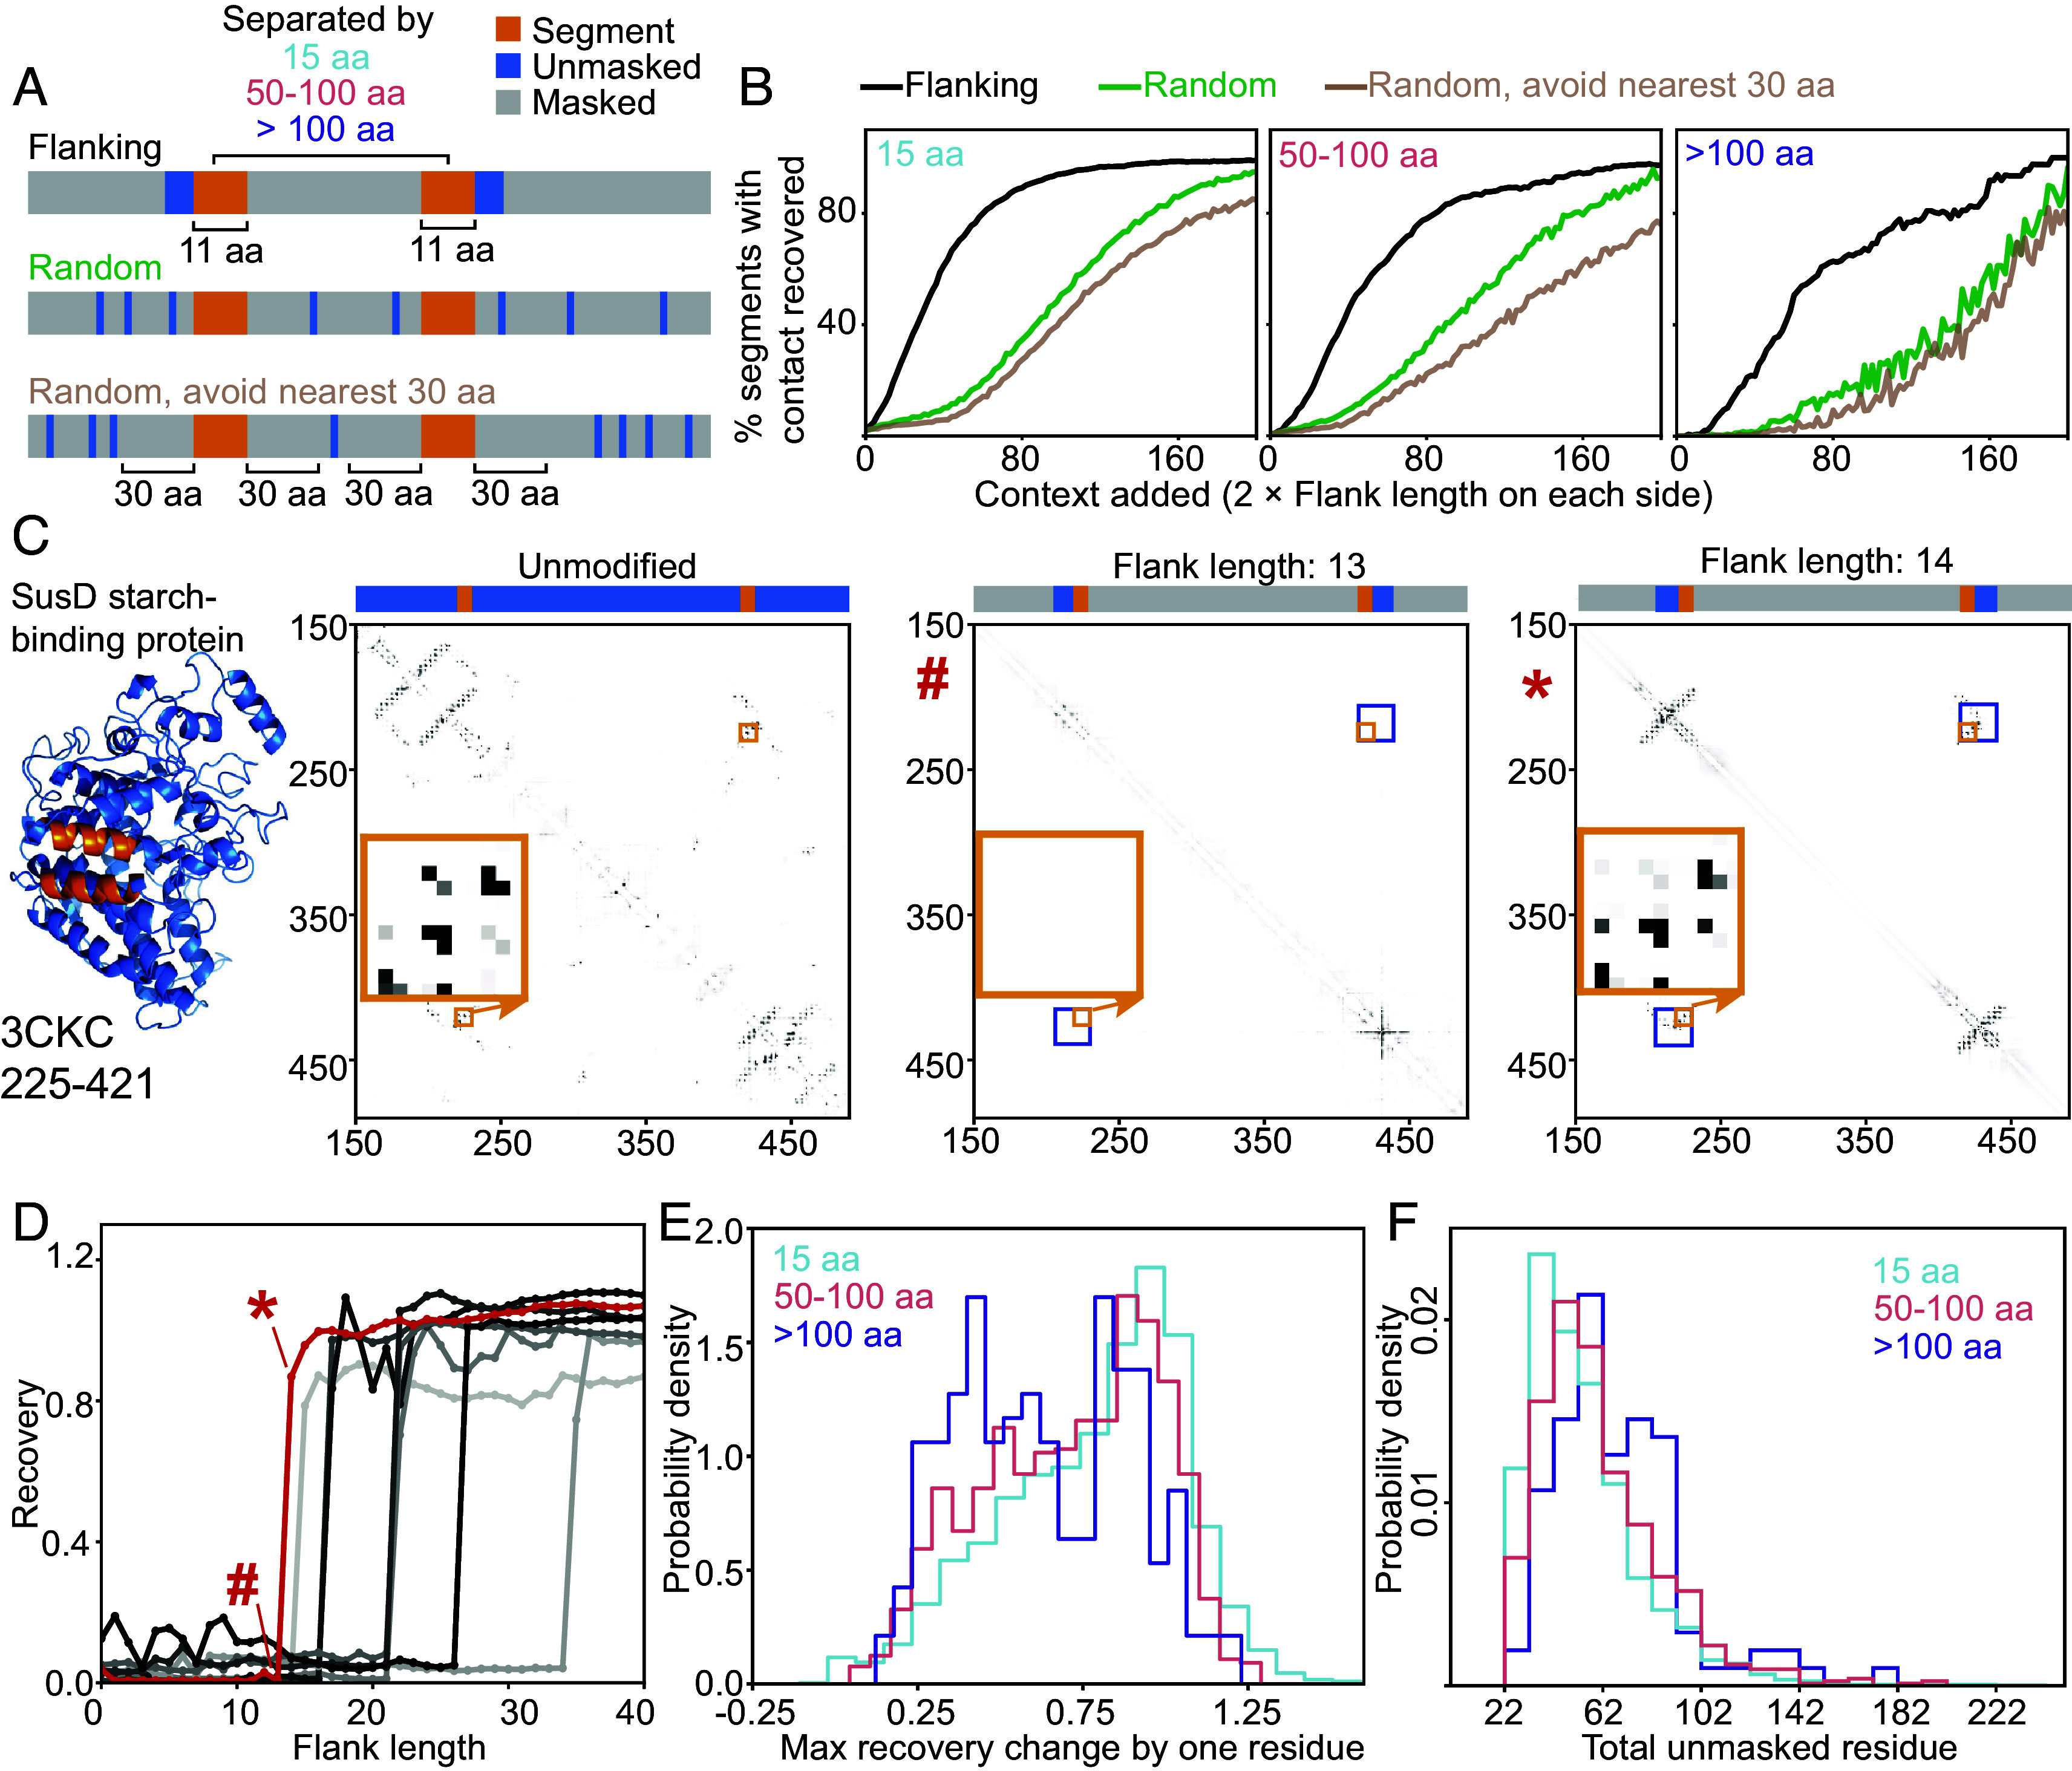
Protein language models (pLMs) have emerged as potent tools for predicting and designing protein structure and function, and the degree to which these models fundamentally understand the inherent biophysics of protein structure stands as an open question. Motivated by a finding that pLM-based structure predictors erroneously predict nonphysical structures for protein isoforms, we investigated the nature of sequence context needed for contact predictions in the pLM Evolutionary Scale Modeling (ESM-2). We demonstrate by use of a “categorical Jacobian” calculation that ESM-2 stores statistics of coevolving residues, analogously to simpler modeling approaches like Markov Random Fields and Multivariate Gaussian models. We further investigated how ESM-2 “stores” information needed to predict contacts by comparing sequence masking strategies, and found that providing local windows of sequence information allowed ESM-2 to best recover predicted contacts. This suggests that pLMs predict contacts by storing motifs of pairwise contacts. Our investigation highlights the limitations of current pLMs and underscores the importance of understanding the underlying mechanisms of these models.
Overview
The claims and statistics of this paper haven’t been checked yet.
Free: it reads the open-access text and checks the first 5 claims that cite a source we can check. Create a free account to check every claim.
Integrity signals
Registry
Cites
Statistics
Figures
Verification
Claims the paper makes
The claims and statistics of this paper haven’t been checked yet.
Free: it reads the open-access text and checks the first 5 claims that cite a source we can check. Create a free account to check every claim.
Claims other papers make about this one
Each is checked against this paper’s own text: does it say what the citing paper says it does?
The check wasn’t confident either way, so it gives no verdict — never disputed.
In the citing paper
“We observed that the model uses information from one end to specify the other end across a distance of ~1 to 2 kb, reflecting the model’s understanding of the tight evolutionary linkage of the two terminal elements”
From Sequence modeling and design from molecular to genome scale with Evo (2024) · cites this paper as [70]
Experimental — accuracy not yet measured
Self-check
Percentages, sums and reported differences re-computed from the paper’s own numbers.
The self-check needs the paper’s full text.
Citations
Cites
Highly accurate protein structure prediction with AlphaFold
Jumper, J., Evans, R., Pritzel, A., Green, T., Figurnov, M., Ronneberger, O., Tunyasuvunakool, K., Bates, R., Žídek, A., Potapenko, A., et al. (2021) · Nature · doi:10.1038/s41586-021-03819-2 · Cited by 43,764
SciPy 1.0: fundamental algorithms for scientific computing in Python
Virtanen, P., Gommers, R., Oliphant, T. E., Haberland, M., Reddy, T., Cournapeau, D., Burovski, E., Peterson, P., Weckesser, W., Bright, J., et al. (2020) · Nature Methods · doi:10.1038/s41592-019-0686-2 · Cited by 38,430
Kabsch, W., & Sander, C. (1983) · Biopolymers · doi:10.1002/bip.360221211 · Cited by 15,320
SciPy 1.0: fundamental algorithms for scientific computing in Python
Virtanen, P., Gommers, R., Oliphant, T. E., Haberland, M., Reddy, T., Cournapeau, D., Burovski, E., Peterson, P., Weckesser, W., Bright, J., et al. (2019) · Apollo - University of Cambridge Repository · doi:10.17863/cam.64134 · Cited by 10,460
ColabFold - Making protein folding accessible to all
Mirdita, M., Schütze, K., Moriwaki, Y., Heo, L., Ovchinnikov, S., & Steinegger, M. (2021) · doi:10.1101/2021.08.15.456425 · Cited by 9,391
Self-citationEvolutionary-scale prediction of atomic level protein structure with a language model
Lin, Z., Akin, H., Rao, R., Hie, B., Zhu, Z., Lu, W., Smetanin, N., Verkuil, R., Kabeli, O., Shmueli, Y., et al. (2022) · doi:10.1101/2022.07.20.500902 · Cited by 5,990
Accurate prediction of protein structures and interactions using a 3-track network
Baek, M., DiMaio, F., Anishchenko, I., Dauparas, J., Ovchinnikov, S., Lee, G. R., Wang, J., Cong, Q., Kinch, L. N., Schaeffer, R. D., et al. (2021) · doi:10.1101/2021.06.14.448402 · Cited by 5,549
Self-citationTM-align: a protein structure alignment algorithm based on the TM-score
Zhang, Y. (2005) · Nucleic Acids Research · doi:10.1093/nar/gki524 · Cited by 3,774
Rives, A., Meier, J., Sercu, T., Goyal, S., Lin, Z., Liu, J., Guo, D., Ott, M., Zitnick, C. L., Ma, J., et al. (2021) · Proceedings of the National Academy of Sciences · doi:10.1073/pnas.2016239118 · Cited by 3,286
Rives, A., Meier, J., Sercu, T., Goyal, S., Lin, Z., Liu, J., Guo, D., Ott, M., Zitnick, C. L., Ma, J., et al. (2019) · doi:10.1101/622803 · Cited by 3,280
Cited by
Genome modelling and design across all domains of life with Evo 2
Brixi, G., Durrant, M. G., Ku, J., Naghipourfar, M., Poli, M., Sun, G., Brockman, G., Chang, D., Fanton, A., Gonzalez, G. A., et al. (2026) · Nature · doi:10.1038/s41586-026-10176-5 · Cited by 687
Self-citationSequence modeling and design from molecular to genome scale with Evo
Nguyen, E., Poli, M., Durrant, M. G., Kang, B., Katrekar, D., Li, D. B., Bartie, L. J., Thomas, A. W., King, S. H., Brixi, G., et al. (2024) · Science · doi:10.1126/science.ado9336 · Cited by 580
Self-citationTransformers and genome language models
Consens, M. E., Dufault, C., Wainberg, M., Forster, D., Karimzadeh, M., Goodarzi, H., Theis, F. J., Moses, A. M., & Wang, B. (2025) · Nature Machine Intelligence · doi:10.1038/s42256-025-01007-9 · Cited by 194
InterPLM: discovering interpretable features in protein language models via sparse autoencoders
Simon, E. P., & Zou, J. (2025) · Nature Methods · doi:10.1038/s41592-025-02836-7 · Cited by 169
Biophysics-based protein language models for protein engineering
Gelman, S., Johnson, B., Freschlin, C. R., Sharma, A., D’Costa, S., Peters, J., Gitter, A., & Romero, P. A. (2025) · Nature Methods · doi:10.1038/s41592-025-02776-2 · Cited by 89
Metadata
- Authors
- Zhang, Z., Wayment-Steele, H. K., Brixi, G., Wang, H., Kern, D., & Ovchinnikov, S.
- Affiliations
- Harvard University (US)
- Howard Hughes Medical Institute (US)
- Corresponding author
- Ovchinnikov, Sergey
- ORCID
- Venue
- Proceedings of the National Academy of Sciences
- Publisher
- National Academy of Sciences
- Published
- 2024-10-28
- Volume
- 121
- Issue
- 45
- Pages
- e2406285121-e2406285121
- ISSN
- 0027-8424 (ISSN-L)
- 1091-6490
- PMC
- PMC11551344
- OpenAlex
- W4403824354
- Cited by
- 140
- References
- 39
- Citations by year
- 2026: 66 · 2025: 56 · 2024: 16
- FWCI
- 18.79
- Type
- journal article
- Language
- en
- Open access
- hybrid
- doi.org
- Licence
- Locations
- Proceedings of the National Academy of Sciences (publishedVersion, cc-by)
- bioRxiv (Cold Spring Harbor Laboratory) (acceptedVersion, cc-by)
- PubMed Central (publishedVersion, cc-by)
- PubMed (publishedVersion)
- Infoscience (Ecole Polytechnique Fédérale de Lausanne) (submittedVersion, cc-by-nc-nd)
- Funders
- Jane Coffin Childs (N/A)
- Howard Hughes Medical Institute (N/A)
- National Institutes of Health (DP5OD026389)
- National Foundation of Science (MCB2032259)
- Swiss National Science Foundation (205321_192371)
- Topics
- Life Sciences › Biochemistry, Genetics and Molecular Biology › Molecular Biology › Protein Structure and Dynamics
- Life Sciences › Biochemistry, Genetics and Molecular Biology › Molecular Biology › Machine Learning in Bioinformatics
- Life Sciences › Biochemistry, Genetics and Molecular Biology › Molecular Biology › RNA and protein synthesis mechanisms
- Keywords
- protein language models, ESM-2, contact prediction, sequence motifs, protein isoforms, sequence masking, protein structure prediction, model interpretability
- MeSH terms
- Markov Chains, Models, Molecular, Protein Conformation, Proteins, Evolution, Molecular, Amino Acid Motifs
About these checks
Registry, retraction, Cites and statistics results are computed, not judged, with one exception: a printed reference that no index lists is read once by a model before it counts as a citation error. Claims are extracted by a model and kept only when their quote appears verbatim in the text; each cited source is then checked, with a model’s help, for whether it says what the claim relies on. Those verdicts can be wrong — read the claim’s quote and the cited source before relying on one.
Statistics and arithmetic are recomputed, not judged.
Confidence bands are shown only for fields calibrated on our annotated test set. None is calibrated yet, so no band is shown.
What counts as a claim ›How we measure confidence ›How we check this ›
Are you an author, or do you see a problem with this page? Request a review
How to cite
Cite CoChat for the checks on this page, and the paper for its own findings.
- This page
- CoChat. (2026). Citation check: Protein language models learn evolutionary statistics of interacting sequence motifs. https://app.cochat.ai/papers/10.1073/pnas.2406285121
- The paper
- Zhang, Z., Wayment-Steele, H. K., Brixi, G., Wang, H., Kern, D., & Ovchinnikov, S. (2024). Protein language models learn evolutionary statistics of interacting sequence motifs. Proceedings of the National Academy of Sciences. https://doi.org/10.1073/pnas.2406285121
Data sources
Bibliographic data: Semantic Scholar, OpenAlex, Crossref.
Contains information from the Semantic Scholar Academic Graph Datasets, made available under the ODC Attribution License (ODC-BY 1.0).
Semantic Scholar’s data is described in: Kinney, R., et al. (2023). The Semantic Scholar Open Data Platform. arXiv:2301.10140.
