

The DOI matches its Crossref record; 83 of the 83 references it cites were found in a registry or an index.
Lewy Body-like α-Synuclein Aggregates Resist Degradation and Impair Macroautophagy
Open accessAbstract
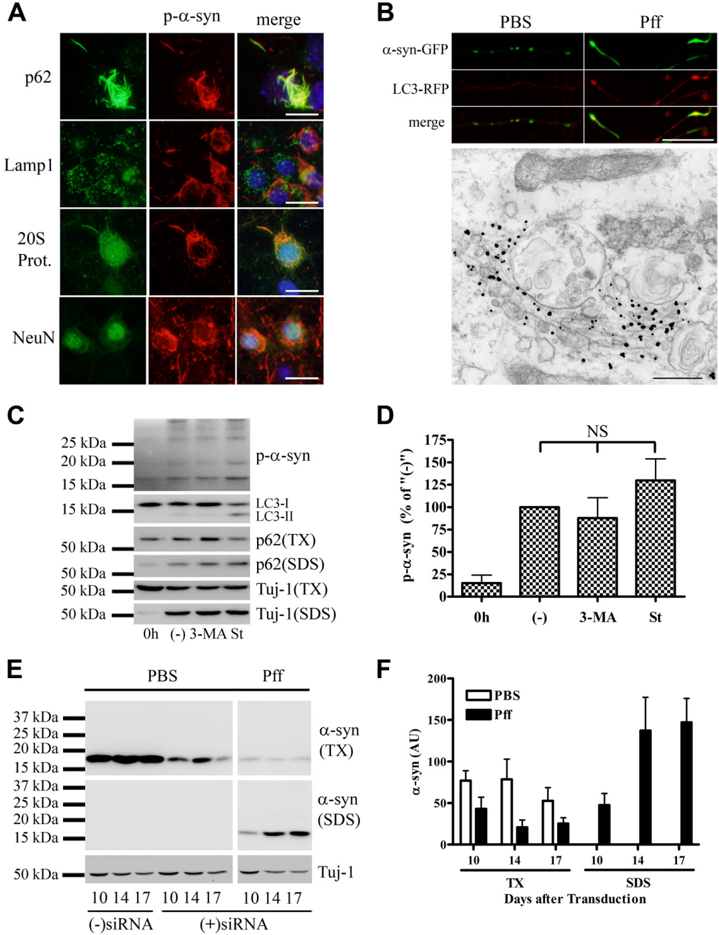
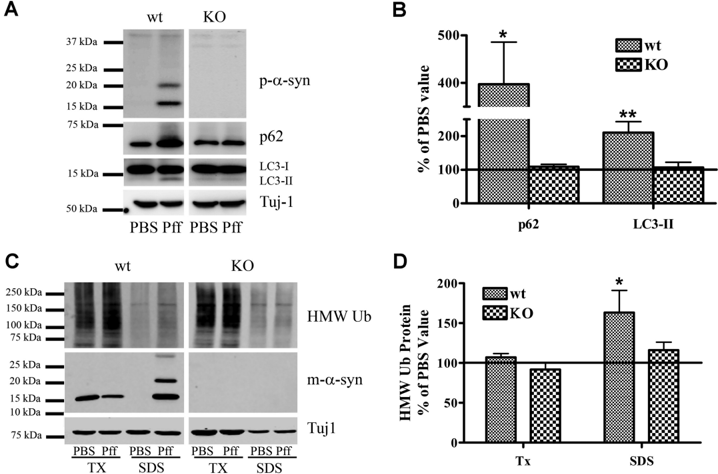
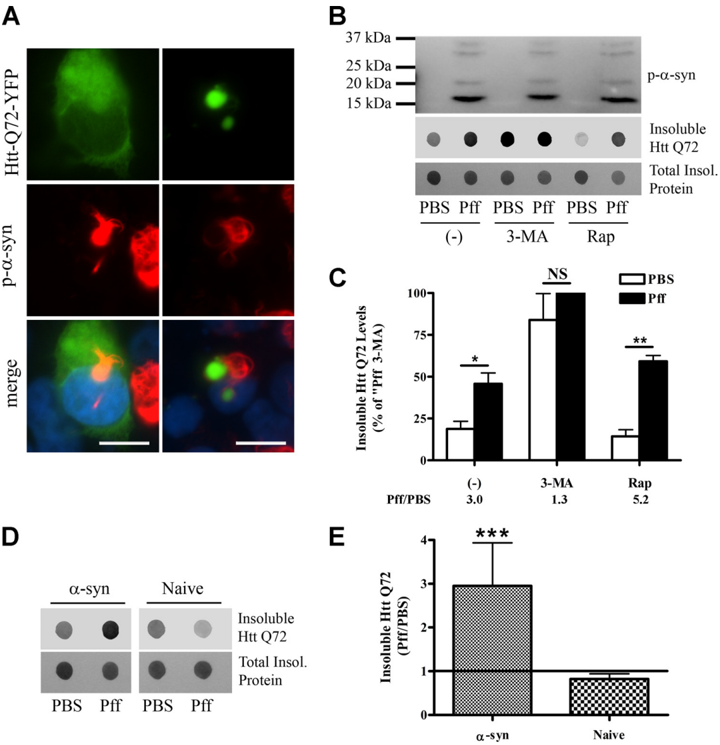
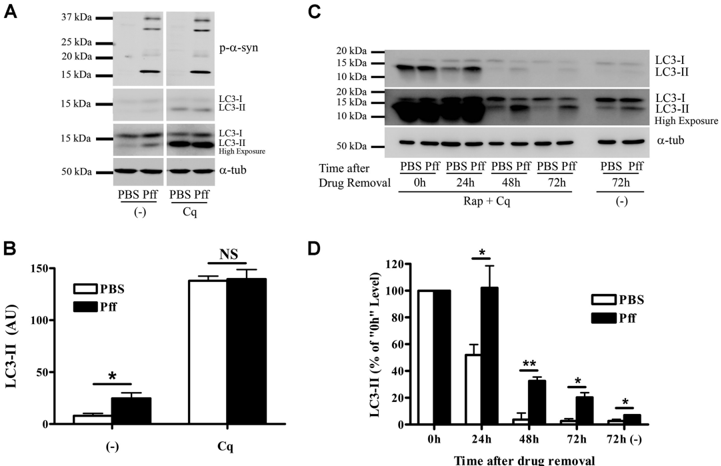
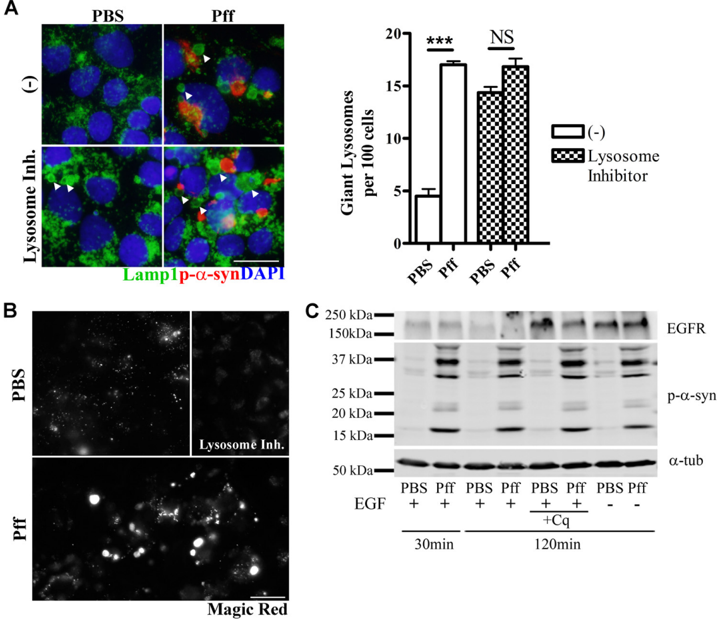
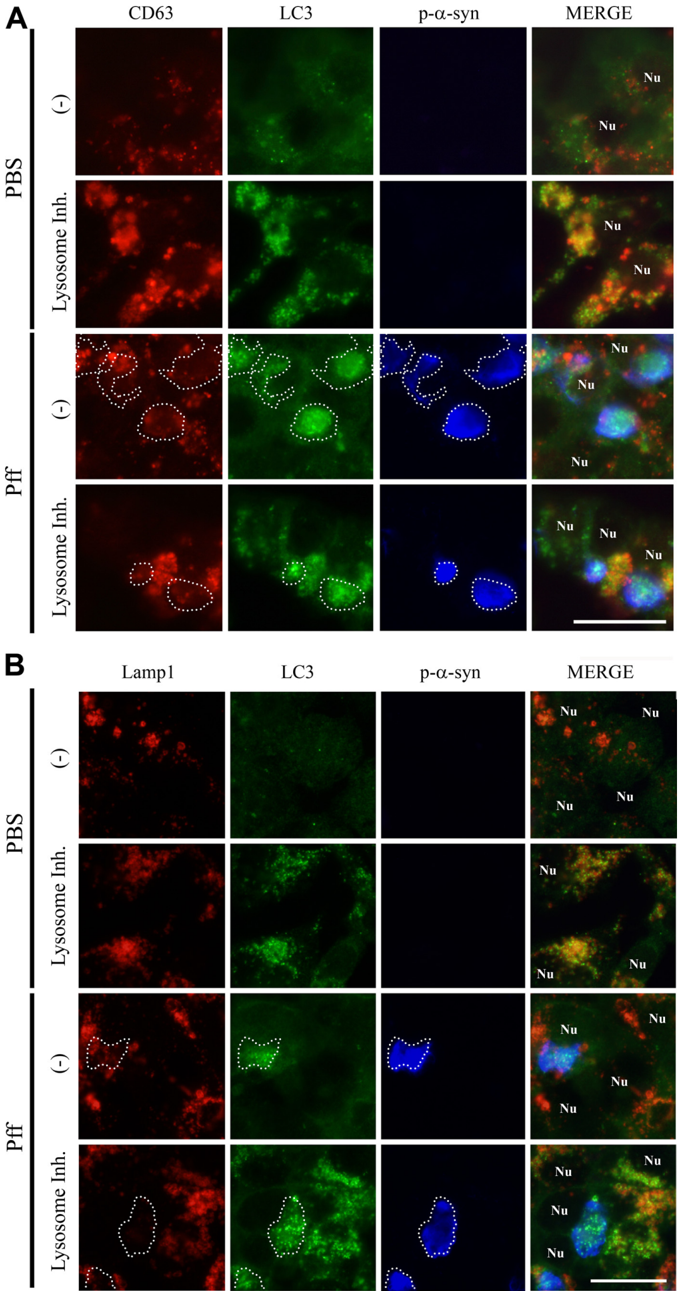
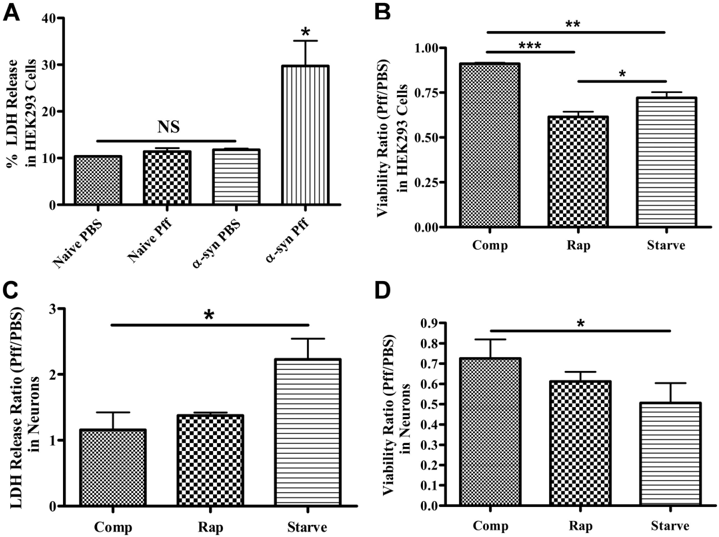
Cytoplasmic α-synuclein (α-syn) aggregates, referred to as Lewy bodies, are pathological hallmarks of a number of neurodegenerative diseases, most notably Parkinson disease. Activation of macroautophagy is suggested to facilitate degradation of certain proteinaceous inclusions, but it is unclear if this pathway is capable of degrading α-syn aggregates. Here, we examined this issue by utilizing cellular models in which intracellular Lewy body-like α-syn inclusions accumulate after internalization of pre-formed α-syn fibrils into α-syn-expressing HEK293 cells or cultured primary neurons. We demonstrate that α-syn inclusions cannot be effectively degraded, even though they co-localize with essential components of both the autophagic and proteasomal protein degradation pathways. The α-syn aggregates persist even after soluble α-syn levels have been substantially reduced, suggesting that once formed, the α-syn inclusions are refractory to clearance. Importantly, we also find that α-syn aggregates impair overall macroautophagy by reducing autophagosome clearance, which may contribute to the increased cell death that is observed in aggregate-bearing cells. Background: α-Synuclein aggregates and macroautophagy are associated with neurodegeneration. Results: Modulation of macroautophagic activity does not affect α-synuclein aggregate levels, although these aggregates cause accumulation of immature autophagosomes. Conclusion: α-Synuclein aggregates are resistant to degradation and impair autophagy by delaying autophagosome maturation. Significance: Understanding the impact of α-synuclein aggregates on autophagy may help elucidate therapies for α-synuclein-mediated neurodegeneration.
Overview
The claims and statistics of this paper haven’t been checked yet.
Run the check — free, no account needed. It reads the open-access text and checks the sources it cites.
Integrity signals
Registry
Cites
Statistics
Figures
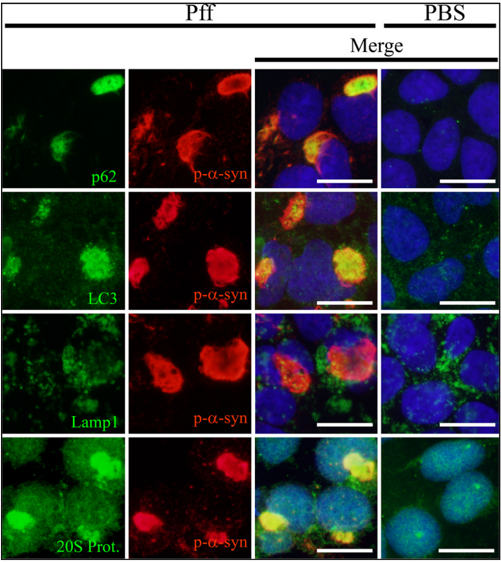
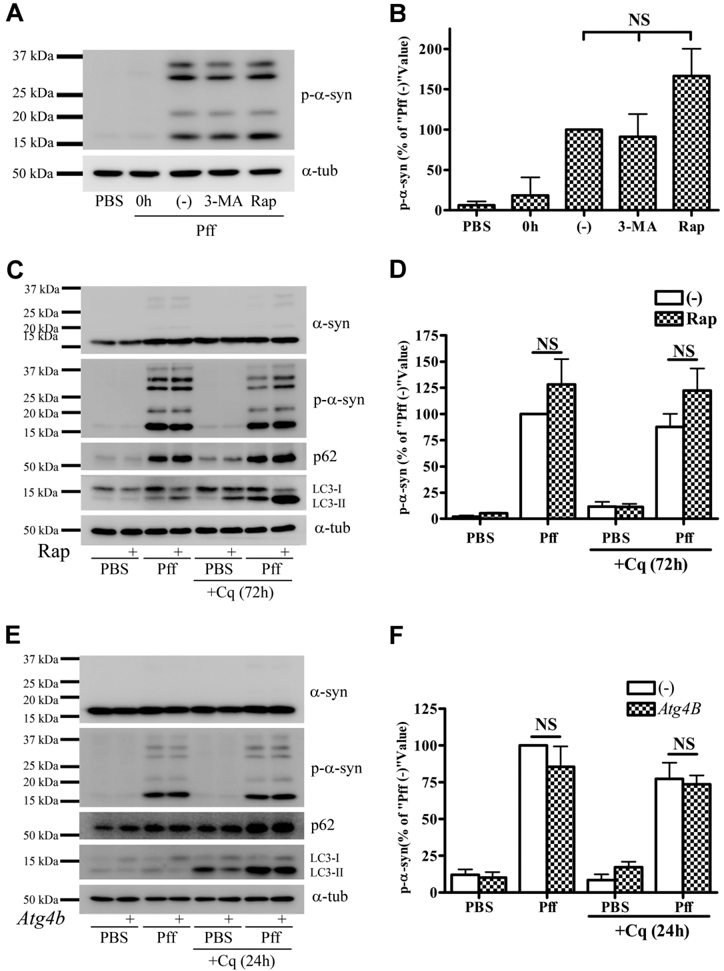
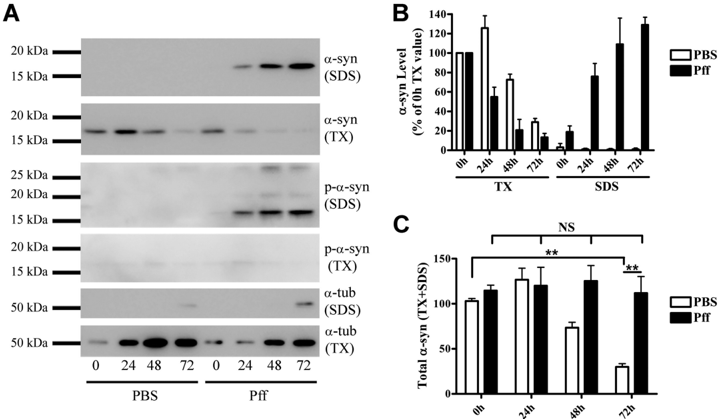
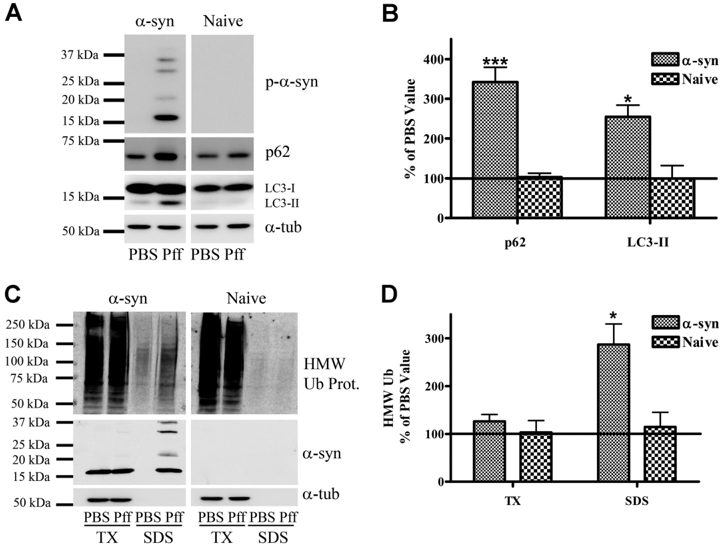
Verification
Claims the paper makes
The claims and statistics of this paper haven’t been checked yet.
Run the check — free, no account needed. It reads the open-access text and checks the sources it cites.
Claims other papers make about this one
Each is checked against this paper’s own text: does it say what the citing paper says it does?
In the citing paper
“Furthermore, LB-like synuclein aggregates resist degradation and impair autophagy20.”
From Loss of autophagy in dopaminergic neurons causes Lewy pathology and motor dysfunction in aged mice (2018) · cites this paper as [20]
Self-check
Percentages, sums and reported differences re-computed from the paper’s own numbers.
The self-check needs the paper’s full text.
Citations
Cites
Mutation in the α-Synuclein Gene Identified in Families with Parkinson's Disease
Polymeropoulos, M. H., Lavedan, C., Leroy, E., Ide, S. E., Dehejia, A., Dutra, A., Pike, B., Root, H., Rubenstein, J., Boyer, R., et al. (1997) · Science · doi:10.1126/science.276.5321.2045 · Cited by 8,240
LC3, a mammalian homologue of yeast Apg8p, is localized in autophagosome membranes after processing.
Kabeya, Y., Mizushima, N., Ueno, T., Yamamoto, A., Kirisako, T., Noda, T., Kominami, E., Ohsumi, Y., & Yoshimori, T. (2000) · The EMBO Journal · doi:10.1093/emboj/19.21.5720 · Cited by 6,605
Pankiv, S., Clausen, T. H., Lamark, T., Brech, A., Bruun, J.-A., Outzen, H., Øvervatn, A., Bjørkøy, G., & Johansen, T. (2007) · Journal of Biological Chemistry · doi:10.1074/jbc.m702824200 · Cited by 4,578
Methods in Mammalian Autophagy Research
Mizushima, N., Yoshimori, T., & Levine, B. (2010) · Cell · doi:10.1016/j.cell.2010.01.028 · Cited by 4,497
α-Synuclein Locus Triplication Causes Parkinson's Disease
Singleton, A. B., Farrer, M., Johnson, J., Singleton, A., Hague, S., Kachergus, J., Hulihan, M., Peuralinna, T., Dutra, A., Nussbaum, R., et al. (2003) · Science · doi:10.1126/science.1090278 · Cited by 4,383
Suppression of basal autophagy in neural cells causes neurodegenerative disease in mice
Hara, T., Nakamura, K., Matsui, M., Yamamoto, A., Nakahara, Y., Suzuki-Migishima, R., Yokoyama, M., Mishima, K., Saito, I., Okano, H., et al. (2006) · Nature · doi:10.1038/nature04724 · Cited by 3,882
AlaSOPro mutation in the gene encoding α-synuclein in Parkinson's disease
Krüger, R., Kuhn, W., Müller, T., Woitalla, D., Graeber, M., Kösel, S., Przuntek, H., Epplen, J. T., Schols, L., & Riess, O. (1998) · Nature Genetics · doi:10.1038/ng0298-106 · Cited by 3,836
Loss of autophagy in the central nervous system causes neurodegeneration in mice
Komatsu, M., Waguri, S., Chiba, T., Murata, S., Iwata, J.-I., Tanida, I., Ueno, T., Koike, M., Uchiyama, Y., Kominami, E., et al. (2006) · Nature · doi:10.1038/nature04723 · Cited by 3,500
The new mutation, E46K, of α‐synuclein causes parkinson and Lewy body dementia
Zarranz, J. J., Alegre, J., Gómez‐Esteban, J. C., Lezcano, E., Ros, R., Ampuero, I., Vidal, L., Hoenicka, J., Rodriguez, O., Atarés, B., et al. (2004) · Annals of Neurology · doi:10.1002/ana.10795 · Cited by 2,737
Luk, K. C., Kehm, V., Carroll, J., Zhang, B., O’Brien, P., Trojanowski, J. Q., & Lee, V. M.-Y. (2012) · Science · doi:10.1126/science.1227157 · Cited by 2,563
Self-citation
Cited by
Sorted by citations
Items 201–300 of 326
Lin, S., Leitao, A. D. G., Fang, S., Gu, Y., Barber, S., Gilliard-Telefoni, R., Castro, A., Sung, K., Shen, R., Florio, J. B., et al. (2023) · Neurobiology of Disease · doi:10.1016/j.nbd.2023.106010 · Cited by 17
Concomitant protein pathogenesis in Parkinson’s disease and perspective mechanisms
Han, Y., & He, Z. (2023) · Frontiers in Aging Neuroscience · doi:10.3389/fnagi.2023.1189809 · Cited by 18
Chen, S., Cai, F., Wang, J., Yang, Z., Gu, C., Wang, G., Mao, G., & Yan, J. (2019) · Molecular Medicine Reports · doi:10.3892/mmr.2019.10285 · Cited by 17
White and gray matter alterations in de novo PD patients: which matter most?
Pietracupa, S., Belvisi, D., Piervincenzi, C., Tommasin, S., Pasqua, G., Petsas, N., Bartolo, M. I. D., Fabbrini, A., Costanzo, M., Manzo, N., et al. (2023) · Journal of Neurology · doi:10.1007/s00415-023-11607-3 · Cited by 16
Proteostasis defects: Medicinal challenges of imperfect aging & neurodegeneration
Kumar, P., Choudhary, A., Kinger, S., Jagtap, Y. A., Dubey, A. R., Gutti, R. K., Chitkara, D., Suresh, A. K., & Mishra, A. (2023) · Translational Medicine of Aging · doi:10.1016/j.tma.2023.09.001 · Cited by 16
Behl, T., Madaan, P., Sehgal, A., Singh, S., Makeen, H. A., Albratty, M., Alhazmi, H. A., Meraya, A. M., & BUNGAU, S. G. (2022) · International Journal of Molecular Sciences · doi:10.3390/ijms23094565 · Cited by 19
Kostrzewa, R. M. (2022) · Journal of Neural Transmission · doi:10.1007/s00702-022-02479-4 · Cited by 17
Perspectives of autophagy-tethering compounds (ATTECs) in drug discovery
Ding, Y., Xing, D., Fei, Y., Luo, S., & Lu, B. (2024) · Medicine Plus · doi:10.1016/j.medp.2023.100004 · Cited by 16
Cai, Z., Xu, J., Xue, S.-R., Liu, Y.-Y., Zhang, Y., Zhang, X.-Z., Wang, X., Wu, F., & Li, X. (2015) · Neural Regeneration Research · doi:10.4103/1673-5374.162763 · Cited by 15
C. elegans to model autophagy-related human disorders
Wong, S. Q., Kumar, A. V., Mills, J., & Lapierre, L. R. (2020) · Progress in molecular biology and translational science · doi:10.1016/bs.pmbts.2020.01.007 · Cited by 14
Deconvoluting the complexity of autophagy and Parkinson's disease for potential therapeutic purpose
Li, J., Li, S., Zhang, L., Ouyang, L., & Liu, B. (2015) · Oncotarget · doi:10.18632/oncotarget.5803 · Cited by 14
Zhao, X., Chen, Y., Wang, L., Li, X., Chen, X., & Zhang, H. (2020) · International Journal of Neuroscience · doi:10.1080/00207454.2020.1731507 · Cited by 14
Fluorescent Protein-Based Autophagy Biosensors
Kim, H., & Seong, J. (2021) · Materials · doi:10.3390/ma14113019 · Cited by 15
Kim, Y., Lee, Y., Choo, M., Yun, N., Cho, J. W., & Oh, Y. J. (2023) · Journal of Biological Chemistry · doi:10.1016/j.jbc.2023.105479 · Cited by 14
Association of ATG5 gene polymorphism with Parkinson’s disease in a Han Chinese population
Han, J., Feng, G., Wu, J., Zhang, Y., Long, Z., & Yao, X. (2021) · Acta Neurologica Belgica · doi:10.1007/s13760-021-01814-y · Cited by 13
The Impact of Paeoniflorin onα-Synuclein Degradation Pathway
Cai, Z., Zhang, X., Zhang, Y., Li, X.-M., Xu, J., & Li, X. (2015) · Evidence-based Complementary and Alternative Medicine · doi:10.1155/2015/182495 · Cited by 13
Cui, J., Yu, Y., Wang, J., Song, N., & Xie, J. (2022) · Molecular Neurobiology · doi:10.1007/s12035-021-02687-1 · Cited by 12
MicroRNAs regulating autophagy: opportunities in treating neurodegenerative diseases
Mohseni, M., Behzad, G., Farhadi, A., Behroozi, J., Mohseni, H., & Valipour, B. (2024) · Frontiers in Neuroscience · doi:10.3389/fnins.2024.1397106 · Cited by 12
Lewy body diseases and the gut
Sampson, T. R., Tansey, M. G., West, A. B., & Liddle, R. A. (2025) · Molecular Neurodegeneration · doi:10.1186/s13024-025-00804-5 · Cited by 13
Tomas‐Grau, R. H., González‐Lizárraga, F., Ploper, D., Ávila, C. L., Socías, S. B., Besnault, P., Tourville, A., Mella, R. M., Villacé, P., Salado, C., et al. (2022) · Cells · doi:10.3390/cells11172759 · Cited by 12
Chang, C., Li, H., Chang, Y., Ho, Y., Hsieh, L., Chiu, P., Cheng, Y., Lin, C., & Lai, T. (2017) · CNS Neuroscience & Therapeutics · doi:10.1111/cns.12772 · Cited by 12
Suppression of α-synuclein propagation after intrastriatal injection in FABP3 null mice
Matsuo, K., Kawahata, K., Melki, R., Bousset, L., Owada, Y., & Fukunaga, K. (2021) · Brain Research · doi:10.1016/j.brainres.2021.147383 · Cited by 13
Raj, A., Banerjee, R., Holla, V. V., Kamble, N. L., Yadav, R., Pal, P. K., & Datta, I. (2024) · Cell Communication and Signaling · doi:10.1186/s12964-024-01928-9 · Cited by 11
Jeyabalan, J. B., Vignesh Pandi, A., Sankar, V., Sivasamy, R., Dhanasekaran, M., & Justin, A. (2025) · Neurological Sciences · doi:10.1007/s10072-025-08421-2 · Cited by 11
Moudio, S., Rodin, F., Albargothy, N. J., Karlsson, U., Reyes, J. F., & Hallbeck, M. (2022) · Frontiers in Neurology · doi:10.3389/fneur.2022.826102 · Cited by 11
Chen, Y., Zhang, N., Ji, D., Hou, Y., Chen, C., Fu, Y., Ge, R., Zheng, Q., Chen, J., & Wang, H. (2018) · Neuroreport · doi:10.1097/wnr.0000000000001097 · Cited by 10
Modulation of autophagy in human diseases strategies to foster strengths and circumvent weaknesses
Xu, S., Sui, S., Zhang, X., Pang, B., Wan, L., & Pang, D. (2019) · Medicinal Research Reviews · doi:10.1002/med.21571 · Cited by 10
Narayanan, A., Meriin, A. B., Sherman, M. Y., & Cissé, I. I. (2017) · bioRxiv (Cold Spring Harbor Laboratory) · doi:10.1101/148395 · Cited by 10
A splicing variant of TFEB negatively regulates the TFEB-autophagy pathway
Park, J.-Y., Sohn, H., Koh, Y. H., & Jo, C. (2021) · Scientific Reports · doi:10.1038/s41598-021-00613-y · Cited by 9
The role of autophagy in synucleinopathy: clearance versus spread of α-synuclein
Birnbaum, E., & Yue, Z. (2025) · Autophagy Reports · doi:10.1080/27694127.2025.2577406 · Cited by 10
Autophagy–NAD+ axis: emerging insights into neuronal homeostasis and neurodegenerative diseases
Koçak, G., Dimas, M. M., Silva, L., Silva-Amaral, D., Sun, C., Cruddas, S., Barrett, T. G., Martins‐de‐Souza, D., Cunha‐Neto, E., Brocardo, P. S., et al. (2025) · Frontiers in Molecular Biosciences · doi:10.3389/fmolb.2025.1695486 · Cited by 8
Genetically encoded fluorescent reporters to visualize α-synuclein pathology in live brain
Zhang, L. I., Yu, M., Chen, G., Ge, S., Wang, M., Zhang, X., Zhao, M., Gu, H., Huang, M., Liu, A., et al. (2026) · Cell · doi:10.1016/j.cell.2026.01.035 · Cited by 10
GHSR deficiency exacerbates Parkinson's disease pathology by impairing autophagy
Xiao, X., Tang, T., Bi, M., Liu, J., Liu, M., Jiao, Q., Chen, X., Yan, C., Du, X., & Jiang, H. F. (2024) · Redox Biology · doi:10.1016/j.redox.2024.103322 · Cited by 8
Macroautophagy of Aggregation-Prone Proteins in Neurodegenerative Disease
Fox, L. M., & Yamamoto, A. (2015) · Elsevier eBooks · doi:10.1016/b978-0-12-801043-3.00007-8 · Cited by 9
Shining a light on autophagy in neurodegenerative diseases
Chandran, A., & Rochet, J. (2021) · Journal of Biological Chemistry · doi:10.1016/j.jbc.2021.101437 · Cited by 8
Berrío Sánchez, J., Cucarian Hurtado, J., Barcos Nunes, R., & de Oliveira, A. A. (2019) · Reviews in the Neurosciences · doi:10.1515/revneuro-2018-0011 · Cited by 7
Hansen, M. L., Ambjørn, M., Harndahl, M. N., Benned‐Jensen, T., Fog, K., Bjerregaard-Andersen, K., & Sotty, F. (2024) · Cells · doi:10.3390/cells13030253 · Cited by 7
Noda, S., Sato, S., Yamakado, H., Takahashi, R., & Hattori, N. (2025) · Biochemical and Biophysical Research Communications · doi:10.1016/j.bbrc.2025.151514 · Cited by 7
Alpha-synuclein inclusions reduced by PIKfyve inhibition in Parkinson disease cell models
Pozo, S. L. D., Uras, G., Fierli, F., Lentini, V., Koletsi, S., Lazaro-Hernandez, C., Chau, K., Hughes, D. A., & Schapira, A. H. V. (2025) · Neurobiology of Disease · doi:10.1016/j.nbd.2025.107053 · Cited by 7
Kimura, K., Inoue, K., Kuroiwa, Y., Tanaka, F., & Takada, M. (2016) · PLoS ONE · doi:10.1371/journal.pone.0166861 · Cited by 8
Lashuel, H. A. (2020) · Journal of Neurochemistry · doi:10.1111/jnc.15275 · Cited by 7
Hu, Q., Lingli, X., Liu, X., Wang, Y., & Yuan, J. (2023) · Neuroscience Letters · doi:10.1016/j.neulet.2023.137610 · Cited by 6
Serra, M., Faustini, G., Brembati, V., Casu, M. A., Pizzi, M., Morelli, M., Pinna, A., & Bellucci, A. (2024) · Experimental Neurology · doi:10.1016/j.expneurol.2024.115040 · Cited by 6
Pariary, R., Bhattacharyya, D., & Bhunia, A. (2019) · Gene Reports · doi:10.1016/j.genrep.2019.100423 · Cited by 6
Pathways of protein synthesis and degradation in PD pathogenesis
Langston, R. G., & Cookson, M. (2020) · Progress in brain research · doi:10.1016/bs.pbr.2020.01.002 · Cited by 7
FRET‐based assay for intracellular evaluation of α‐synuclein aggregation inhibitors
Galkin, M., Priss, A., Topcheva, O., Yushchenko, D. A., & Shvadchak, V. V. (2021) · Journal of Neurochemistry · doi:10.1111/jnc.15528 · Cited by 6
Serdiuk, T., Redeker, V., Savistchenko, J., Neupane, S., Haenseler, W., Fleischmann, Y., Reber, V., Keller, S., Tiberi, C., Bachmann-Gagescu, R., et al. (2026) · Molecular Systems Biology · doi:10.1038/s44320-026-00199-5 · Cited by 5
Multiple tethers of organelle contact sites are involved in α-synuclein toxicity in yeast
Vecchio, M. D., Amado, L., Cogan, A. P., Meert, E. M. K., Rosseels, J., Franssens, V., Govers, S. K., Winderickx, J., & Montoro, A. G. (2023) · Molecular Biology of the Cell · doi:10.1091/mbc.e23-01-0029 · Cited by 4
Effects of caloric restriction on retinal aging and neurodegeneration
Adornetto, A., Morrone, L. A., Satriano, A., Laganà, M. L., Licastro, E., Nucci, C., Corasaniti, M. T., Tonin, P., Bagetta, G., & Russo, R. (2020) · Progress in brain research · doi:10.1016/bs.pbr.2020.07.005 · Cited by 6
Inhibition of Phosphorylated Alpha-Synuclein Aggregation by Synthetic Protein Mimetics and Foldamers
Oldani, E. G., Stillman, N. H., Dohoney, R. A., Baysah, C. Z., & Kumar, S. (2024) · ACS Chemical Neuroscience · doi:10.1021/acschemneuro.4c00546 · Cited by 5
Erekat, N. S. (2025) · Clinical Anatomy · doi:10.1002/ca.70057 · Cited by 4
Mahul‐Mellier, A., van den Heuvel, L., Teixeira, M., Boussouf, M. L. N., Oudinot, G., Thonet, A., Speri, D., Jasiqi, Y., Ulrich, C. H., Sheta, R., et al. (2026) · Science Advances · doi:10.1126/sciadv.aed8851 · Cited by 4
The effect of AKT inhibition in α-synuclein-dependent neurodegeneration
Ranxhi, B., Bangash, Z. R., Chbihi, Z. M., Todi, S. V., LeWitt, P. A., & Tsou, W. (2025) · Frontiers in Molecular Neuroscience · doi:10.3389/fnmol.2025.1524044 · Cited by 4
Sulatsky, M. I., Stepanenko, O. V., Stepanenko, O. V., Mikhailova, E. V., & Sulatskaya, A. I. (2025) · International Journal of Biological Macromolecules · doi:10.1016/j.ijbiomac.2025.140971 · Cited by 4
Tian, Y., Zheng, X., Li, R., Li, H., Shui, X., Wang, L., Chen, D., Lee, T. H., & Zhang, T. (2023) · Molecular Neurobiology · doi:10.1007/s12035-023-03674-4 · Cited by 4
FABP5-binding lipids regulate autophagy in differentiated SH-SY5Y cells
Soto-Avellaneda, A., Oxford, A. E., Halla, F., Vasquez, P., Oe, E., Pugel, A. D., Schoenfeld, A. M., Tillman, M. C., Cuevas, A. R., Ortlund, E. A., et al. (2024) · PLoS ONE · doi:10.1371/journal.pone.0300168 · Cited by 4
Dakik, H., Mantash, S., Nehme, A., Kobeissy, F. H., Zabet‐Moghaddam, M., Mirzaei, P., Mechref, Y. S., Gaillard, A., Prestoz, L., & Zibara, K. (2021) · Frontiers in Neuroscience · doi:10.3389/fnins.2021.621121 · Cited by 4
Mahul‐Mellier, A., Altay, M. F., Maharjan, N., Ait‐Bouziad, N., Chiki, A., Jagannath, S., Limorenko, G., Novello, S., Ricci, J., Vingill, S., et al. (2024) · bioRxiv (Cold Spring Harbor Laboratory) · doi:10.1101/2024.11.29.625993 · Cited by 4
Shimizu, T., Isik, S., Kamath, N., & Yue, Z. (2026) · Translational Neurodegeneration · doi:10.1186/s40035-026-00555-3 · Cited by 3
Coronin1A Regulates the Trafficking of Alpha Synuclein in Microglia
Biggs, K. E., Fikse, E. N., Anderson, F. L., Kettenbach, A. N., & Havrda, M. C. (2025) · Journal of Neuroscience · doi:10.1523/jneurosci.1337-24.2025 · Cited by 4
Pathological α-synuclein elicits granulovacuolar degeneration independent of tau
Dues, D. J., Erb, M. L., Kasen, A., Vatsa, N., Williams, E. T., Nguyen, A. P. T., Henderson, M. X., & Moore, D. J. (2025) · Translational Neurodegeneration · doi:10.1186/s40035-025-00494-5 · Cited by 3
Drouin‐Ouellet, J., Pircs, K., Legault, E. M., Birtele, M., Nilsson, F., Shrigley, S., Pereira, M., Storm, P., Sharma, Y., Vuono, R., et al. (2021) · bioRxiv (Cold Spring Harbor Laboratory) · doi:10.1101/2021.04.23.441070 · Cited by 3
Kumar, S. T., Mahul‐Mellier, A., Hegde, R. N., Moons, R., Magalhães, P., de Opakua, A. I., Rivière, G., Rostami, I., Donzelli, S., Zweckstetter, M., et al. (2021) · bioRxiv (Cold Spring Harbor Laboratory) · doi:10.1101/2021.11.21.469421 · Cited by 3
Serdiuk, T., Redeker, V., Savistchenko, J., Neupane, S., Haenseler, W., Fleischmann, Y., Reber, V., Keller, S., Tiberi, C., Bachmann‐Gagescu, R., et al. (2025) · bioRxiv (Cold Spring Harbor Laboratory) · doi:10.1101/2025.10.13.682210 · Cited by 3
Mahul‐Mellier, A., van den Heuvel, L., Teixeira, M., Boussouf, M. L. N., Oudinot, G., Thonet, A., Speri, D., Jasiqi, Y., Ulrich, C. H., Sheta, R., et al. (2025) · bioRxiv (Cold Spring Harbor Laboratory) · doi:10.1101/2025.10.26.684610 · Cited by 3
Silencing of Tctex1 impairs autophagy lysosomal degradation of α-synuclein and cell viability
Zhang, Y., Dong, S., Liu, Z., Ming, J., Sun, Z., Li, X., Cai, Z., & Li, X. (2018) · Neuroreport · doi:10.1097/wnr.0000000000000979 · Cited by 2
Noda, S., & Hattori, N. (2025) · Molecular Brain · doi:10.1186/s13041-025-01235-5 · Cited by 2
Autophagy dysfunction in iPSCs-derived neurons and midbrain organoids carrying a SNCA triplication
Serra-Almeida, C., Jarazo, J., Gomez‐Giro, G., Rosety, I., Žagare, A., Ferrante, D., Saraiva, C., Frangenberg, D., Modamio, J., Zuccoli, E., et al. (2026) · npj Parkinson s Disease · doi:10.1038/s41531-026-01330-x · Cited by 4
FAM48A mediates compensatory autophagy induced by proteasome impairment
Arata, Y., Watanabe, A., Motosugi, R., Iemura, S., Natsume, T., Mukai, K., Taguchi, T., Hirayama, S., Hamazaki, J., & Murata, S. (2019) · Genes to Cells · doi:10.1111/gtc.12708 · Cited by 2
Autophagy and Parkinson’s Disease
Ryan, L., Rob, M., He, J., & Rubinsztein, D. C. (2022) · Springer eBooks · doi:10.1007/978-3-031-15080-7_242 · Cited by 2
Protein aggregation in health and disease: A looking glass of two faces
de Andrade, G. C., Mota, M. F., Moreira-Ferreira, D. N., Silva, J. L., de Oliveira, G. A. P., & Marques, M. A. (2024) · Advances in protein chemistry and structural biology · doi:10.1016/bs.apcsb.2024.09.010 · Cited by 2
Immunotherapies for Movement Disorders: Parkinson’s Disease and Amyotrophic Lateral Sclerosis
Schutt, C. R., Gendelman, H. E., & Mosley, R. L. (2016) · Springer eBooks · doi:10.1007/978-3-319-44022-4_46 · Cited by 2
Wang, J., Tan, Y., Peng, Q., Zeng, W., Yang, X., Chen, C., Wu, Y., Xu, Y., & Cao, X. (2020) · Behavioural Brain Research · doi:10.1016/j.bbr.2020.112786 · Cited by 2
Protein Interaction Studies for Understanding the Tremor Pathway in Parkinson’s Disease
Dogra, N., Mani, R. J., & Katare, D. P. (2020) · CNS & Neurological Disorders - Drug Targets · doi:10.2174/1871527319666200905115548 · Cited by 2
Lashuel, H. A., Mahul‐Mellier, A., Novello, S., Hegde, R. N., Jasiqi, Y., Altay, M. F., Donzelli, S., DeGuire, S. M., Burai, R., Magalhães, P., et al. (2022) · bioRxiv (Cold Spring Harbor Laboratory) · doi:10.1101/2022.03.30.486322 · Cited by 2
Mueller, T., Jeffrey, P., He, Y., Ouyang, X., Westbrook, D. G., Darley-Usmar, V. M., Goldberg, M. S., Volpicelli‐Daley, L. A., & Zhang, J. (2024) · bioRxiv (Cold Spring Harbor Laboratory) · doi:10.1101/2024.09.18.613763 · Cited by 2
Self-citationLiu, R., & Liu, X. (2025) · Journal of Biomolecular Structure and Dynamics · doi:10.1080/07391102.2025.2528927 · Cited by 1
Dobria, A., Suarez, A. A., Whitmarsh‐Everiss, T., Pavlinov, I., Soliz, V., Hippman, R. S., Petersson, T., Petros, Z. A., & Aldrich, L. N. (2026) · ACS Pharmacology & Translational Science · doi:10.1021/acsptsci.5c00780 · Cited by 1
Autophagy and Parkinson’s Disease
Ryan, L., Rob, M., He, J., & Rubinsztein, D. C. (2021) · Springer eBooks · doi:10.1007/978-3-030-71519-9_242-1 · Cited by 1
Investigating Autophagy Dysfunction Induced by a Parkinson's Disease-Causing Mutation in VPS35
Rahman, A. A. (2018) · ScholarWorks (Boise State University) · doi:10.18122/td/1488/boisestate · Cited by 1
Stillman, N. H., Joseph, J. A., Ahmed, J., Dohoney, R. A., Ball, T. D., Thomas, A. G., Fitch, T. C., Donnelly, C. M., & Kumar, S. (2022) · bioRxiv (Cold Spring Harbor Laboratory) · doi:10.1101/2022.07.11.499659 · Cited by 1
Lentini, V., Uras, G., Manca, A., Faqir, M. A. E., Pozo, S. L. D., Deiana, N., Cao, G., Schapira, A. H. V., & Pantaleo, A. (2024) · bioRxiv (Cold Spring Harbor Laboratory) · doi:10.1101/2024.10.25.620204 · Cited by 1
Savolainen, M. H. (2015) · Työväentutkimus Vuosikirja
C URRENT OPINION The pallidopyramidal syndromes: nosology, aetiology and pathogenesis
Kara, E., Hardy, J., & Houlden, H. (2013)
Alpha-synuclein expression influences the processing of the amyloid precursor protein
Hall‐Roberts, H. (2016) · The University of Bath Online Publications Store (The University of Bath)
Protein Oxidation, Quality-Control Mechanisms and Parkinson’s Disease
Hernández-Franco, P., Anandhan, A., & Franco, R. (2017) · Royal Society of Chemistry eBooks · doi:10.1039/9781782622888-00277
Stan, D. M. (2018) · University of Salford Institutional Repository (University of Salford)
Masaracchia, C. (2018) · eDiss (Georg-August-Universität Göttingen) · doi:10.53846/goediss-7134
Uncovering active modulators of native macroautophagy through novel high-content screensPreprint
Safren, N., Tank, E., Santoro, N., & Barmada, S. J. (2019) · bioRxiv (Cold Spring Harbor Laboratory) · doi:10.1101/756973
Joppe, K. (2020) · eDiss (Georg-August-Universität Göttingen) · doi:10.53846/goediss-8016
Autophagy Regulation by Lipid Factors with Implications for Parkinson's Disease
Soto-Avellaneda, A. (2021) · ScholarWorks (Boise State University) · doi:10.18122/td.1847.boisestate
Khare, V., Gupta, S., Bisht, P., & Garabadu, D. (2022) · Elsevier eBooks · doi:10.1016/b978-0-323-85544-0.00013-7
Sterol Biomarker Discovery In Neurodegenerative Diseases
Pacciarini, M. (2023) · Cronfa (Swansea University) · doi:10.23889/suthesis.65375
Prasanth, M. I., Malar, D. S., & Tencomnao, T. (2024) · BENTHAM SCIENCE PUBLISHERS eBooks · doi:10.2174/9789815238273124020008
Pathophysiological Basis of Neurodegeneration in Parkinson’s Disease
Galindo, L. S. M., González‐Escamilla, G., & Groppa, S. (2024) · Neuromethods · doi:10.1007/978-1-0716-4083-8_1
Leite, D. M., Lenham, R., Malko, P., Thomson, S., Phillips, T., Rosenstock, T. R., & Mirza, N. R. (2025) · bioRxiv (Cold Spring Harbor Laboratory) · doi:10.1101/2025.06.24.661057
Autophagy and Neurodegenerative Diseases
Barbosa, A. D., Palmer, J. E., Li, X., & Rubinsztein, D. C. (2025) · Learning materials in biosciences · doi:10.1007/978-3-031-88121-3_6
Çınar, E., Çakmaklı, G. Y., Akyel, H., Ulusoy, A., Tel, B. C., & Elibol, B. (2025) · Pharmacology Biochemistry and Behavior · doi:10.1016/j.pbb.2025.174096
Chen, X., Shi, C., He, M., & Xia, X. (2025) · Medicine · doi:10.1097/md.0000000000044416
Metadata
- Authors
- Tanik, S. A., Schultheiss, C. E., Volpicelli-Daley, L. A., Brunden, K. R., & Lee, V. M. Y.
- Affiliations
- University of Pennsylvania (US)
- Corresponding author
- Lee, Virginia M.Y.
- Venue
- Journal of Biological Chemistry
- Publisher
- Elsevier BV
- Published
- 2013-05
- Volume
- 288
- Issue
- 21
- Pages
- 15194-15210
- ISSN
- 0021-9258 (ISSN-L)
- PMC
- PMC3663539
- OpenAlex
- W2017642230
- Cited by
- 326
- References
- 83
- Citations by year
- 2026: 17 · 2025: 23 · 2024: 25 · 2023: 11 · 2022: 27 · 2021: 28 · 2020: 40 · 2019: 40 · 2018: 28 · 2017: 26 · 2016: 23 · 2015: 18 · 2014: 15 · 2013: 5
- FWCI
- 12.91
- Type
- journal article
- Language
- en
- Open access
- hybrid
- doi.org
- Licence
- Locations
- Journal of Biological Chemistry (publishedVersion, cc-by)
- Europe PMC (PubMed Central) (publishedVersion)
- PubMed Central (publishedVersion)
- PubMed (publishedVersion)
- Funders
- Cedars-Sinai Medical Center
- National Institutes of Health (NS053488)
- National Institute of Neurological Disorders and Stroke (NS053488, P50NS053488)
- Topics
- Health Sciences › Medicine › Clinical Neurology › Parkinson's Disease Mechanisms and Treatments
- Life Sciences › Biochemistry, Genetics and Molecular Biology › Cell Biology › Autophagy in Disease and Therapy
- Life Sciences › Neuroscience › Cellular and Molecular Neuroscience › Alzheimer's disease research and treatments
- Keywords
- alpha-synuclein, Lewy bodies, macroautophagy, autophagosome maturation, Parkinson's disease, neurodegeneration, proteasomal degradation, autophagy dysfunction, neuronal cell death
- MeSH terms
- Animals, Autophagy, HeLa Cells, Humans, Models, Biological, Neurons, Parkinson Disease, Lewy Bodies, Proteasome Endopeptidase Complex, Mice, alpha-Synuclein, HEK293 Cells, Proteolysis
About these checks
Registry, retraction, Cites and statistics results are computed, not judged, with one exception: a printed reference that no index lists is read once by a model before it counts as a citation error. Claims are extracted by a model and kept only when their quote appears verbatim in the text; each cited source is then checked, with a model’s help, for whether it says what the claim relies on. Those verdicts can be wrong — read the claim’s quote and the cited source before relying on one.
Statistics and arithmetic are recomputed, not judged.
Confidence bands are shown only for fields calibrated on our annotated test set. None is calibrated yet, so no band is shown.
What counts as a claim ›How we measure confidence ›How we check this ›
Are you an author, or do you see a problem with this page? Request a review
