Cited by 73

The DOI matches its Crossref record; 10 of the 10 references it cites were found in a registry or an index.

TGFB-INHB/activin signaling regulates age-dependent autophagy and cardiac health through inhibition of MTORC2

Chang, Kai, Kang, Ping, Liu, Ying, Huang, Kerui, Miao, Ting, Sagona, Antonia P., Nezis, Ioannis P., Bodmer, Rolf, Ocorr, Karen, Bai, Hua·2020·Autophagy

Overview

The claims and statistics of this paper haven’t been checked yet.

Run the check — free, no account needed. It reads the open-access text and checks the sources it cites.

A few free checks a day · papers already verified open instantly · results are public

Integrity signals

Registry

Crossref · 10.1080/15548627.2019.1704117

Cites

10 of 10 references verified0 citation errors · 0 not checkable

Statistics

Figures

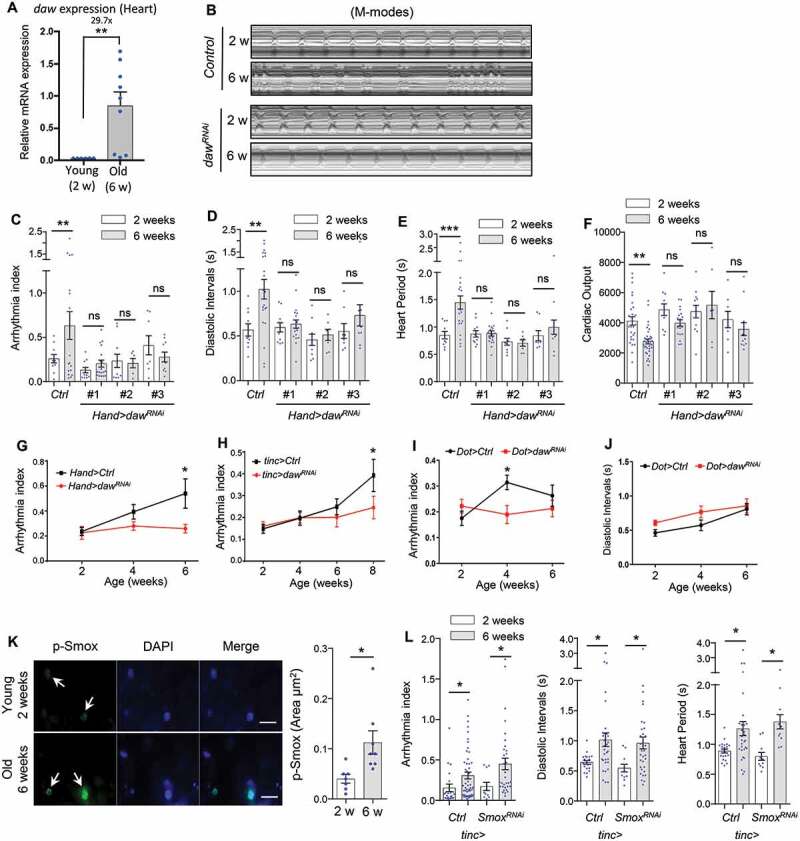
Figure 1. Heart-specific knockdown of daw slows cardiac aging. (A) QRT-PCR analysis of daw expression in young and old fly hearts. N = 3. Student t-test (** p < 0.01). (B) Representative M-mode traces (8 s) showing age-dependent movement of heart wall in control and heart-specific daw knockdown flies (Hand-gal4> UAS-dawRNAi). (C-F) Age-related changes in arrhythmia index, diastolic intervals, heart period, and cardiac output in control (Ctrl) and cardiac-specific daw knockdown flies (dawRNAi). Flies were cultured at 40% relative humidity. Hand-gal4 driver was used to knockdown gene expression specifically in cardiac tissues (cardiomyocytes and pericardial cells). Results from three independent UAS-dawRNAi lines are shown (RNAi #1: BDSC, 34974, RNAi #2: Vienna Drosophila Resource Center, 105309, RNAi #3: BDSC, 50911). N = 7 ~ 20. Two-way ANOVA followed by Tukey multiple comparisons test (* p < 0.05, ** p < 0.01, *** p < 0.001, ns = not significant). The interaction between genotype and age is statistically significant for heart period (p = 0.0041) and diastolic interval (p = 0.0243). (G-I) Age-dependent changes in cardiac arrhythmia between control and daw knockdown using various tissue drivers, Hand-gal4 (cardiomyocytes and pericardial cells), tinc-gal4 (cardiomyocytes), and Dot-gal4 (pericardial cells). N = 25 ~ 31. Student t-test (* p < 0.05, ** p < 0.01, *** p < 0.001). (J) Age-dependent changes in diastolic intervals between control and daw knockdown in pericardial cells (Dot-gal4). N = 13 ~ 26. Student t-test (* p < 0.05, ** p < 0.01, *** p < 0.001). (K) Immunostaining of p-Smox in fly hearts at young (2 weeks) and old ages (6 weeks). Arrows indicate cardiomyocyte nuclei and positive p-Smox staining. Scale bar: 20 μm. Quantification shown on the right. N = 8. Student t-test (* p < 0.05). Data are represented as mean ± SEM in all figures. (L) Age-dependent changes in arrhythmia index, diastolic intervals, heart period between control and Smox knockdown (tinc-gal4). N = 11 ~ 31. Student t-test (* p < 0.05).
Figure 1. Heart-specific knockdown of daw slows cardiac aging. (A) QRT-PCR analysis of daw expression in young and old fly hearts. N = 3. Student t-test (** p < 0.01). (B) Representative M-mode traces (8 s) showing age-dependent movement of heart wall in control and heart-specific daw knockdown flies (Hand-gal4> UAS-dawRNAi). (C-F) Age-related changes in arrhythmia index, diastolic intervals, heart period, and cardiac output in control (Ctrl) and cardiac-specific daw knockdown flies (dawRNAi). Flies were cultured at 40% relative humidity. Hand-gal4 driver was used to knockdown gene expression specifically in cardiac tissues (cardiomyocytes and pericardial cells). Results from three independent UAS-dawRNAi lines are shown (RNAi #1: BDSC, 34974, RNAi #2: Vienna Drosophila Resource Center, 105309, RNAi #3: BDSC, 50911). N = 7 ~ 20. Two-way ANOVA followed by Tukey multiple comparisons test (* p < 0.05, ** p < 0.01, *** p < 0.001, ns = not significant). The interaction between genotype and age is statistically significant for heart period (p = 0.0041) and diastolic interval (p = 0.0243). (G-I) Age-dependent changes in cardiac arrhythmia between control and daw knockdown using various tissue drivers, Hand-gal4 (cardiomyocytes and pericardial cells), tinc-gal4 (cardiomyocytes), and Dot-gal4 (pericardial cells). N = 25 ~ 31. Student t-test (* p < 0.05, ** p < 0.01, *** p < 0.001). (J) Age-dependent changes in diastolic intervals between control and daw knockdown in pericardial cells (Dot-gal4). N = 13 ~ 26. Student t-test (* p < 0.05, ** p < 0.01, *** p < 0.001). (K) Immunostaining of p-Smox in fly hearts at young (2 weeks) and old ages (6 weeks). Arrows indicate cardiomyocyte nuclei and positive p-Smox staining. Scale bar: 20 μm. Quantification shown on the right. N = 8. Student t-test (* p < 0.05). Data are represented as mean ± SEM in all figures. (L) Age-dependent changes in arrhythmia index, diastolic intervals, heart period between control and Smox knockdown (tinc-gal4). N = 11 ~ 31. Student t-test (* p < 0.05).CC BY · PubMed Central
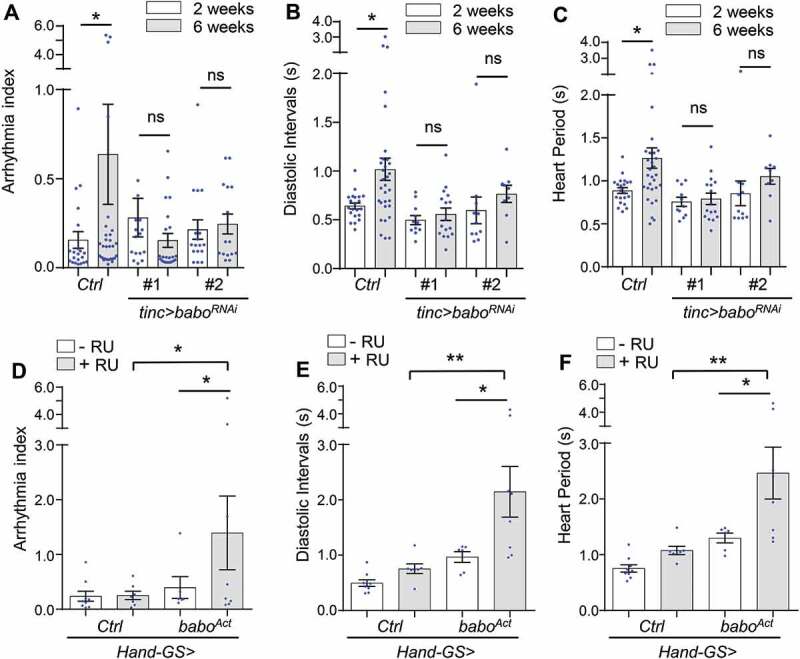
Figure 2. Cardiomyocyte-specific knockdown of INHB/activin receptor babo delays cardiac aging. (A-C) Age-dependent changes in cardiac arrhythmia, diastolic intervals, and heart period in control (Ctrl) and cardiomyocyte-specific babo knockdown flies (babo RNAi). Flies were cultured at 40% relative humidity. tinc-gal4 driver was used. Results from two independent UAS-baboRNAi lines are shown (RNAi #1: BDSC, 25933, RNAi #2: BDSC, 40866). N = 15 ~ 30. One-way ANOVA (*** p < 0.001, ** p < 0.01, * p < 0.05, ns = not significant). (D-F) Changes in cardiac arrhythmia, diastolic intervals, and heart period in fly hearts expressing constitutively activated babo (baboAct). GeneSwitch heart driver Hand-GS-gal4 was used to induce adult-onset babo activation. RU: RU486 (Mifepristone). Flies were cultured at 40% relative humidity. N = 6 ~ 9. One-way ANOVA (*** p < 0.001, ** p < 0.01, * p < 0.05, ns = not significant).
Figure 2. Cardiomyocyte-specific knockdown of INHB/activin receptor babo delays cardiac aging. (A-C) Age-dependent changes in cardiac arrhythmia, diastolic intervals, and heart period in control (Ctrl) and cardiomyocyte-specific babo knockdown flies (babo RNAi). Flies were cultured at 40% relative humidity. tinc-gal4 driver was used. Results from two independent UAS-baboRNAi lines are shown (RNAi #1: BDSC, 25933, RNAi #2: BDSC, 40866). N = 15 ~ 30. One-way ANOVA (*** p < 0.001, ** p < 0.01, * p < 0.05, ns = not significant). (D-F) Changes in cardiac arrhythmia, diastolic intervals, and heart period in fly hearts expressing constitutively activated babo (baboAct). GeneSwitch heart driver Hand-GS-gal4 was used to induce adult-onset babo activation. RU: RU486 (Mifepristone). Flies were cultured at 40% relative humidity. N = 6 ~ 9. One-way ANOVA (*** p < 0.001, ** p < 0.01, * p < 0.05, ns = not significant).CC BY · PubMed Central
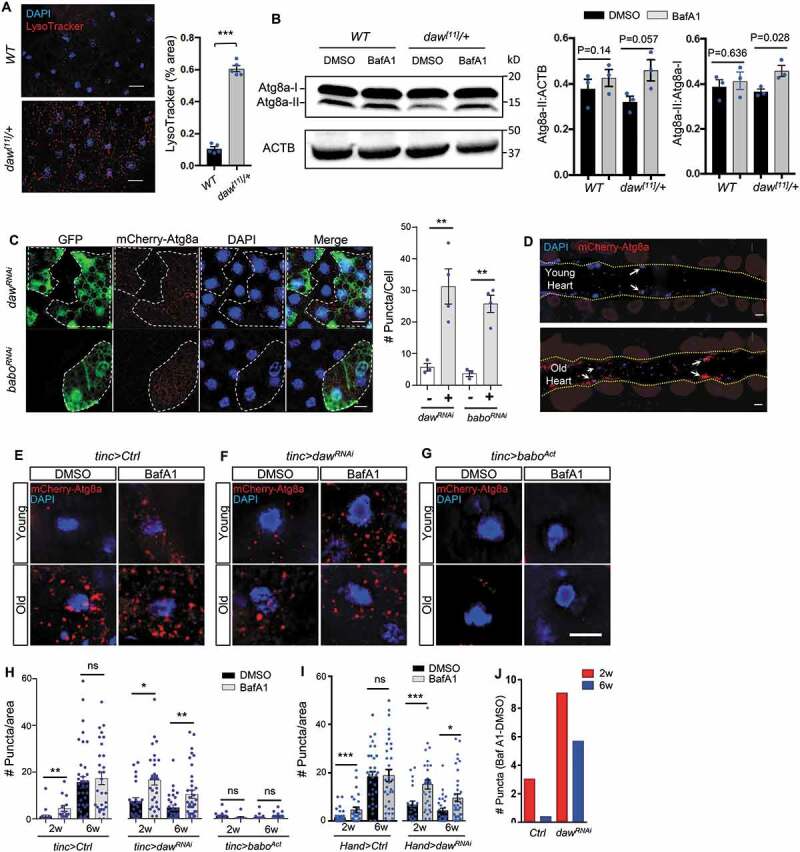
Figure 3. Daw negatively regulates autophagy in fly hearts. (A) Representative images of LysoTracker staining of young adult fat body between wild-type (WT) and heterozygous daw[11]/+ mutants. Scale bar: 20 μm. Quantification shown on the right. N = 5. Student t-test (*** p < 0.001). (B) Western blot analysis on Atg8a lipidation between WT and daw[11]/+ mutants. GABARAP antibodies were used to detect Atg8a. The lower band represents lipidated Atg8a (Atg8a-II), and the upper band represents non-lipidated Atg8a (Atg8a-I). Abdominal fly carcass is incubated with 5 μM of BafA1 prior to western blots. ACTB (actin beta) is used as the loading control. Quantification of band intensity shown on the right. N = 3. Student t-test (*** p < 0.001). (C) Representative images of mosaic analysis on autophagosome staining in larval fat body. Fat body clones were generated by crossing dawRNAi and baboRNAi lines into a FLPout line carrying mCherry-Atg8a reporter (hs-flp; endogenous P-3xmCherry-Atg8a, UAS-GFP/Cyo; Act>CD2> Gal4,UAS-Dcr-2). RNAi Clones are GFP-positive cells (dashed lines). Scale bar: 20 μm. Quantification of autophagosome puncta shown on the right. N = 5. Student t-test (** p < 0.01). (D) Representative images of fly hearts expressing autophagosome reporter mCherry-Atg8a at both young and old ages. Arrows indicate cardiomyocyte nuclei and surrounding autophagosomes. Abdominal segments A2-A3 are shown. Heart tube is located between two yellow dashed lines. (E-G) Representative images of mCherry-Atg8a reporter surrounding cardiomyocyte nuclei in control, dawRNAi, and baboAct flies with or without BafA1 treatment. Semi-intact hearts were incubated with 100 nM of bafilomycin A1 (BafA1) for 2 h prior to immunostaining. Scale bar: 10 μm. (H) Quantification of age-dependent changes in autophagic flux in control, dawRNAi, and baboAct fly hearts. tinc-gal4 was used to drive the expression of mCherry-Atg8a reporter and gene knockdown. N = 5 ~ 7. One-way ANOVA (*** p < 0.001, ** p < 0.01, * p < 0.05, ns = not significant). (I) Quantification of age-dependent changes in autophagic flux in control and dawRNAi fly hearts. Hand -gal4 was used to drive the expression of mCherry-Atg8a reporter and daw knockdown. N = 5 ~ 7. One-way ANOVA (*** p < 0.001, ** p < 0.01, * p < 0.05, ns = not significant). (J) Quantification of BafA1-induced mCherry-Atg8a-positive puncta between control and dawRNAi. The data represent the differences in the number of puncta between BafA1 and DMSO treatments.
Figure 3. Daw negatively regulates autophagy in fly hearts. (A) Representative images of LysoTracker staining of young adult fat body between wild-type (WT) and heterozygous daw[11]/+ mutants. Scale bar: 20 μm. Quantification shown on the right. N = 5. Student t-test (*** p < 0.001). (B) Western blot analysis on Atg8a lipidation between WT and daw[11]/+ mutants. GABARAP antibodies were used to detect Atg8a. The lower band represents lipidated Atg8a (Atg8a-II), and the upper band represents non-lipidated Atg8a (Atg8a-I). Abdominal fly carcass is incubated with 5 μM of BafA1 prior to western blots. ACTB (actin beta) is used as the loading control. Quantification of band intensity shown on the right. N = 3. Student t-test (*** p < 0.001). (C) Representative images of mosaic analysis on autophagosome staining in larval fat body. Fat body clones were generated by crossing dawRNAi and baboRNAi lines into a FLPout line carrying mCherry-Atg8a reporter (hs-flp; endogenous P-3xmCherry-Atg8a, UAS-GFP/Cyo; Act>CD2> Gal4,UAS-Dcr-2). RNAi Clones are GFP-positive cells (dashed lines). Scale bar: 20 μm. Quantification of autophagosome puncta shown on the right. N = 5. Student t-test (** p < 0.01). (D) Representative images of fly hearts expressing autophagosome reporter mCherry-Atg8a at both young and old ages. Arrows indicate cardiomyocyte nuclei and surrounding autophagosomes. Abdominal segments A2-A3 are shown. Heart tube is located between two yellow dashed lines. (E-G) Representative images of mCherry-Atg8a reporter surrounding cardiomyocyte nuclei in control, dawRNAi, and baboAct flies with or without BafA1 treatment. Semi-intact hearts were incubated with 100 nM of bafilomycin A1 (BafA1) for 2 h prior to immunostaining. Scale bar: 10 μm. (H) Quantification of age-dependent changes in autophagic flux in control, dawRNAi, and baboAct fly hearts. tinc-gal4 was used to drive the expression of mCherry-Atg8a reporter and gene knockdown. N = 5 ~ 7. One-way ANOVA (*** p < 0.001, ** p < 0.01, * p < 0.05, ns = not significant). (I) Quantification of age-dependent changes in autophagic flux in control and dawRNAi fly hearts. Hand -gal4 was used to drive the expression of mCherry-Atg8a reporter and daw knockdown. N = 5 ~ 7. One-way ANOVA (*** p < 0.001, ** p < 0.01, * p < 0.05, ns = not significant). (J) Quantification of BafA1-induced mCherry-Atg8a-positive puncta between control and dawRNAi. The data represent the differences in the number of puncta between BafA1 and DMSO treatments.CC BY · PubMed Central
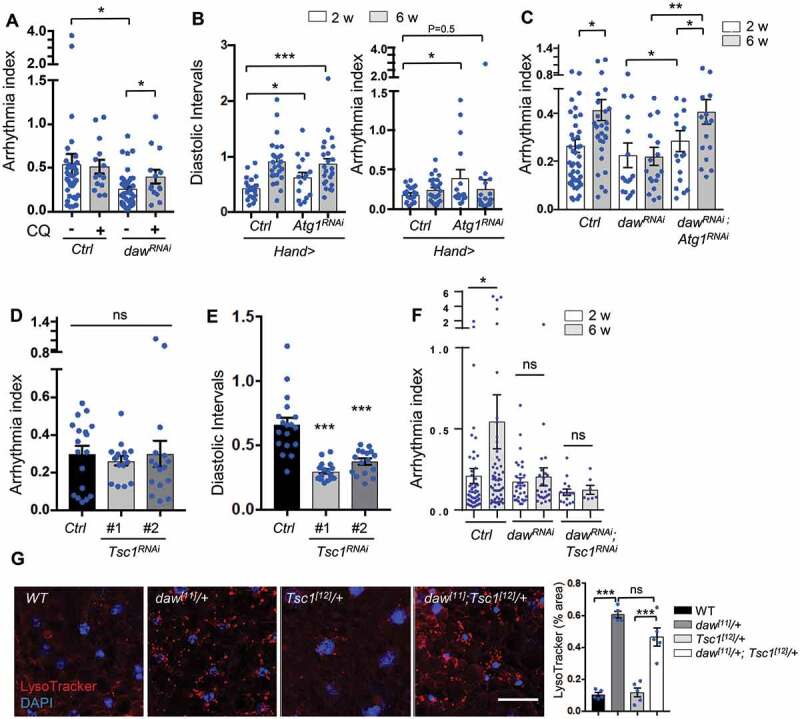
Figure 4. Inhibition of autophagy, but not activation of TORC1, blocks daw knockdown-mediated cardioprotection. (A) Cardiac arrhythmia of chloroquine-treated (20 mM, 24 h) 6-week-old control and daw knockdown flies (Hand-gal4 used). N = 14 ~ 38. One-way ANOVA (*** p < 0.001, ** p < 0.01, * p < 0.05, ns = not significant). (B) Cardiac diastolic intervals and arrhythmia in heart-specific knockdown of Atg1 at young and old ages (Hand-gal4 used). N = 16 ~ 19. One-way ANOVA (*** p < 0.001, * p < 0.05). (C) Age-dependent changes in cardiac arrhythmia in control, dawRNAi, and dawRNAi; Atg1RNAi flies (tinc-gal4 used). N = 16 ~ 35. One-way ANOVA (*** p < 0.001, ** p < 0.01, * p < 0.05, ns = not significant). (D-E) Cardiac arrhythmia and diastolic intervals of Tsc1 knockdown flies (tinc-gal4 used). Two independent Tsc1 RNAi lines were used (RNAi-1: BDSC, 52931, RNAi-2: BDSC, 54034). N = 16 ~ 18. One-way ANOVA (*** p < 0.001, ** p < 0.01, * p < 0.05, ns = not significant). (F) Age-dependent changes in cardiac arrhythmia in control, dawRNAi, and dawRNAi; Tsc1RNAi flies (tinc-gal4 used). N = 7 ~ 30. One-way ANOVA (*** p < 0.001, ** p < 0.01, * p < 0.05, ns = not significant). (G) Representative images of LysoTracker staining in adult fat body of WT, daw[11]/+, Tsc1[12]/+ and double mutants daw[11]/+; Tsc1[12]/+. Scale bar: 10 μm. Quantification shown on the right. N = 5. One-way ANOVA (*** p < 0.001, ** p < 0.01, * p < 0.05, ns = not significant).
Figure 4. Inhibition of autophagy, but not activation of TORC1, blocks daw knockdown-mediated cardioprotection. (A) Cardiac arrhythmia of chloroquine-treated (20 mM, 24 h) 6-week-old control and daw knockdown flies (Hand-gal4 used). N = 14 ~ 38. One-way ANOVA (*** p < 0.001, ** p < 0.01, * p < 0.05, ns = not significant). (B) Cardiac diastolic intervals and arrhythmia in heart-specific knockdown of Atg1 at young and old ages (Hand-gal4 used). N = 16 ~ 19. One-way ANOVA (*** p < 0.001, * p < 0.05). (C) Age-dependent changes in cardiac arrhythmia in control, dawRNAi, and dawRNAi; Atg1RNAi flies (tinc-gal4 used). N = 16 ~ 35. One-way ANOVA (*** p < 0.001, ** p < 0.01, * p < 0.05, ns = not significant). (D-E) Cardiac arrhythmia and diastolic intervals of Tsc1 knockdown flies (tinc-gal4 used). Two independent Tsc1 RNAi lines were used (RNAi-1: BDSC, 52931, RNAi-2: BDSC, 54034). N = 16 ~ 18. One-way ANOVA (*** p < 0.001, ** p < 0.01, * p < 0.05, ns = not significant). (F) Age-dependent changes in cardiac arrhythmia in control, dawRNAi, and dawRNAi; Tsc1RNAi flies (tinc-gal4 used). N = 7 ~ 30. One-way ANOVA (*** p < 0.001, ** p < 0.01, * p < 0.05, ns = not significant). (G) Representative images of LysoTracker staining in adult fat body of WT, daw[11]/+, Tsc1[12]/+ and double mutants daw[11]/+; Tsc1[12]/+. Scale bar: 10 μm. Quantification shown on the right. N = 5. One-way ANOVA (*** p < 0.001, ** p < 0.01, * p < 0.05, ns = not significant).CC BY · PubMed Central
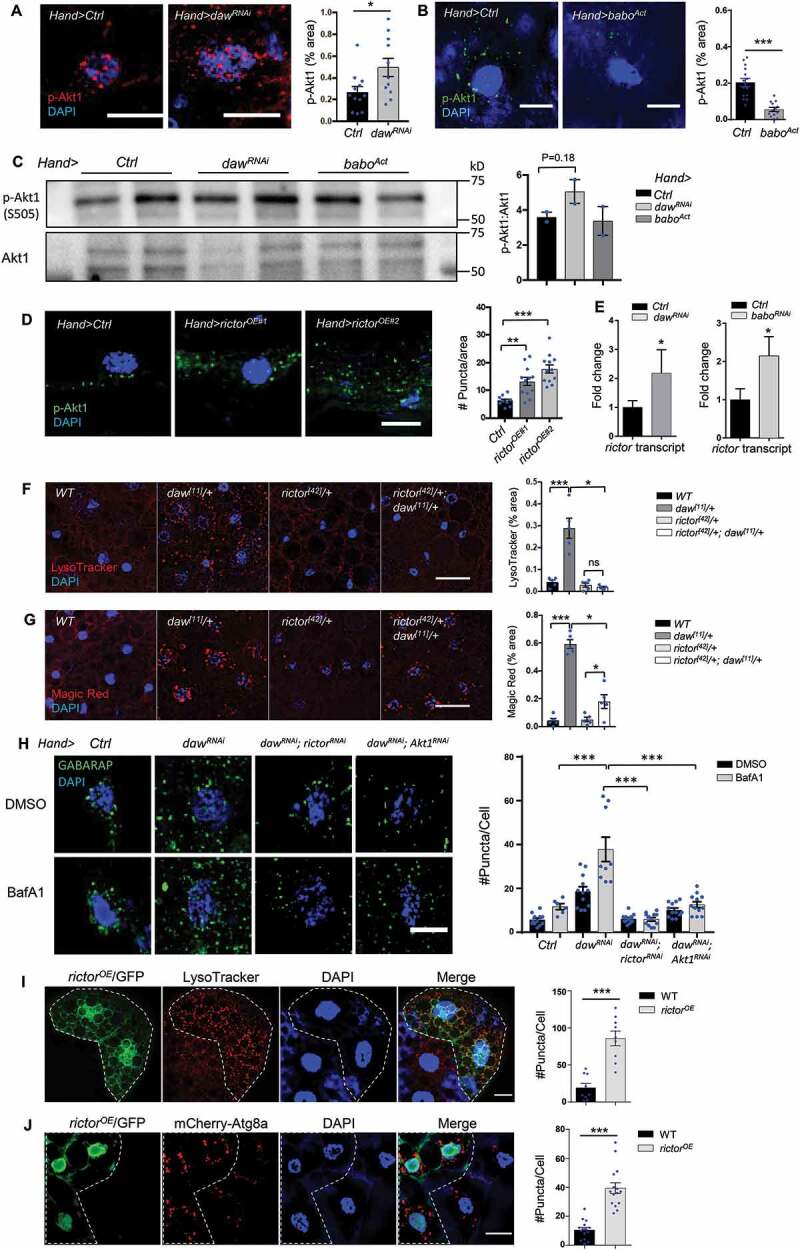
Figure 5. Daw genetically interacts with TORC2 (rictor) to control autophagy. (A) Representative images of p-Akt1 staining in cardiomyocytes of control and daw knockdown flies (Hand-gal4). Scale bar: 10 μm. Quantification shown on the right. N = 5. Student t-test (* p < 0.05). (B) Representative images of p-Akt1 staining in cardiomyocytes of control and babo-activated flies (Hand-gal4). Scale bar: 10 μm. Quantification shown on the right. N = 5. Student t-test (*** p < 0.001). (C) Western blot analysis on Akt1 phosphorylation of the hearts dissected from control, daw knockdown and babo-activated flies (Hand-gal4). Quantification of band intensity shown on the right. N = 3. Student t-test. (D) Representative images of p-Akt1 staining in cardiomyocytes of control and rictor overexpression (Hand-gal4). Two independent rictor overexpression used (#1: UAS-rictor, #2: UAS-HA-rictor [72]). Scale bar: 10 μm. Quantification shown on the right. N = 5. One-way ANOVA (*** p < 0.001, ** p < 0.01, * p < 0.05, ns = not significant). (E) QRT-PCR analysis of rictor expression in fly hearts with daw and babo knockdown (Hand-gal4). N = 3. Student t-test (* p < 0.05). (F) Representative images of LysoTracker staining in adult fat body of WT, daw[11]/+, rictor[42]/+ and double mutants rictor[42]/+; daw[11]/+. Scale bar: 20 μm. Quantification shown on the right. N = 5. One-way ANOVA (*** p < 0.001, ** p < 0.01, * p < 0.05, ns = not significant). (G) Representative images of Magic Red staining in adult fat body of WT, daw[11]/+, rictor[42]/+ and double mutants rictor[42]/+; daw[11]/+. Scale bar: 20 μm. Quantification shown on the right. N = 5. One-way ANOVA (*** p < 0.001, ** p < 0.01, * p < 0.05, ns = not significant). (H) Representative images of GABARAP immunostaining in cardiomyocytes of BafA1-treated control, dawRNAi alone, dawRNAi; rictorRNAi, and dawRNAi; Akt1RNAi flies. Scale bar: 20 μm. Quantification shown on the right. N = 15. Student t-test (*** p < 0.001). (I) Representative images of mosaic analysis of LysoTracker staining in larval fat body. Fat body clones were generated by crossing rictor overexpression lines into a FLPout line (yw, hs-flp, UAS-CD8::GFP; Act>y+>Gal4,UAS-GFP.nls;UAS-Dcr-2). Clones with rictor overexpression are GFP-positive cells (dashed lines). Scale bar: 20 μm. (J) Representative images of mosaic analysis of autophagosome staining in larval fat body. Fat body clones were generated by crossing rictor overexpression lines into a FLPout line carrying mCherry-Atg8a reporter (hs-flp; endogenous P-3x mCherry-Atg8a, UAS-GFP/Cyo; Act>CD2> Gal4,UAS-Dcr-2). Clones with rictor overexpression are GFP-positive cells (dashed lines). Scale bar: 20 μm.
Figure 5. Daw genetically interacts with TORC2 (rictor) to control autophagy. (A) Representative images of p-Akt1 staining in cardiomyocytes of control and daw knockdown flies (Hand-gal4). Scale bar: 10 μm. Quantification shown on the right. N = 5. Student t-test (* p < 0.05). (B) Representative images of p-Akt1 staining in cardiomyocytes of control and babo-activated flies (Hand-gal4). Scale bar: 10 μm. Quantification shown on the right. N = 5. Student t-test (*** p < 0.001). (C) Western blot analysis on Akt1 phosphorylation of the hearts dissected from control, daw knockdown and babo-activated flies (Hand-gal4). Quantification of band intensity shown on the right. N = 3. Student t-test. (D) Representative images of p-Akt1 staining in cardiomyocytes of control and rictor overexpression (Hand-gal4). Two independent rictor overexpression used (#1: UAS-rictor, #2: UAS-HA-rictor [72]). Scale bar: 10 μm. Quantification shown on the right. N = 5. One-way ANOVA (*** p < 0.001, ** p < 0.01, * p < 0.05, ns = not significant). (E) QRT-PCR analysis of rictor expression in fly hearts with daw and babo knockdown (Hand-gal4). N = 3. Student t-test (* p < 0.05). (F) Representative images of LysoTracker staining in adult fat body of WT, daw[11]/+, rictor[42]/+ and double mutants rictor[42]/+; daw[11]/+. Scale bar: 20 μm. Quantification shown on the right. N = 5. One-way ANOVA (*** p < 0.001, ** p < 0.01, * p < 0.05, ns = not significant). (G) Representative images of Magic Red staining in adult fat body of WT, daw[11]/+, rictor[42]/+ and double mutants rictor[42]/+; daw[11]/+. Scale bar: 20 μm. Quantification shown on the right. N = 5. One-way ANOVA (*** p < 0.001, ** p < 0.01, * p < 0.05, ns = not significant). (H) Representative images of GABARAP immunostaining in cardiomyocytes of BafA1-treated control, dawRNAi alone, dawRNAi; rictorRNAi, and dawRNAi; Akt1RNAi flies. Scale bar: 20 μm. Quantification shown on the right. N = 15. Student t-test (*** p < 0.001). (I) Representative images of mosaic analysis of LysoTracker staining in larval fat body. Fat body clones were generated by crossing rictor overexpression lines into a FLPout line (yw, hs-flp, UAS-CD8::GFP; Act>y+>Gal4,UAS-GFP.nls;UAS-Dcr-2). Clones with rictor overexpression are GFP-positive cells (dashed lines). Scale bar: 20 μm. (J) Representative images of mosaic analysis of autophagosome staining in larval fat body. Fat body clones were generated by crossing rictor overexpression lines into a FLPout line carrying mCherry-Atg8a reporter (hs-flp; endogenous P-3x mCherry-Atg8a, UAS-GFP/Cyo; Act>CD2> Gal4,UAS-Dcr-2). Clones with rictor overexpression are GFP-positive cells (dashed lines). Scale bar: 20 μm.CC BY · PubMed Central
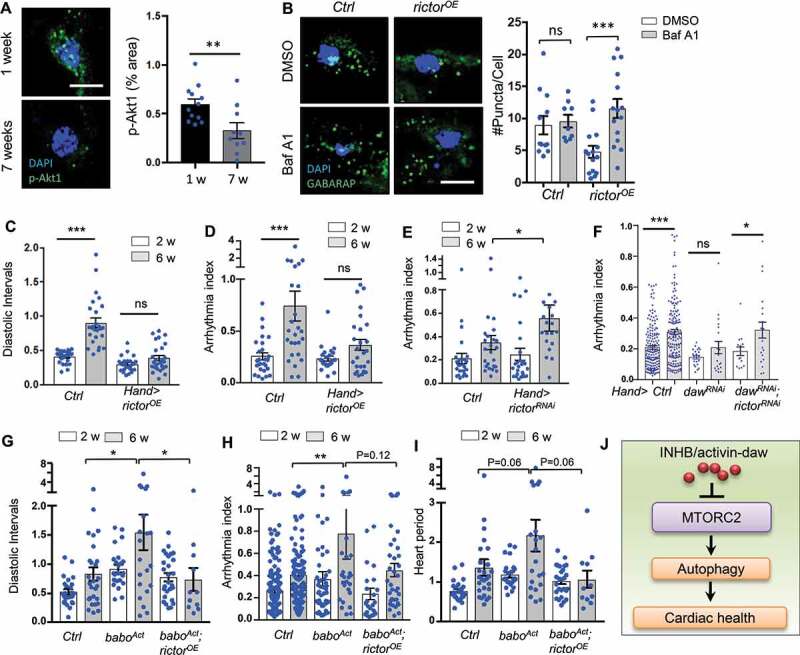
Figure 6. Heart-specific overexpression of rictor preserved cardiac function during aging. (A) Representative images of p-Akt1 staining in young and old cardiomyocytes of wild-type flies. Scale bar: 10 μm. Quantification shown on the right. N = 12. Student t-test (** p < 0.01). (B) Representative images of autophagic flux in control and rictor overexpressing cardiomyocytes at old ages (Hand-gal4). Scale bar: 10 μm. Quantification shown on the right. N = 15. One-way ANOVA (*** p < 0.001, ** p < 0.01, * p < 0.05, ns = not significant). (C-D) Diastolic intervals and arrhythmia index in flies with heart-specific overexpression of rictor (Hand-gal4). N = 19 ~ 26. One-way ANOVA (*** p < 0.001, ** p < 0.01, * p < 0.05, ns = not significant). (E) Cardiac arrhythmia index in flies with heart-specific knockdown of rictor. N = 24. One-way ANOVA (*** p < 0.001, ** p < 0.01, * p < 0.05, ns = not significant). (F) Cardiac arrhythmia index in flies with heart-specific knockdown of daw alone or daw; rictor double knockdown. N = 15 ~ 30. Student t-test (*** p < 0.001, * p < 0.05, ns = not significant). (G-I) Diastolic intervals, arrhythmia index, and heart period in flies with heart-specific expression of baboAct, or baboAct; rictorOE (Hand-gal4). N = 11 ~ 27. One-way ANOVA (*** p < 0.001, ** p < 0.01, * p < 0.05, ns = not significant). (J) Proposed model: INHB/activin-mediated inhibition of MTORC2 as a novel mechanism for age-dependent regulation of autophagy and cardiac health.
Figure 6. Heart-specific overexpression of rictor preserved cardiac function during aging. (A) Representative images of p-Akt1 staining in young and old cardiomyocytes of wild-type flies. Scale bar: 10 μm. Quantification shown on the right. N = 12. Student t-test (** p < 0.01). (B) Representative images of autophagic flux in control and rictor overexpressing cardiomyocytes at old ages (Hand-gal4). Scale bar: 10 μm. Quantification shown on the right. N = 15. One-way ANOVA (*** p < 0.001, ** p < 0.01, * p < 0.05, ns = not significant). (C-D) Diastolic intervals and arrhythmia index in flies with heart-specific overexpression of rictor (Hand-gal4). N = 19 ~ 26. One-way ANOVA (*** p < 0.001, ** p < 0.01, * p < 0.05, ns = not significant). (E) Cardiac arrhythmia index in flies with heart-specific knockdown of rictor. N = 24. One-way ANOVA (*** p < 0.001, ** p < 0.01, * p < 0.05, ns = not significant). (F) Cardiac arrhythmia index in flies with heart-specific knockdown of daw alone or daw; rictor double knockdown. N = 15 ~ 30. Student t-test (*** p < 0.001, * p < 0.05, ns = not significant). (G-I) Diastolic intervals, arrhythmia index, and heart period in flies with heart-specific expression of baboAct, or baboAct; rictorOE (Hand-gal4). N = 11 ~ 27. One-way ANOVA (*** p < 0.001, ** p < 0.01, * p < 0.05, ns = not significant). (J) Proposed model: INHB/activin-mediated inhibition of MTORC2 as a novel mechanism for age-dependent regulation of autophagy and cardiac health.CC BY · PubMed Central
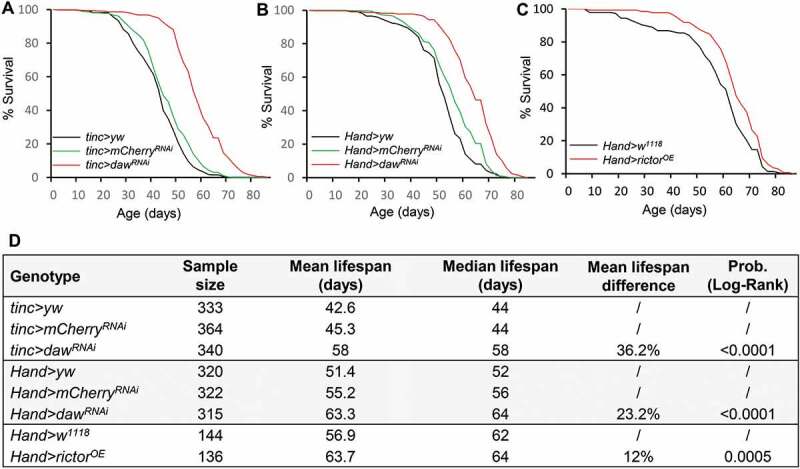
Figure 7. Cardiac-specific knockdown of daw and overexpression of rictor prolong lifespan. (A-B) Survival analysis of cardiac-specific (tinc-gal4 and Hand-gal4) knockdown of daw. Two control lines used (yw and mCherry RNAi) were performed. Log-Rank test, p < 0.0001. (C) Survival analysis of heart-specific (Hand-gal4) overexpression of rictor. Log-Rank test, p = 0.0005. (D) Lifespan table to show sample size, mean and median lifespan of the survival analysis.
Figure 7. Cardiac-specific knockdown of daw and overexpression of rictor prolong lifespan. (A-B) Survival analysis of cardiac-specific (tinc-gal4 and Hand-gal4) knockdown of daw. Two control lines used (yw and mCherry RNAi) were performed. Log-Rank test, p < 0.0001. (C) Survival analysis of heart-specific (Hand-gal4) overexpression of rictor. Log-Rank test, p = 0.0005. (D) Lifespan table to show sample size, mean and median lifespan of the survival analysis.CC BY · PubMed Central

Verification

Claims the paper makes

The claims and statistics of this paper haven’t been checked yet.

Run the check — free, no account needed. It reads the open-access text and checks the sources it cites.

A few free checks a day · papers already verified open instantly · results are public

Claims other papers make about this one

Each is checked against this paper’s own text: does it say what the citing paper says it does?

Self-check

Percentages, sums and reported differences re-computed from the paper’s own numbers.

The self-check needs the paper’s full text.

Citations

Cites

Show all 10 references

Research works printed but not linked: 77

  1. 10.1161/01.CIR.0000048893.62841.F7 · DOI
  2. 10.1016/j.cell.2011.07.030 · DOI · Paper page
  3. 10.1038/cr.2013.159 · DOI
  4. Chang JT, 2017, Elife, 6
  5. 10.4161/auto.22971 · DOI
  6. 10.1093/jb/mvt047 · DOI
  7. 10.1111/j.1474-9726.2009.00504.x · DOI
  8. 10.1016/j.cmet.2010.09.014 · DOI
  9. 10.1093/cvr/cvv252 · DOI
  10. 10.1016/j.celrep.2015.03.010 · DOI
  11. 10.1126/science.1115535 · DOI · Paper page
  12. 10.1111/acel.12256 · DOI · Paper page
  13. Upadhyay A, 2017, Cold Spring Harb Perspect Biol
  14. Biernacka A, 2011, Aging Dis, 2, 158
  15. 10.1038/s41467-018-04994-z · DOI
  16. 10.1371/journal.pgen.1003941 · DOI
  17. 10.1016/j.celrep.2014.05.001 · DOI
  18. 10.2144/000113078 · DOI
  19. 10.1016/j.ejphar.2016.07.053 · DOI
  20. 10.1016/j.devcel.2004.07.009 · DOI
  21. 10.1080/15548627.2016.1221565 · DOI
  22. 10.1371/journal.pone.0164239 · DOI
  23. 10.1080/15548627.2015.1063766 · DOI
  24. 10.1038/ncomms8007 · DOI · Paper page
  25. 10.1083/jcb.200711108 · DOI · Paper page
  26. 10.1126/science.1182228 · DOI · Paper page
  27. 10.1161/01.CIR.0000057979.36322.88 · DOI
  28. 10.1161/CIRCRESAHA.111.248260 · DOI
  29. 10.1016/j.cmet.2006.05.013 · DOI
  30. 10.1016/j.devcel.2015.03.013 · DOI
  31. 10.1073/pnas.1302455110 · DOI · Paper page
  32. 10.1126/science.1106148 · DOI · Paper page
  33. 10.1038/nature02549 · DOI
  34. 10.1016/j.cell.2010.10.007 · DOI · Paper page
  35. 10.1038/nrd3810 · DOI · Paper page
  36. 10.1186/1478-811X-7-15 · DOI
  37. 10.1016/j.cub.2007.08.058 · DOI
  38. 10.1016/S0531-5565(01)00117-6 · DOI
  39. 10.1161/01.CIR.0000120704.97934.41 · DOI
  40. 10.1016/j.ijcard.2013.04.012 · DOI
  41. Tsai YL, Am J Hypertens
  42. 10.1016/j.cyto.2014.06.017 · DOI
  43. 10.1097/HJH.0000000000001020 · DOI
  44. 10.1016/j.yjmcc.2017.02.002 · DOI
  45. 10.1152/ajpheart.01048.2009 · DOI
  46. 10.1161/CIRCULATIONAHA.109.872200 · DOI
  47. Liu M, Int J Mol Sci
  48. 10.1073/pnas.1319116111 · DOI
  49. 10.1016/j.celrep.2014.08.064 · DOI
  50. 10.1016/j.cytogfr.2006.01.001 · DOI · Paper page
  51. 10.4161/auto.5.1.7279 · DOI
  52. 10.1016/j.bbrc.2016.10.050 · DOI
  53. 10.1016/j.devcel.2010.05.005 · DOI
  54. 10.1038/ncb3407 · DOI
  55. 10.4161/cc.10.14.16586 · DOI
  56. 10.1016/j.tibs.2016.04.001 · DOI
  57. 10.1093/cvr/cvp384 · DOI
  58. 10.1038/ki.2013.559 · DOI
  59. 10.1016/j.cmet.2007.11.001 · DOI · Paper page
  60. 10.4161/15548627.2014.981789 · DOI
  61. 10.1101/gad.1775409 · DOI · Paper page
  62. 10.1242/jcs.168724 · DOI
  63. 10.1101/gad.203406.112 · DOI
  64. 10.1074/jbc.M110.179390 · DOI
  65. 10.1111/acel.12425 · DOI · Paper page
  66. 10.1152/ajpcell.00338.2010 · DOI
  67. 10.1016/j.devcel.2010.03.008 · DOI
  68. 10.1101/gad.13.1.98 · DOI
  69. 10.1242/dev.02711 · DOI
  70. 10.1101/gad.901101 · DOI
  71. 10.1016/j.bbrc.2007.04.086 · DOI
  72. 10.1242/dev.01899 · DOI
  73. 10.1016/S0925-4773(01)00361-6 · DOI
  74. 10.1681/ASN.2012080769 · DOI
  75. 10.1371/journal.pgen.1003081 · DOI
  76. 10.1371/journal.pone.0044214 · DOI
  77. 10.1016/j.mad.2009.05.004 · DOI

Cited by

Sorted by citations

See all 73

Metadata

Authors
Chang, K., Kang, P., Liu, Y., Huang, K., Miao, T., Sagona, A. P., Nezis, I. P., Bodmer, R., Ocorr, K., & Bai, H.
Affiliations
  • Department of Genetics, Development, and Cell Biology, Iowa State University, Ames, IA, USA
  • School of Life Sciences, University of Warwick, Coventry, UK
  • Development, Aging, and Regeneration Program, Sanford-Burnham-Prebys Medical Discovery Institute, La Jolla, CA, USA
Venue
Autophagy
Published
2019-12-29
Volume
16
Issue
10
Pages
1807-1822
ISSN
  • 1554-8627
  • 1554-8635
Cited by
73
References
10
Language
en
Funders
  • American Foundation for Aging Research (AFAR Research Grants for Junior Faculty)
  • Biotechnology and Biological Sciences Research Council (BB/P007856/1, BB/L006324/1)
  • National Institute on Aging (AG058741)
  • National Institutes of Health (R01 HL132241, R00 AG048016, R01 HL054732)

About these checks

Registry, retraction, Cites and statistics results are computed, not judged, with one exception: a printed reference that no index lists is read once by a model before it counts as a citation error. Claims are extracted by a model and kept only when their quote appears verbatim in the text; each cited source is then checked, with a model’s help, for whether it says what the claim relies on. Those verdicts can be wrong — read the claim’s quote and the cited source before relying on one.

Statistics and arithmetic are recomputed, not judged.

Confidence bands are shown only for fields calibrated on our annotated test set. None is calibrated yet, so no band is shown.

What counts as a claim ›How we measure confidence ›How we check this ›

Are you an author, or do you see a problem with this page? Request a review

How to cite

Cite CoChat for the checks on this page, and the paper for its own findings.

This page
CoChat. (2026). Citation check: TGFB-INHB/activin signaling regulates age-dependent autophagy and cardiac health through inhibition of MTORC2. https://app.cochat.ai/papers/10.1080/15548627.2019.1704117
The paper
Chang, K., Kang, P., Liu, Y., Huang, K., Miao, T., Sagona, A. P., Nezis, I. P., Bodmer, R., Ocorr, K., & Bai, H. (2020). TGFB-INHB/activin signaling regulates age-dependent autophagy and cardiac health through inhibition of MTORC2. Autophagy. https://doi.org/10.1080/15548627.2019.1704117