

The DOI matches its Crossref record; 47 of the 47 references it cites were found in a registry or an index.
Cbfa1-independent decrease in osteoblast proliferation, osteopenia, and persistent embryonic eye vascularization in mice deficient in Lrp5, a Wnt coreceptor
Open accessAbstract
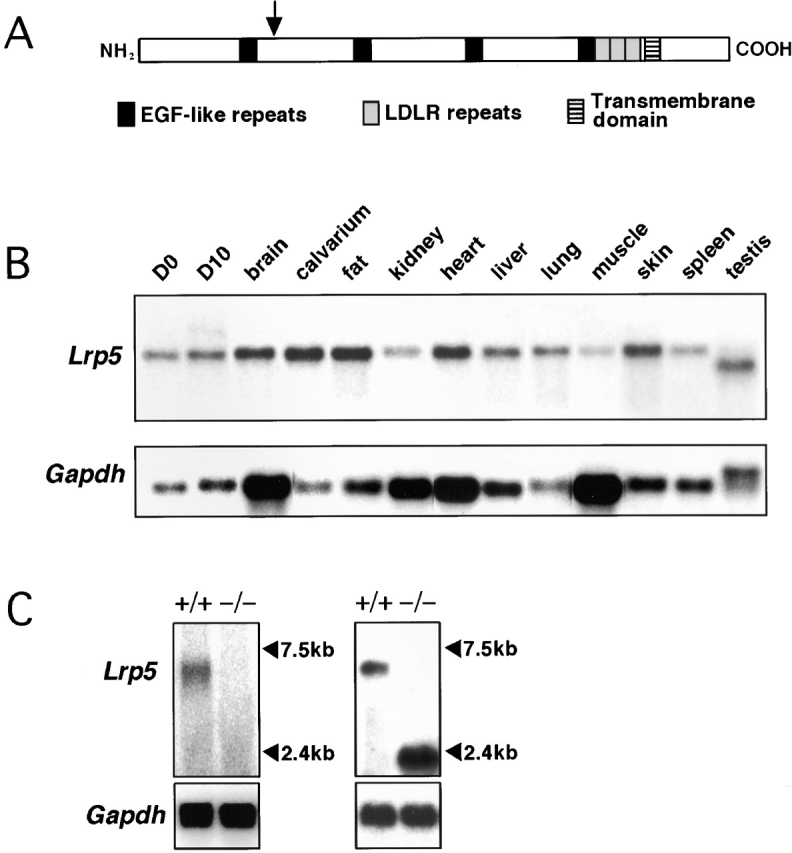
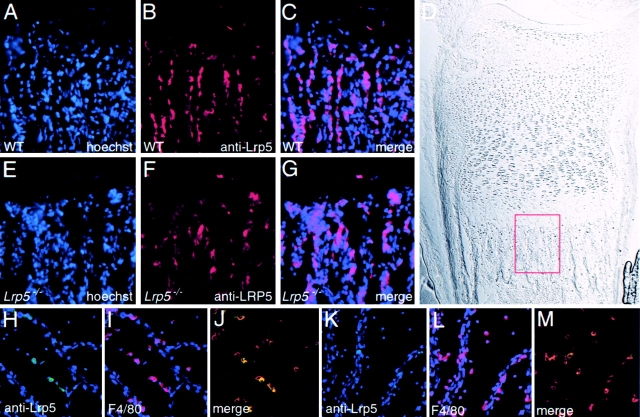
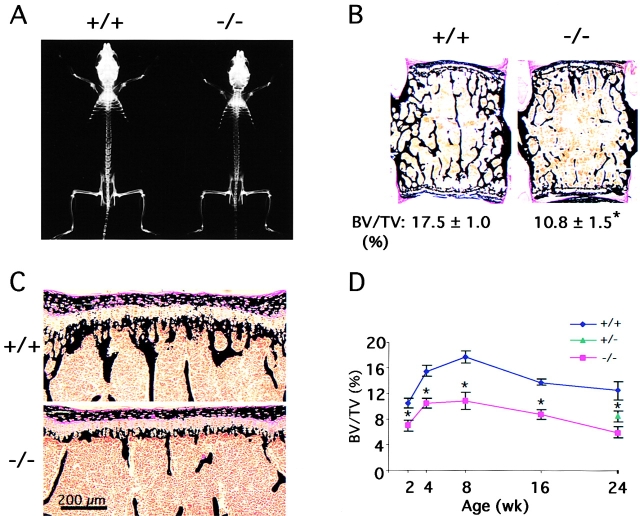
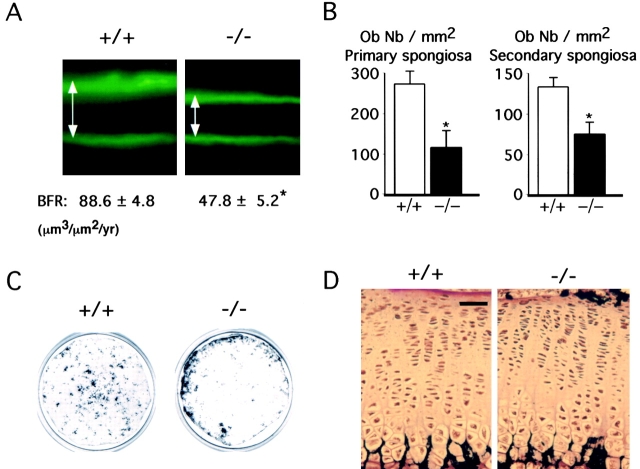
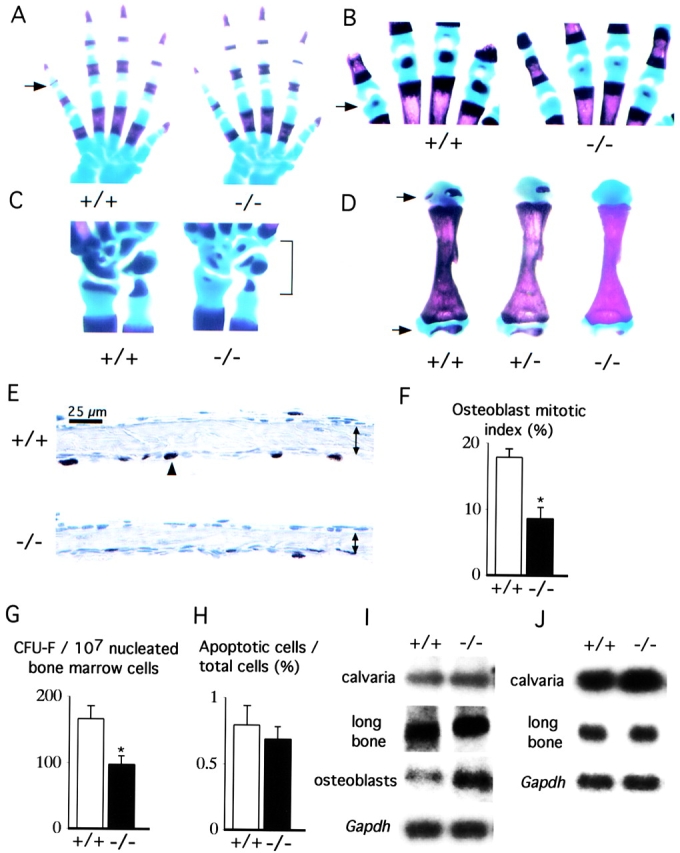
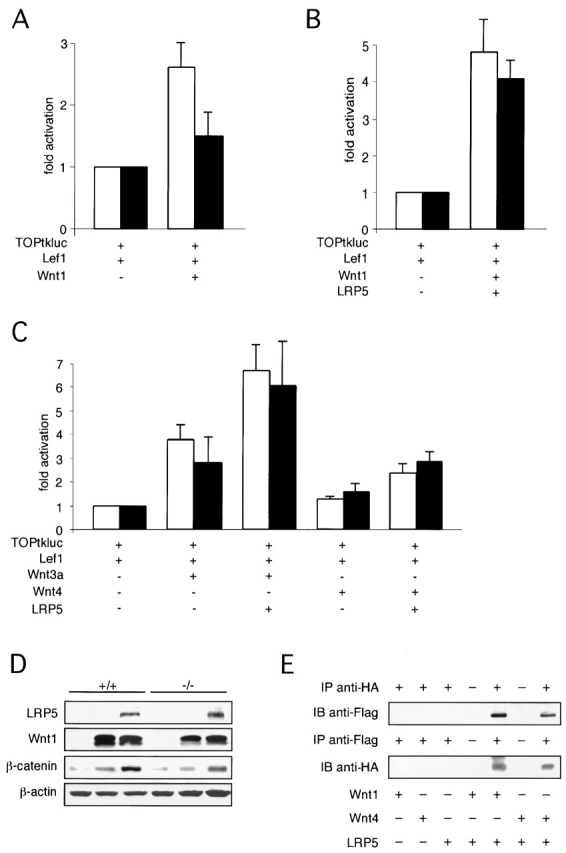
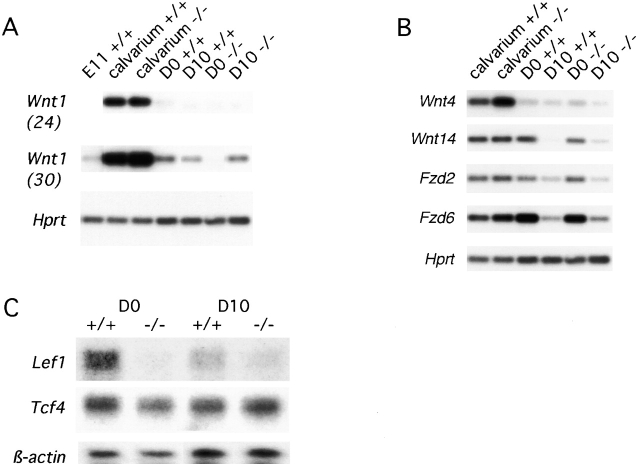
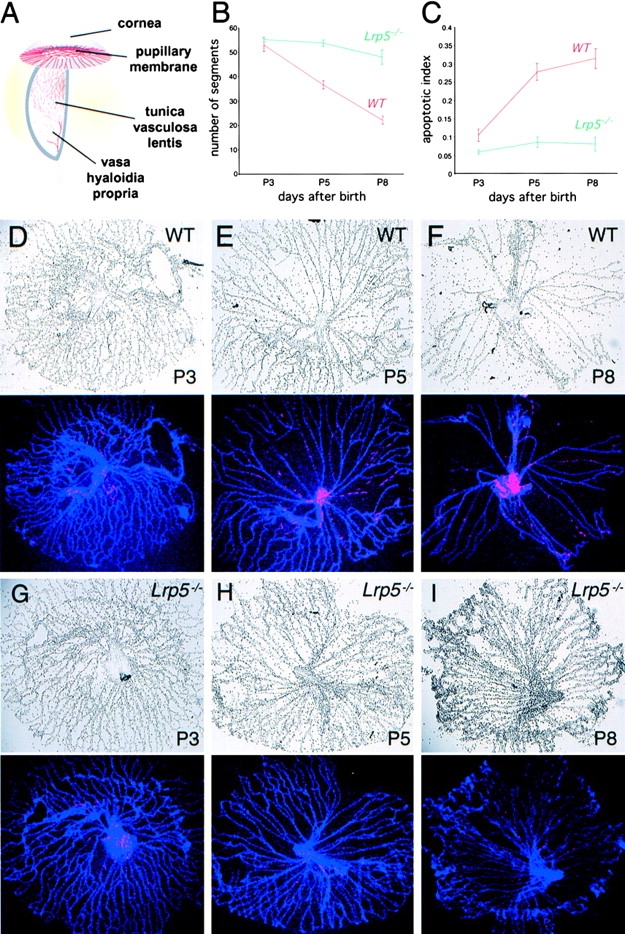
The low-density lipoprotein receptor–related protein (Lrp)-5 functions as a Wnt coreceptor. Here we show that mice with a targeted disruption of Lrp5 develop a low bone mass phenotype. In vivo and in vitro analyses indicate that this phenotype becomes evident postnatally, and demonstrate that it is secondary to decreased osteoblast proliferation and function in a Cbfa1-independent manner. Lrp5 is expressed in osteoblasts and is required for optimal Wnt signaling in osteoblasts. In addition, Lrp5-deficient mice display persistent embryonic eye vascularization due to a failure of macrophage-induced endothelial cell apoptosis. These results implicate Wnt proteins in the postnatal control of vascular regression and bone formation, two functions affected in many diseases. Moreover, these features recapitulate human osteoporosis-pseudoglioma syndrome, caused by LRP5 inactivation.
Overview
The claims and statistics of this paper haven’t been checked yet.
Run the check — free, no account needed. It reads the open-access text and checks the sources it cites.
Integrity signals
Registry
Cites
Statistics
Figures
Verification
Claims the paper makes
The claims and statistics of this paper haven’t been checked yet.
Run the check — free, no account needed. It reads the open-access text and checks the sources it cites.
Claims other papers make about this one
Each is checked against this paper’s own text: does it say what the citing paper says it does?
The cited source says what the claim attributes to it.
In the citing paper
“Given that loss-of-function mutations in the Wnt receptor LRP5 results in low bone mass in both humans (47) and mice (48), the down-regulation of sFRP4, taken together with changes in levels of several Wnt inhibitors, suggests that altered Wnt signaling may play a role in bone loss resulting from exposure to microgravity and that the protective effect of ACVR2B/Fc on microgravity-induced bone loss”
From Targeting myostatin/activin A protects against skeletal muscle and bone loss during spaceflight (2020) · cites this paper as [48]
The check wasn’t confident either way, so it gives no verdict — never disputed.
In the citing paper
“By using co-immunoprecipitation, several group reported that LRP6 can bind Wnt1, Wnt3a and Xenopus Wnt8 (Tamai et al., 2000;Mao et al., 2001;Kato et al., 2002;Itasaki et al., 2003;Liu et al., 2003).”
From Mesd binds to mature LDL-receptor-related protein-6 and antagonizes ligand binding (2005) · cites this paper as Kato et al., 2002
Experimental — accuracy not yet measured
Self-check
Percentages, sums and reported differences re-computed from the paper’s own numbers.
The self-check needs the paper’s full text.
Citations
Cites
Identification of programmed cell death in situ via specific labeling of nuclear DNA fragmentation.
Gavrieli, Y., Sherman, Y., & Ben-Sasson, S. A. (1992) · The Journal of cell biology · doi:10.1083/jcb.119.3.493 · Cited by 9,444
PARFITT, A. M., Drezner, M. K., Glorieux, F. H., Kanis, J. А., Malluche, H. H., Meunier, P. J., Ott, S. M., & Recker, R. R. (1987) · Journal of Bone and Mineral Research · doi:10.1002/jbmr.5650020617 · Cited by 5,344
Bone Histomorphometry : Standardization of Nomenclature, Symbols, and Units
PARFITT, A. M., Drezner, M. K., Glorieux, F. H., Kanis, J. А., Malluche, H. H., Meunier, P. J., Ott, S. M., & Recker, R. R. (1987) · Journal of Bone and Mineral Research · Cited by 3,258
Constitutive Transcriptional Activation by a β-Catenin-Tcf Complex in APC −/− Colon Carcinoma
Korinek, V., Barker, N., Morin, P. J., van Wichen, D., de Weger, R., Kinzler, K. W., Vogelstein, B., & Clevers, H. (1997) · Science · doi:10.1126/science.275.5307.1784 · Cited by 2,905
LDL Receptor-Related Protein 5 (LRP5) Affects Bone Accrual and Eye Development
Gong, Y., Slee, R. B., Fukai, N., Rawadi, G., Roman-Roman, S., Reginato, A. M., Wang, H., Cundy, T., Glorieux, F. H., Lev, D., et al. (2001) · Cell · doi:10.1016/s0092-8674(01)00571-2 · Cited by 2,235
MECHANISMS OF WNT SIGNALING IN DEVELOPMENT
Wodarz, A., & Nusse, R. (1998) · Annual Review of Cell and Developmental Biology · doi:10.1146/annurev.cellbio.14.1.59 · Cited by 2,030
The Wnt-1 (int-1) proto-oncogene is required for development of a large region of the mouse brain
McMahon, A. P., & Bradley, A. (1990) · Cell · doi:10.1016/0092-8674(90)90385-r · Cited by 1,540
A new member of the frizzled family from Drosophila functions as a Wingless receptor
Bhanot, P., van den Brink, M. R. M., Samos, C. H., Hsieh, J.-C., Wang, Y., Macke, J. P., Andrew, D. J., Nathans, J., & Nusse, R. (1996) · Nature · doi:10.1038/382225a0 · Cited by 1,504
Little, R. D., Folz, C., Manning, S. P., Swain, P. M., Zhao, S.-C., Eustace, B., Lappe, M. M., Spitzer, L., Zweier, S., Braunschweiger, K., et al. (2002) · The American Journal of Human Genetics · doi:10.1086/338450 · Cited by 1,282
Female development in mammals is regulated by Wnt-4 signalling
Vainio, S. J., Heikkilä, M. M., Kispert, A., Chin, N., & McMahon, A. P. (1999) · Nature · doi:10.1038/17068 · Cited by 1,263
Research works printed but not linked: 8
- 1996, Am. J. Hum. Genet., 59, 146
- 2001, Curr. Opin. Genet. Dev., 5, 543
- 1993, Osteoporos. Int., 1, S54
- 1987, J. Bone Miner. Res., 6, 595
- 1998, Nature., 95, 707
- 1998, Cell., 97, 707
- 1986, Clin. Genet., 2, 185
- 1999, J. Mol. Med., 77, 306, 10.1007/s001090050356 · DOI
Cited by
Sorted by citations
Items 301–400 of 999
Control of bone formation by the serpentine receptor Frizzled-9
Albers, J., Schulze, J., Beil, F. T., Gebauer, M., Baranowsky, A., Keller, J., Marshall, R. P., Wintges, K., Friedrich, F. W., Priemel, M., et al. (2011) · The Journal of Cell Biology · doi:10.1083/jcb.201008012 · Cited by 116
Obligatory participation of macrophages in an angiopoietin 2-mediated cell death switch
Rao, S., Lobov, I. B., Vallance, J. E., Tsujikawa, K., Shiojima, I., Akunuru, S., Walsh, K. X., Benjamin, L. E., & Lang, R. A. (2007) · Development · doi:10.1242/dev.012187 · Cited by 111
Self-citationFunctional Roles of the Interaction of APP and Lipoprotein Receptors
Pohlkamp, T., Wasser, C. R., & Herz, J. (2017) · Frontiers in Molecular Neuroscience · doi:10.3389/fnmol.2017.00054 · Cited by 92
Korvala, J., Jüppner, H., Mäkitie, O., Sochett, E. B., Schnabel, D., Mora, S., Bartels, C. F., Warman, M. L., Deraska, D. J., Cole, W. G., et al. (2012) · BMC Medical Genetics · doi:10.1186/1471-2350-13-26 · Cited by 112
Wnts and wing: Wnt signaling in vertebrate limb development and musculoskeletal morphogenesis
Yang, Y. (2003) · Birth Defects Research Part C Embryo Today Reviews · doi:10.1002/bdrc.10026 · Cited by 113
Canonical Wnt signalling activates TAZ through PP1A during osteogenic differentiation
Byun, M. R., Hwang, J.-H., Kim, A. R., Kim, K. M., Hwang, E. S., Yaffe, M. B., & Hong, J.-H. (2014) · Cell Death and Differentiation · doi:10.1038/cdd.2014.8 · Cited by 109
A model for familial exudative vitreoretinopathy caused by LPR5 mutations
Xia, C., Liu, H., Cheung, D., Wang, M., Cheng, C., Du, X., Chang, B., Beutler, B., & Gong, X. (2008) · Human Molecular Genetics · doi:10.1093/hmg/ddn047 · Cited by 108
Self-citationThe Genetics of Low-Density Lipoprotein Receptor-Related Protein 5 in Bone: A Story of Extremes
Balemans, W., & Hul, W. V. (2007) · Endocrinology · doi:10.1210/en.2006-1352 · Cited by 112
Genetics of osteoporosis: accelerating pace in gene identification and validation
Li, W., Hou, S.-X., Yu, B., Li, M., Férec, C., & Chen, J. (2009) · Human Genetics · doi:10.1007/s00439-009-0773-z · Cited by 108
Grassi, F., Tyagi, A. M., Calvert, J. W., Gambari, L., Walker, L. D., Yu, M., Robinson, J. W., Li, J., Lisignoli, G., Vaccaro, C., et al. (2015) · Journal of Bone and Mineral Research · doi:10.1002/jbmr.2757 · Cited by 108
Crosstalk Between MLO‐Y4 Osteocytes and C2C12 Muscle Cells Is Mediated by the Wnt/β‐Catenin Pathway
Huang, J. M., Romero‐Suarez, S., Lara, N., Mo, C., Kaja, S., Brotto, L. S., Dallas, S. L., Johnson, M. L., Jähn, K., Bonewald, L. F., et al. (2017) · JBMR Plus · doi:10.1002/jbm4.10015 · Cited by 107
Wang, Z., Liu, C., Huang, S., Fu, Z., Tomita, Y., Britton, W. R., Cho, S. S., Chen, C. T., Sun, Y., Ma, J., et al. (2020) · Science Advances · doi:10.1126/sciadv.aba7457 · Cited by 117
Abdallah, B. M., Jafari, A., Zaher, W. A., Qiu, W., & Kassem, M. S. (2014) · Bone · doi:10.1016/j.bone.2014.07.028 · Cited by 110
Small molecule screen for compounds that affect vascular development in the zebrafish retina
Kitambi, S. S., McCulloch, K. J., Peterson, R. T., & Malicki, J. J. (2009) · Mechanisms of Development · doi:10.1016/j.mod.2009.01.002 · Cited by 106
Targeted Disruption of the Wnt Regulator Kremen Induces Limb Defects and High Bone Density
Ellwanger, K., Saito, H., Clément-Lacroix, P., Maltry, N., Niedermeyer, J., Lee, W. K., Baron, R., Rawadi, G., Westphal, H., & Niehrs, C. (2008) · Molecular and Cellular Biology · doi:10.1128/mcb.00222-08 · Cited by 112
Wnt signaling in the stem cell niche
Rattis, F. M., Voermans, C., & Reya, T. (2004) · Current Opinion in Hematology · doi:10.1097/01.moh.0000133649.61121.ec · Cited by 108
Multi-lineage differentiation of mesenchymal stem cells – To Wnt, or not Wnt
Visweswaran, M., Pohl, S., Arfuso, F., Newsholme, P., Dilley, R. J., Pervaiz, S., & Dharmarajan, A. (2015) · The International Journal of Biochemistry & Cell Biology · doi:10.1016/j.biocel.2015.09.008 · Cited by 110
Mechanotransduction in Human Bone
Scott, A., Khan, K., Duronio, V., & Hart, D. A. (2008) · Sports Medicine · doi:10.2165/00007256-200838020-00004 · Cited by 104
Ling, L., Dombrowski, C., Foong, K. M., Haupt, L. M., Stein, G. S., Nurcombe, V., van Wijnen, A. J., & Cool, S. M. (2010) · Journal of Biological Chemistry · doi:10.1074/jbc.m110.122069 · Cited by 105
LRP5 mutations in osteoporosis-pseudoglioma syndrome and high-bone-mass disorders
Levasseur, R., Lacombe, D., & de Vernejoul, M. C. (2004) · Joint Bone Spine · doi:10.1016/j.jbspin.2004.10.008 · Cited by 102
Self-citationThe cell biology of parathyroid hormone in osteoblasts
Kousteni, S., & Bilezikian, J. P. (2008) · Current Osteoporosis Reports · doi:10.1007/s11914-008-0013-9 · Cited by 105
Shen, B., Vardy, K., Hughes, P., Tasdogan, A., Zhao, Z., Yue, R., Crane, G. M., & Morrison, S. J. (2019) · eLife · doi:10.7554/elife.42274 · Cited by 98
PTH Stimulates Bone Formation in Mice Deficient in Lrp5
Iwaniec, U. T., Wronski, T. J., Liu, J., Rivera, M. F., Arzaga, R. R., Hansen, G. M., & Brommage, R. (2006) · Journal of Bone and Mineral Research · doi:10.1359/jbmr.061118 · Cited by 102
Wnt signaling control of bone cell apoptosis
Bodine, P. V. N. (2008) · Cell Research · doi:10.1038/cr.2008.13 · Cited by 106
Brommage, R., Liu, J., Hansen, G. M., Kirkpatrick, L., Potter, D., Sands, A., Zambrowicz, B., Powell, D. R., & Vogel, P. (2014) · Bone Research · doi:10.1038/boneres.2014.34 · Cited by 102
Bedi, B., Li, J., Tawfeek, H. A. W., Baek, K., Adams, J., Vangara, S. S., Chang, M.-K., Kneissel, M., Weitzmann, M. N., & Pacifici, R. (2012) · Proceedings of the National Academy of Sciences · doi:10.1073/pnas.1120735109 · Cited by 104
Signaling pathways governing osteoblast proliferation, differentiation and function.
Chau, J. F. L., Leong, W. F., & Li, B. (2009) · PubMed · doi:10.14670/hh-24.1593 · Cited by 103
The Alliance of Mesenchymal Stem Cells, Bone, and Diabetes
Napoli, N., Strollo, R., Paladini, A., Briganti, S., Pozzilli, P., & Epstein, S. (2014) · International Journal of Endocrinology · doi:10.1155/2014/690783 · Cited by 105
Suzuki, A., Ozono, K., Kubota, T., Kondou, H., Tachikawa, K., & Michigami, T. (2007) · Journal of Cellular Biochemistry · doi:10.1002/jcb.21626 · Cited by 101
Microarray analysis reveals expression regulation of Wnt antagonists in differentiating osteoblasts
Vaes, B., Dechering, K. J., VANSOMEREN, E., HENDRIKS, J., VANDEVEN, C., Feijen, A., Mummery, C. L., Reinders, M. J. T., Olijve, W., & VANZOELEN, E. (2005) · Bone · doi:10.1016/j.bone.2005.02.001 · Cited by 100
Radiographic vertebral morphology: A diagnostic tool in pediatric osteoporosis
Mäkitie, O., Doria, A. S., Henriques, F., Cole, W. G., Compeyrot‐Lacassagne, S., Silverman, E. D., Laxer, R. M., Daneman, A., & Sochett, E. B. (2005) · The Journal of Pediatrics · doi:10.1016/j.jpeds.2004.10.052 · Cited by 97
Cross-talk between Insulin and Wnt Signaling in Preadipocytes
Palsgaard, J., Emanuelli, B., Winnay, J. N., Sumara, G., Karsenty, G., & Kahn, C. R. (2012) · Journal of Biological Chemistry · doi:10.1074/jbc.m111.337048 · Cited by 98
Self-citationOkazaki, K., Yamaguchi, T., Tanaka, K.-I., Notsu, M., Ogawa, N., Yano, S., & Sugimoto, T. (2012) · Calcified Tissue International · doi:10.1007/s00223-012-9641-2 · Cited by 98
The role of WNT10B in physiology and disease
Wend, P., Wend, K., Krum, S. A., & Miranda‐Carboni, G. A. (2011) · Acta Physiologica · doi:10.1111/j.1748-1716.2011.02296.x · Cited by 97
Caverzasio, J., & Manen, D. (2007) · Endocrinology · doi:10.1210/en.2007-0520 · Cited by 98
Mrak, E., Guidobono, F., Moro, G., Fraschini, G., Rubinacci, A., & Villa, I. (2010) · Journal of Cellular Physiology · doi:10.1002/jcp.22266 · Cited by 97
Signal transduction and transcriptional regulation during mesenchymal cell differentiation
Nishimura, R., Hata, K., Ikeda, F., Ichida, F., Shimoyama, A., Matsubara, T., Wada, M., Amano, K., & Yoneda, T. (2008) · Journal of Bone and Mineral Metabolism · doi:10.1007/s00774-007-0824-2 · Cited by 97
Balemans, W., Devogelaer, J., Cleiren, E., Piters, E., Caussin, E., & Hul, W. V. (2007) · Journal of Bone and Mineral Research · doi:10.1359/jbmr.070211 · Cited by 97
Zhou, H., Shang, L., Li, X., Zhang, X., Gao, G., Guo, C., Chen, B., Liu, Q., Gong, Y., & Shao, C. (2009) · Experimental Cell Research · doi:10.1016/j.yexcr.2009.07.030 · Cited by 100
RetractedSecreted Frizzled-Related Protein 4 Is a Negative Regulator of Peak BMD in SAMP6 Mice
Nakanishi, R., Shimizu, M., Mori, M., Akiyama, H., Okudaira, S., Otsuki, B., Hashimoto, M., Higuchi, K., Hosokawa, M., Tsuboyama, T., et al. (2006) · Journal of Bone and Mineral Research · doi:10.1359/jbmr.060719 · Cited by 98
Wnt Pathway in Osteosarcoma, from Oncogenic to Therapeutic
Cai, Y., Cai, T., & Chen, Y. (2013) · Journal of Cellular Biochemistry · doi:10.1002/jcb.24708 · Cited by 96
Giuliani, N., Lisignoli, G., Magnani, M., Racano, C., Bolzoni, M., Palma, B. D., Spolzino, A., Manferdini, C., Abati, C. N., Toscani, D., et al. (2013) · Stem Cells International · doi:10.1155/2013/312501 · Cited by 101
Schwaninger, R., Rentsch, C. A., Wetterwald, A., van der Horst, G., van Bezooijen, R. L., van der Pluijm, G., Löwik, C. W. G. M., Ackermann, K., Pyerin, W. G., Hamdy, F. C., et al. (2007) · American Journal Of Pathology · doi:10.2353/ajpath.2007.051276 · Cited by 104
Warden, S. J., Robling, A. G., Haney, E. M., Turner, C. H., & Bliziotes, M. M. (2009) · Bone · doi:10.1016/j.bone.2009.06.029 · Cited by 97
Contribution of the LRP5 Gene to Normal Variation in Peak BMD in Women
Koller, D. L., Ichikawa, S., Johnson, M. L., Lai, D., Xuei, X., Edenberg, H. J., Conneally, P. M., Hui, S. L., Johnston, C. C., Peacock, M., et al. (2005) · Journal of Bone and Mineral Research · doi:10.1359/jbmr.041019 · Cited by 92
T cells: Critical bone regulators in health and disease
Pacifici, R. (2010) · Bone · doi:10.1016/j.bone.2010.04.611 · Cited by 98
Helfrich, M. (2003) · Microscopy Research and Technique · doi:10.1002/jemt.10375 · Cited by 94
Hypoxia Signaling in the Skeleton: Implications for Bone Health
Yellowley, C. E., & Genetos, D. C. (2019) · Current Osteoporosis Reports · doi:10.1007/s11914-019-00500-6 · Cited by 94
Zaman, G., Saxon, L., Sunters, A., Hilton, H., Underhill, P., Williams, D., Price, J. S., & Lanyon, L. E. (2009) · Bone · doi:10.1016/j.bone.2009.10.021 · Cited by 95
Schmidt, K., Schinke, T., Haberland, M., Priemel, M., Schilling, A. F., Müldner, C., Rueger, J. M., Sock, E., Wegner, M., & Amling, M. (2005) · The Journal of Cell Biology · doi:10.1083/jcb.200408013 · Cited by 93
Wnt signalling pathway: a new target for the treatment of osteoporosis
Rawadi, G., & Roman‐Roman, S. (2005) · Expert Opinion on Therapeutic Targets · doi:10.1517/14728222.9.5.1063 · Cited by 94
Qin, X., Jiang, Q., Miyazaki, T., & Komori, T. (2018) · Human Molecular Genetics · doi:10.1093/hmg/ddy386 · Cited by 92
Hruska, K. A., Saab, G., Mathew, S., & Lund, R. (2007) · Seminars in Dialysis · doi:10.1111/j.1525-139x.2007.00300.x · Cited by 91
Regulation of Bone Formation and Vision byLRP5
Patel, M. S., & Karsenty, G. (2002) · New England Journal of Medicine · doi:10.1056/nejm200205163462011 · Cited by 92
Self-citationMutations in DVL1 Cause an Osteosclerotic Form of Robinow Syndrome
Bunn, K. J., Daniel, P., Rösken, H. S., O’Neill, A. C., Cameron‐Christie, S., Morgan, T., Brunner, H. G., Lai, A., Kunst, H. P. M., Markie, D., et al. (2015) · The American Journal of Human Genetics · doi:10.1016/j.ajhg.2015.02.010 · Cited by 90
Saarinen, A., Saukkonen, T. T., Kivelä, T., Lahtinen, U., Laine, C. M., Somer, M., Toiviainen‐Salo, S., Cole, W. G., Lehesjoki, A., & Mäkitie, O. (2009) · Clinical Endocrinology · doi:10.1111/j.1365-2265.2009.03680.x · Cited by 88
Nakamura, Y., Weidinger, G., Liang, J. O., Aquilina‐Beck, A., Tamai, K., Moon, R. T., & Warman, M. L. (2007) · Journal of Clinical Investigation · doi:10.1172/jci32001 · Cited by 91
In vascular smooth muscle cells paricalcitol prevents phosphate-induced Wnt/β-catenin activation
Martinez-Moreno, J. M., Muñoz-Castañeda, J. R., Herencia, C., de Oca, A. M., Estepa, J. C., Canalejo, R., Rodríguez-Ortiz, M. E., Pérez‐Martínez, P., Aguilera‐Tejero, E., Canalejo, A., et al. (2012) · American Journal of Physiology-Renal Physiology · doi:10.1152/ajprenal.00684.2011 · Cited by 91
Anti-DKK1 antibody promotes bone fracture healing through activation of β-catenin signaling
Jin, H., Wang, B., Li, J., Xie, W., Mao, Q., Li, S., Dong, F., Sun, Y., Ke, H.-Z., Babij, P., et al. (2014) · Bone · doi:10.1016/j.bone.2014.07.039 · Cited by 91
Ahn, J. D., Dubern, B., Lubrano-Berthelier, C., Clément, K., & Karsenty, G. (2006) · Endocrinology · doi:10.1210/en.2006-0281 · Cited by 90
Self-citationRalston, S. H. (2010) · Annals of the New York Academy of Sciences · doi:10.1111/j.1749-6632.2009.05317.x · Cited by 92
Mak, W., Shao, X., Dunstan, C. R., Seibel, M. J., & Zhou, H. (2009) · Calcified Tissue International · doi:10.1007/s00223-009-9303-1 · Cited by 89
Oleoyl serine, an endogenous N -acyl amide, modulates bone remodeling and mass
Smoum, R., Bar, A., Tan, B., Milman, G., Attar-Namdar, M., Ofek, O., Stuart, J. M., Bajayo, A., Tam, J., Kram, V., et al. (2010) · Proceedings of the National Academy of Sciences · doi:10.1073/pnas.0912479107 · Cited by 91
Ikeda, R., Yoshida, K., Tsukahara, S., Sakamoto, Y., Tanaka, H., Furukawa, K., & Inoue, I. (2004) · Journal of Biological Chemistry · doi:10.1074/jbc.m409442200 · Cited by 88
Fretz, J. A., Zella, L. A., Kim, S., Shevde, N. K., & Pike, J. W. (2006) · Molecular Endocrinology · doi:10.1210/me.2006-0102 · Cited by 89
Zhang, M., Yan, Y., Lim, Y., Tang, D., Xie, R., Chen, A., Tai, P., Harris, S. E., Xing, L., Qin, Y., et al. (2009) · Journal of Cellular Biochemistry · doi:10.1002/jcb.22319 · Cited by 86
Mechanical stress induces Interleukin-11 expression to stimulate osteoblast differentiation
Kido, S., Kuriwaka-Kido, R., Imamura, T., Ito, Y., Inoue, D., & Matsumoto, T. (2009) · Bone · doi:10.1016/j.bone.2009.07.087 · Cited by 88
The swaying mouse as a model of osteogenesis imperfecta caused by WNT1 mutations
Joeng, K. S., Lee, Y., Jiang, M., Bertin, T., Chen, Y., Abraham, A. M., Ding, H., Bi, X., Ambrose, C. G., & Lee, B. (2014) · Human Molecular Genetics · doi:10.1093/hmg/ddu117 · Cited by 84
WNT/Frizzled signaling in eye development and disease
de Iongh Robb, U. (2006) · Frontiers in bioscience · doi:10.2741/1982 · Cited by 88
Roles of Non-Canonical Wnt Signalling Pathways in Bone Biology
Lojk, J., & Marc, J. (2021) · International Journal of Molecular Sciences · doi:10.3390/ijms221910840 · Cited by 88
Molecular and Biological Mechanisms of Bone Metastasis
Cecchini, M. G., Wetterwald, A., van der Pluijm, G., & Thalmann, G. N. (2005) · EAU Update Series · doi:10.1016/j.euus.2005.09.006 · Cited by 89
The Wnt signaling pathway: implications for therapy in osteosarcoma
McQueen, P., Ghaffar, S., Guo, Y., Rubin, E. M., Zi, X., & Hoang, B. H. (2011) · Expert Review of Anticancer Therapy · doi:10.1586/era.11.94 · Cited by 85
Transglutaminases in mineralized tissues
Nurminskaya, M. (2006) · Frontiers in bioscience · doi:10.2741/1907 · Cited by 85
CB2 cannabinoid receptor targets mitogenic Gi protein–cyclin D1 axis in osteoblasts
Ofek, O., Attar-Namdar, M., Kram, V., Dvir‐Ginzberg, M., Mechoulam, R., Zimmer, A., Frenkel, B., Shohami, E., & Bab, I. (2010) · Journal of Bone and Mineral Research · doi:10.1002/jbmr.228 · Cited by 85
LRP5 gene polymorphisms and idiopathic osteoporosis in men
Ferrari, S., Deutsch, S., Baudoin, C., Cohen-Solal, M. E., Ostertag, A., Antonarakis, S. E., Rizzoli, R., & de Vernejoul, M. C. (2005) · Bone · doi:10.1016/j.bone.2005.06.017 · Cited by 84
Saxon, L., Jackson, B. F., Sugiyama, T., Lanyon, L. E., & Price, J. S. (2011) · Bone · doi:10.1016/j.bone.2011.03.683 · Cited by 86
Urano, T., Shiraki, M., Ezura, Y., Fujita, M., Sekine, E., Hoshino, S., Hosoi, T., Orimo, H., Emi, M., Ouchi, Y., et al. (2004) · Journal of Bone and Mineral Metabolism · doi:10.1007/s00774-003-0492-9 · Cited by 82
Wnt1 is an Lrp5-independent bone-anabolic Wnt ligand
Luther, J., Yorgan, T. A., Rolvien, T., Ulsamer, L. P. L., Koehne, T., Liao, N., Keller, D. B., Vollersen, N., Teufel, S., Neven, M., et al. (2018) · Science Translational Medicine · doi:10.1126/scitranslmed.aau7137 · Cited by 83
The Wnt pathway: An important control mechanism in bone's response to mechanical loading
Choi, R. B., & Robling, A. G. (2021) · Bone · doi:10.1016/j.bone.2021.116087 · Cited by 86
Lipoproteins and their receptors in embryonic development: more than cholesterol clearance
Willnow, T. E., Hammes, A., & Eaton, S. (2007) · Development · doi:10.1242/dev.004408 · Cited by 89
Qiu, W., Hu, Y., Andersen, T. E., Jafari, A., Li, N., Chen, W., & Kassem, M. S. (2010) · Journal of Biological Chemistry · doi:10.1074/jbc.m109.052001 · Cited by 82
Pacifici, R. (2015) · Annals of the New York Academy of Sciences · doi:10.1111/nyas.12969 · Cited by 86
Kousteni, S., Almeida, M., Han, L., Bellido, T., Jilka, R., & Manolagas, S. (2006) · Molecular and Cellular Biology · doi:10.1128/mcb.01550-06 · Cited by 86
Norrin: Molecular and functional properties of an angiogenic and neuroprotective growth factor
Ohlmann, A., & Tamm, E. R. (2012) · Progress in Retinal and Eye Research · doi:10.1016/j.preteyeres.2012.02.002 · Cited by 84
Wnt/Frizzled Signaling in the Vasculature: New Angiogenic Factors in Sight
Masckauchán, T. N. H., & Kitajewski, J. (2006) · Physiology · doi:10.1152/physiol.00058.2005 · Cited by 82
Atherosclerotic Calcification: Wnt Is the Hint
Albanese, I., Khan, K., Barratt, B., Kindi, H. N. A., & Schwertani, A. G. (2018) · Journal of the American Heart Association · doi:10.1161/jaha.117.007356 · Cited by 88
Wnt signaling acts and is regulated in a human osteoblast differentiation dependent manner
Eijken, M., Meijer, I. M. J., Westbroek, I., Koedam, M., Chiba, H., Uitterlinden, A. G., Pols, H. A. P., & van Leeuwen, J. P. T. M. (2008) · Journal of Cellular Biochemistry · doi:10.1002/jcb.21651 · Cited by 80
FOXO1 orchestrates the bone-suppressing function of gut-derived serotonin
Kode, A., Mosialou, I., Silva, B. C. C., Rached, M.-T., Zhou, B., Wang, J., Townes, T. M., Hen, R., DePinho, R. A., Guo, X.-D. E., et al. (2012) · Journal of Clinical Investigation · doi:10.1172/jci64906 · Cited by 82
Chen, J., Stahl, A., Krah, N. M., Seaward, M. R., Joyal, J., Juan, A. M., Hatton, C. J., Aderman, C. M., Dennison, R. J., Willett, K. L., et al. (2012) · PLoS ONE · doi:10.1371/journal.pone.0030203 · Cited by 78
Effects of magnesium alloy corrosion on biological response – Perspectives of metal-cell interaction
Kim, J., & Pan, H. (2022) · Progress in Materials Science · doi:10.1016/j.pmatsci.2022.101039 · Cited by 84
Distinct osteogenic mechanisms of bones of distinct origins
Chung, U., Kawaguchi, H., Takato, T., & Nakamura, K. (2004) · Journal of Orthopaedic Science · doi:10.1007/s00776-004-0786-3 · Cited by 79
Ahn, Y., Sims, C., Logue, J. M., Weatherbee, S. D., & Krumlauf, R. K. (2013) · Development · doi:10.1242/dev.085118 · Cited by 79
Silvério, K. G., Davidson, K. C., James, R. G., Adams, A. M., Foster, B. L., Nociti, F. H., Somerman, M. J., & Moon, R. T. (2011) · Journal of Periodontal Research · doi:10.1111/j.1600-0765.2011.01433.x · Cited by 82
Second hit in cervical carcinogenesis process: involvement of wnt/beta catenin pathway
Pérez‐Plasencia, C., Dueñas‐González, A., & Alatorre, B. (2008) · International Archives of Medicine · doi:10.1186/1755-7682-1-10 · Cited by 78
Sclerostin Inhibition Reverses Skeletal Fragility in an Lrp5-Deficient Mouse Model of OPPG Syndrome
Kedlaya, R., Veera, S. S., Horan, D. J., Moss, R. E., Ayturk, U. M., Jacobsen, C. M., Bowen, M. E., Pászty, C., Warman, M. L., & Robling, A. G. (2013) · Science Translational Medicine · doi:10.1126/scitranslmed.3006627 · Cited by 77
Regulation of Bone Metabolism by Serotonin
Lavoie, B. A., Lian, J. B., & Mawe, G. M. (2017) · Advances in experimental medicine and biology · doi:10.1007/978-3-319-66653-2_3 · Cited by 78
Gut-microbiota derived bioactive metabolites and their functions in host physiology
Debnath, N., Kumar, R., Kumar, A., Mehta, P. K., & Yadav, A. K. (2021) · Biotechnology and Genetic Engineering Reviews · doi:10.1080/02648725.2021.1989847 · Cited by 77
Chang, M.-K., Krämer, I., Keller, H., Gooi, J. H., Collett, C., Jenkins, D., Ettenberg, S. A., Cong, F., Halleux, C. M., & Kneissel, M. (2013) · Journal of Bone and Mineral Research · doi:10.1002/jbmr.2059 · Cited by 75
Kubota, T., Michigami, T., Sakaguchi, N., Kokubu, C., Suzuki, A., Namba, N., Sakai, N., Nakajima, S., Imai, K., & Ozono, K. (2008) · Journal of Bone and Mineral Research · doi:10.1359/jbmr.080512 · Cited by 78
Liu, Y., Bhat, R. A., Seestaller‐Wehr, L., Fukayama, S., Mangine, A., Moran, R. A., Komm, B. S., Bodine, P. V. N., & Billiard, J. (2006) · Molecular Endocrinology · doi:10.1210/me.2006-0342 · Cited by 77
Metadata
- Authors
- Kato, M., Patel, M. S., Levasseur, R., Lobov, I., Chang, B. H.-J., Glass, D. A., Hartmann, C., Li, L., Hwang, T.-H., Brayton, C. F., Lang, R. A., Karsenty, G., & Chan, L.
- Affiliations
- Baylor College of Medicine (US)
- 2Department of Molecular and Human Genetics, Baylor College of Medicine, Houston, TX 77030
- University of Cincinnati (US)
- Harvard University (US)
- ORCID
- Venue
- The Journal of Cell Biology
- Publisher
- Rockefeller University Press
- Published
- 2002-04-15
- Volume
- 157
- Issue
- 2
- Pages
- 303-314
- ISSN
- 0021-9525 (ISSN-L)
- 1540-8140
- PMC
- PMC2199263
- OpenAlex
- W2116610925
- Cited by
- 1,086
- References
- 46
- Citations by year
- 2026: 8 · 2025: 10 · 2024: 18 · 2023: 13 · 2022: 21 · 2021: 24 · 2020: 33 · 2019: 27 · 2018: 26 · 2017: 40 · 2016: 27 · 2015: 39 · 2014: 56 · 2013: 65 · 2012: 61
- FWCI
- 22.08
- Type
- journal article
- Language
- en
- Open access
- bronze
- doi.org
- Locations
- The Journal of Cell Biology (publishedVersion)
- PubMed Central (publishedVersion, cc-by-nc-sa)
- PubMed (publishedVersion)
- Funders
- March of Dimes Foundation
- Universiteit Utrecht
- National Institutes of Health (5r01dk058882-03, AR42919)
- Canadian Institutes of Health Research
- National Heart, Lung, and Blood Institute (HL16512, R01HL016512, HL-51586, R01HL051586)
- National Institute of Diabetes and Digestive and Kidney Diseases (DK 58882)
- National Institute of Arthritis and Musculoskeletal and Skin Diseases (P01AR042919, AR42919)
- National Institute of Dental and Craniofacial Research (DE11290, R01DE011290)
- Topics
- Life Sciences › Biochemistry, Genetics and Molecular Biology › Molecular Biology › Bone Metabolism and Diseases
- Life Sciences › Biochemistry, Genetics and Molecular Biology › Molecular Biology › Wnt/β-catenin signaling in development and cancer
- Health Sciences › Medicine › Orthopedics and Sports Medicine › Bone health and osteoporosis research
- Keywords
- LRP5, Wnt signaling, osteoblast proliferation, osteopenia, vascular regression, endothelial cell apoptosis, macrophages, osteoporosis-pseudoglioma syndrome, bone formation, postnatal development
- MeSH terms
- Animals, Bone and Bones, Bone Development, Bone Diseases, Metabolic, Calcium, Cell Division, Eye, Eye Abnormalities, Immunohistochemistry, Macrophages, Neoplasm Proteins, Organ Size, Osteoblasts, Phenotype, Proto-Oncogene Proteins, Receptors, LDL, Transcription Factors, Signal Transduction, Mutagenesis, Site-Directed, Apoptosis, Mice, Knockout, Gene Expression Regulation, Developmental, In Situ Nick-End Labeling, LDL-Receptor Related Proteins, Zebrafish Proteins, Core Binding Factor Alpha 1 Subunit, Wnt Proteins, Mice, Low Density Lipoprotein Receptor-Related Protein-5
About these checks
Registry, retraction, Cites and statistics results are computed, not judged, with one exception: a printed reference that no index lists is read once by a model before it counts as a citation error. Claims are extracted by a model and kept only when their quote appears verbatim in the text; each cited source is then checked, with a model’s help, for whether it says what the claim relies on. Those verdicts can be wrong — read the claim’s quote and the cited source before relying on one.
Statistics and arithmetic are recomputed, not judged.
Confidence bands are shown only for fields calibrated on our annotated test set. None is calibrated yet, so no band is shown.
What counts as a claim ›How we measure confidence ›How we check this ›
Are you an author, or do you see a problem with this page? Request a review
