

The DOI matches its Crossref record; 51 of the 52 references it cites were found in a registry or an index.
The mammalian Scribble polarity protein regulates epithelial cell adhesion and migration through E-cadherin
Open accessAbstract
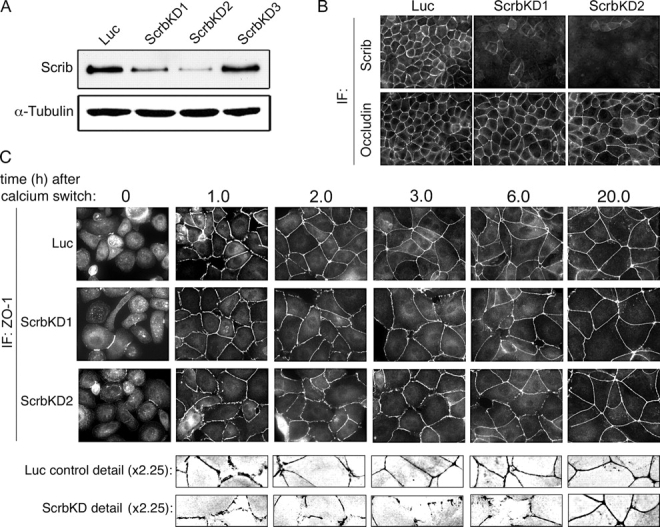
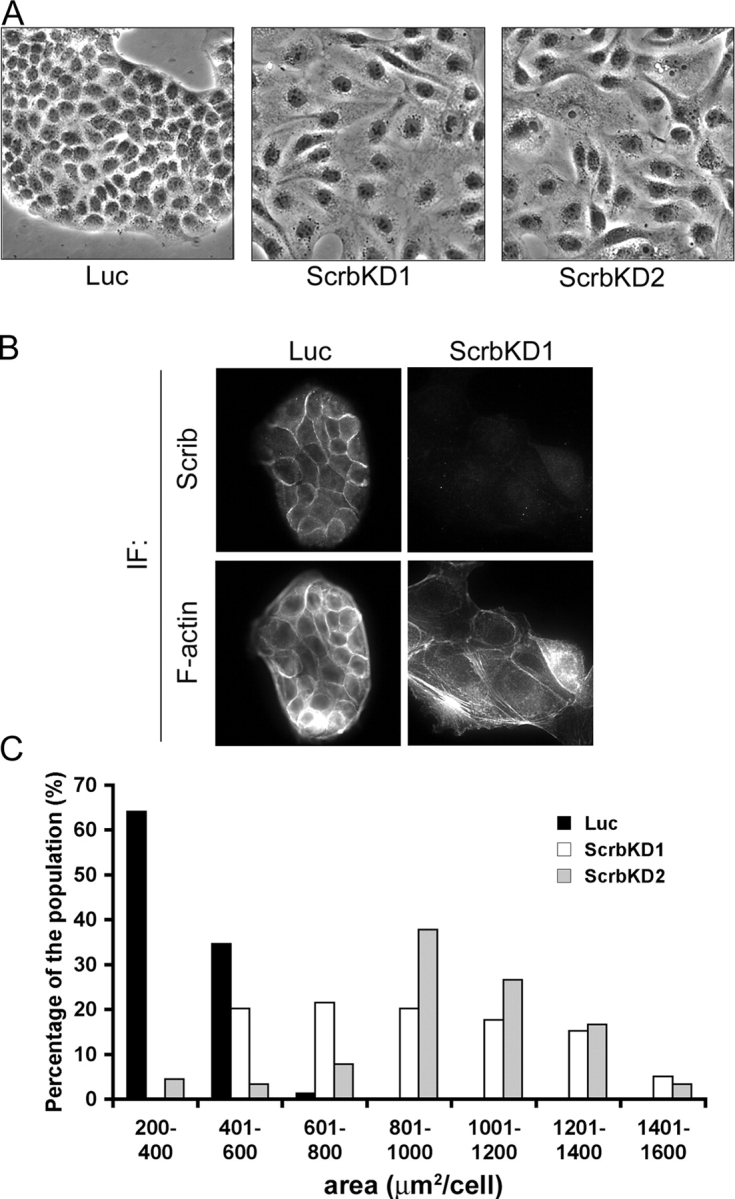
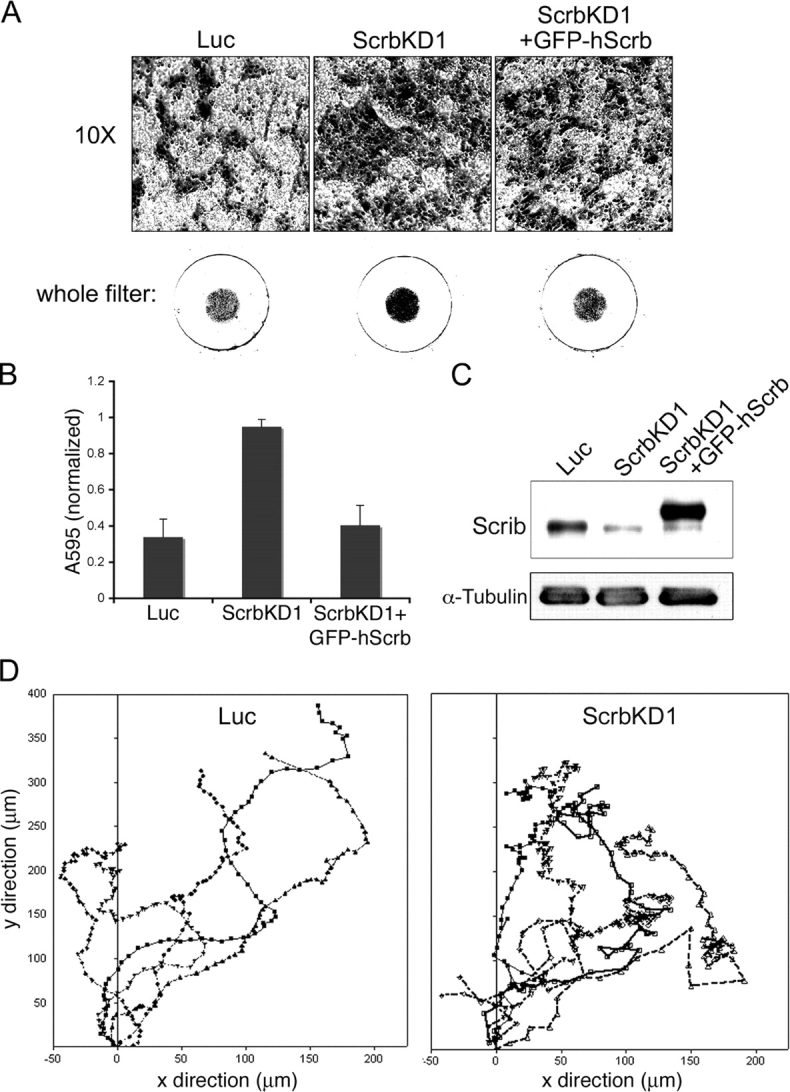
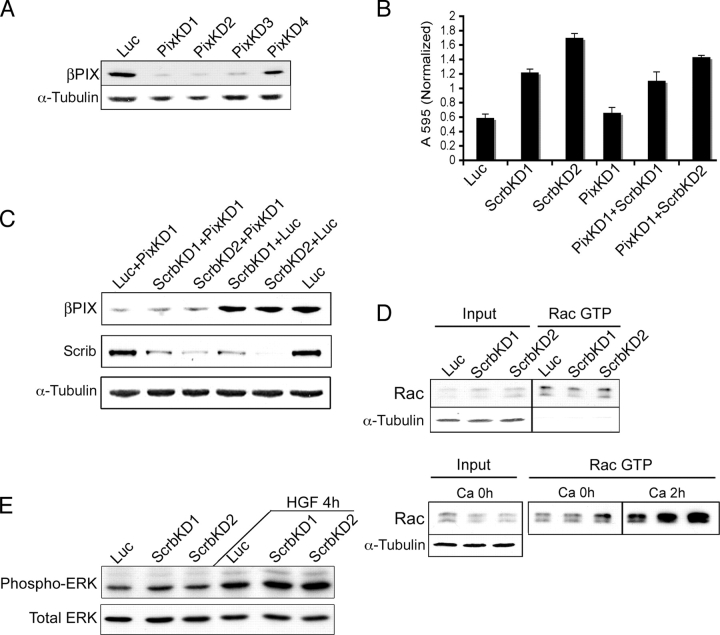
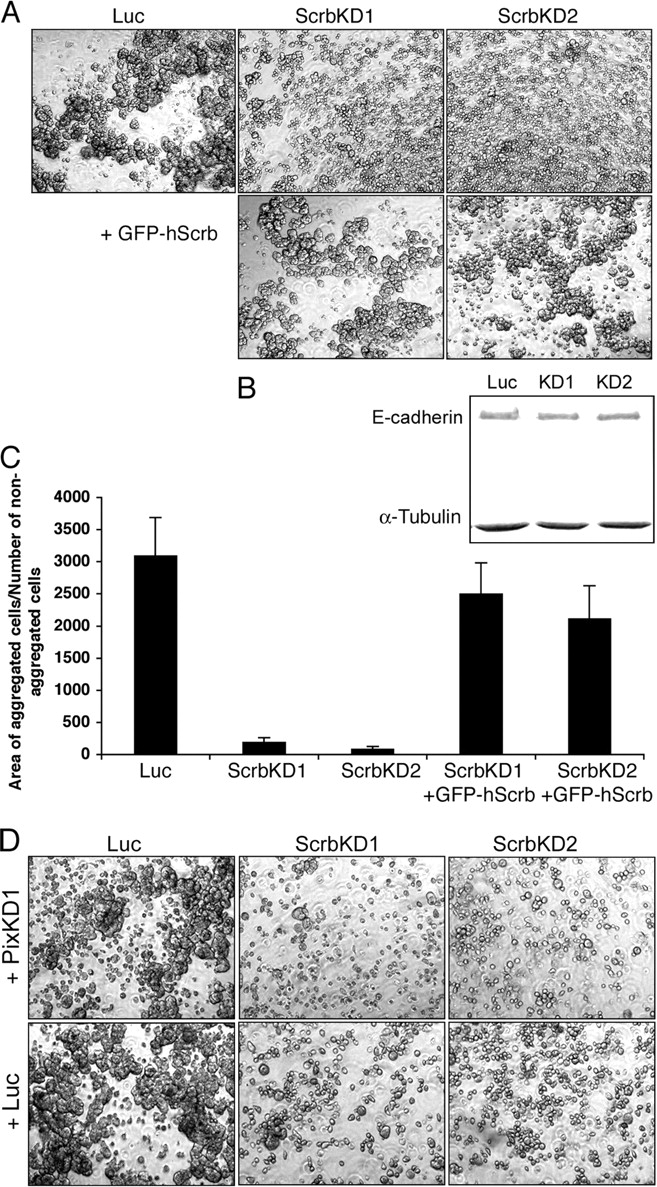
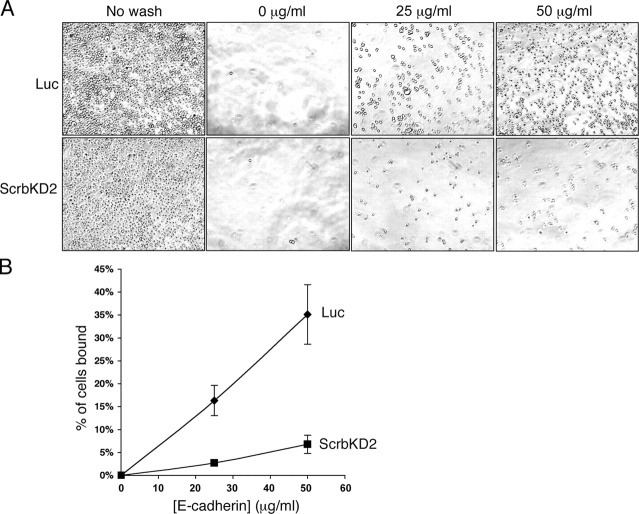
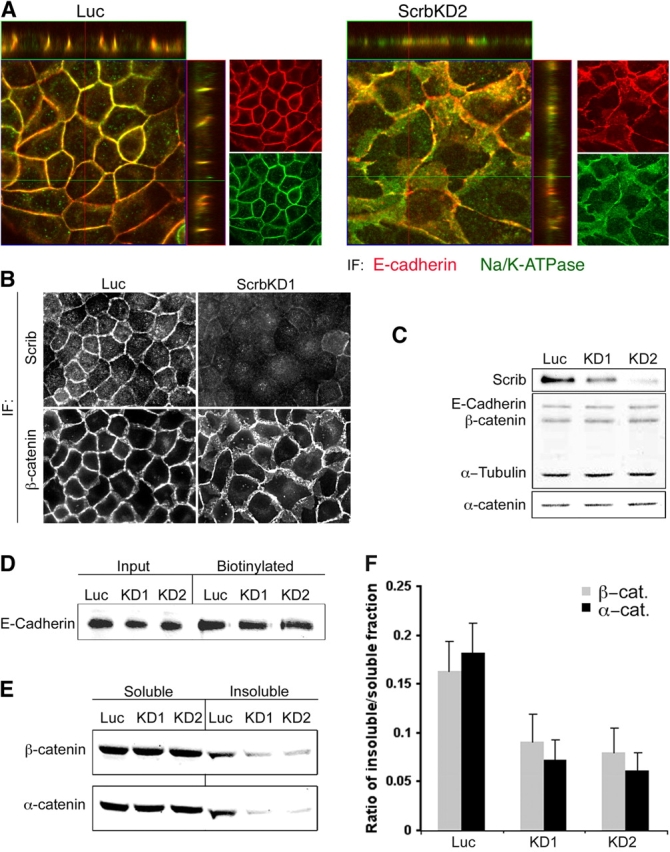
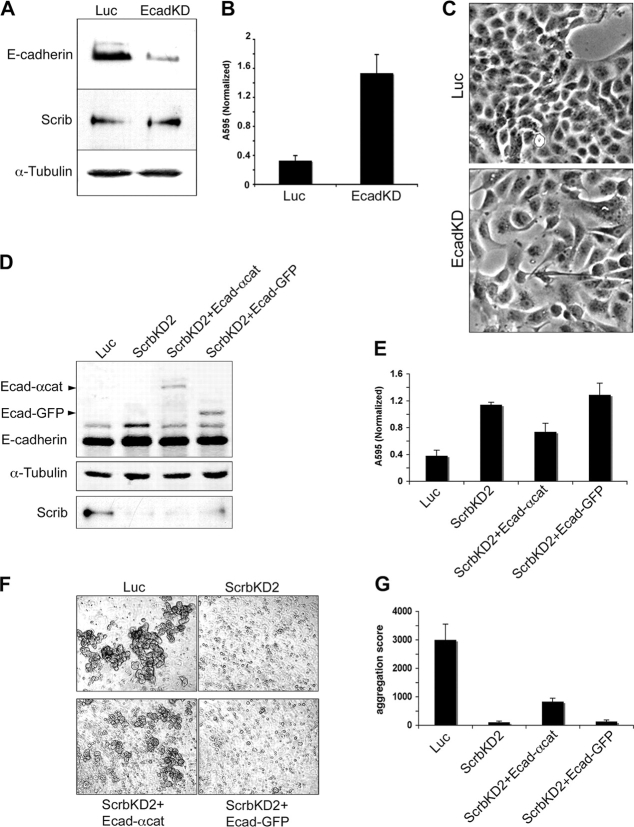
Scribble (Scrib) is a conserved polarity protein required in Drosophila melanogaster for synaptic function, neuroblast differentiation, and epithelial polarization. It is also a tumor suppressor. In rodents, Scrib has been implicated in receptor recycling and planar polarity but not in apical/basal polarity. We now show that knockdown of Scrib disrupts adhesion between Madin–Darby canine kidney epithelial cells. As a consequence, the cells acquire a mesenchymal appearance, migrate more rapidly, and lose directionality. Although tight junction assembly is delayed, confluent monolayers remain polarized. These effects are independent of Rac activation or Scrib binding to βPIX. Rather, Scrib depletion disrupts E-cadherin–mediated cell–cell adhesion. The changes in morphology and migration are phenocopied by E-cadherin knockdown. Adhesion is partially rescued by expression of an E-cadherin–α-catenin fusion protein but not by E-cadherin–green fluorescent protein. These results suggest that Scrib stabilizes the coupling between E-cadherin and the catenins and are consistent with the idea that mammalian Scrib could behave as a tumor suppressor by regulating epithelial cell adhesion and migration.
Overview
The claims and statistics of this paper haven’t been checked yet.
Run the check — free, no account needed. It reads the open-access text and checks the sources it cites.
Integrity signals
Registry
Cites
Statistics
Figures
Verification
Claims the paper makes
The claims and statistics of this paper haven’t been checked yet.
Run the check — free, no account needed. It reads the open-access text and checks the sources it cites.
Claims other papers make about this one
Each is checked against this paper’s own text: does it say what the citing paper says it does?
In the citing paper
“In MDCK cells, the consequences of Scribble knockdown depend on the level of protein reduction. Moderate reduction reduces Ecad-dependent cell adhesion and delays both the mesenchymal-to-epithelial transition and tight junction assembly. However, cells eventually polarize and become epithelial (Qin et al., 2005).”
From Scribble: A master scaffold in polarity, adhesion, synaptogenesis, and proliferation (2019) · cites this paper as Qin et al., 2005
Self-check
Percentages, sums and reported differences re-computed from the paper’s own numbers.
The self-check needs the paper’s full text.
Citations
Cites
Rational siRNA design for RNA interference
Reynolds, A., Leake, D., Boese, Q., Scaringe, S., Marshall, W. S., & Khvorova, A. (2004) · Nature Biotechnology · doi:10.1038/nbt936 · Cited by 2,094
Epithelial–mesenchymal transitions in development and pathologies
Thiery, J. P. (2003) · Current Opinion in Cell Biology · doi:10.1016/j.ceb.2003.10.006 · Cited by 1,710
Regulation of the small GTP‐binding protein Rho by cell adhesion and the cytoskeleton
Ren, X. D., Kiosses, W. B., & Schwartz, M. A. (1999) · The EMBO Journal · doi:10.1093/emboj/18.3.578 · Cited by 1,573
Regulation of cadherin-mediated adhesion in morphogenesis
Gumbiner, B. M. (2005) · Nature Reviews Molecular Cell Biology · doi:10.1038/nrm1699 · Cited by 1,523
Self-citationCooperative Regulation of Cell Polarity and Growth by Drosophila Tumor Suppressors
Bilder, D. H., Li, M., & Perrimon, N. (2000) · Science · doi:10.1126/science.289.5476.113 · Cited by 935
Woods, D. F., & Bryant, P. J. (1991) · Cell · doi:10.1016/0092-8674(81)90009-x · Cited by 898
Regulation of Cadherin Adhesive Activity
Gumbiner, B. M. (2000) · The Journal of Cell Biology · doi:10.1083/jcb.148.3.399 · Cited by 787
Self-citationSander, E., van Delft, S. V., ten Klooster, J. T., Reid, T., van der Kammen, R. A., Michiels, F., & Collard, J. G. (1998) · Journal of Cell Biology · doi:10.1083/jcb.143.5.1385 · Cited by 729
Adaptation of core mechanisms to generate cell polarity
Nelson, W. J. (2003) · Nature · doi:10.1038/nature01602 · Cited by 716
Identification of Vangl2 and Scrb1 as planar polarity genes in mammals
Montcouquiol, M., Rachel, R. A., Lanford, P. J., Copeland, N. G., Jenkins, N. A., & Kelley, M. W. (2003) · Nature · doi:10.1038/nature01618 · Cited by 705
scribble mutants cooperate with oncogenic Ras or Notch to cause neoplastic overgrowth in Drosophila
Brumby, A. M., & Richardson, H. E. (2003) · The EMBO Journal · doi:10.1093/emboj/cdg548 · Cited by 628
Yap, A., Niessen, C., & Gumbiner, B. (1998) · Journal of Cell Biology · doi:10.1083/jcb.141.3.779 · Cited by 613
Self-citationBilder, D. H. (2004) · Genes & Development · doi:10.1101/gad.1211604 · Cited by 572
Gottardi, C. J., Wong, E., & Gumbiner, B. M. (2001) · The Journal of Cell Biology · doi:10.1083/jcb.153.5.1049 · Cited by 555
Self-citationEpithelial Cell Polarity and Cell Junctions inDrosophila
Tepaß, U., Tanentzapf, G., Ward, R., & Fehon, R. G. (2001) · Annual Review of Genetics · doi:10.1146/annurev.genet.35.102401.091415 · Cited by 549
A Genetic Screen in Drosophila for Metastatic Behavior
Pagliarini, R. A., & Xu, T. (2003) · Science · doi:10.1126/science.1088474 · Cited by 543
Adams, C. L., Chen, Y., Smith, S. J., & Nelson, W. J. (1998) · The Journal of Cell Biology · doi:10.1083/jcb.142.4.1105 · Cited by 537
Le, T. L., Yap, A. S., & Stow, J. L. (1999) · The Journal of Cell Biology · doi:10.1083/jcb.146.1.219 · Cited by 533
Nakagawa, S., & Huibregtse, J. M. (2000) · Molecular and Cellular Biology · doi:10.1128/mcb.20.21.8244-8253.2000 · Cited by 477
Par-3 controls tight junction assembly through the Rac exchange factor Tiam1
Chen, X., & Macara, I. G. (2005) · Nature Cell Biology · doi:10.1038/ncb1226 · Cited by 474
Self-citationSelective Uncoupling of P120ctn from E-Cadherin Disrupts Strong Adhesion
Thoreson, M. A., Anastasiadis, P. Z., Daniel, J. M., Ireton, R. C., Wheelock, M. J., Johnson, K. R., Hummingbird, D. K., & Reynolds, A. B. (2000) · The Journal of Cell Biology · doi:10.1083/jcb.148.1.189 · Cited by 469
Inhibition of Invasion of Epithelial Cells by Tiam1-Rac Signaling
Hordijk, P. L., ten Klooster, J. P., van der Kammen, R. A., Michiels, F., Oomen, L. C. J. M., & Collard, J. G. (1997) · Science · doi:10.1126/science.278.5342.1464 · Cited by 441
Integrated activity of PDZ protein complexes regulates epithelial polarity
Bilder, D., Schober, M., & Perrimon, N. (2003) · Nature Cell Biology · doi:10.1038/ncb897 · Cited by 435
Chu, Y., Thomas, W. A., Eder, O., Pincet, F., Perez, É., Thiery, J. P., & Dufour, S. (2004) · The Journal of Cell Biology · doi:10.1083/jcb.200403043 · Cited by 419
Wyngaard, J. (1988) · American Meteorological Society eBooks · doi:10.1007/978-1-935704-16-4_2 · Cited by 414
Nagafuchi, A., Ishihara, S., & Tsukita, S. (1994) · The Journal of Cell Biology · doi:10.1083/jcb.127.1.235 · Cited by 386
Interactions between the crumbs, lethal giant larvae and bazooka pathways in epithelial polarization
Tanentzapf, G., & Tepass, U. (2003) · Nature Cell Biology · doi:10.1038/ncb896 · Cited by 367
Ehrlich, J. S., Hansen, M. D. H., & Nelson, W. J. (2002) · Developmental Cell · doi:10.1016/s1534-5807(02)00216-2 · Cited by 358
The tumour-suppressor genes lgl and dlg regulate basal protein targeting in Drosophila neuroblasts
Peng, C., Manning, L., Albertson, R., & Doe, C. Q. (2000) · Nature · doi:10.1038/35046094 · Cited by 341
Macara, I. G. (2004) · Nature Reviews Molecular Cell Biology · doi:10.1038/nrm1332 · Cited by 341
Self-citationDisruption of scribble (Scrb1) causes severe neural tube defects in the circletail mouse
Murdoch, J. N. (2003) · Human Molecular Genetics · doi:10.1093/hmg/ddg014 · Cited by 308
Dlg, Scribble and Lgl in cell polarity, cell proliferation and cancer
Humbert, P. O., Russell, S. M., & Richardson, H. E. (2003) · BioEssays · doi:10.1002/bies.10286 · Cited by 307
Palacios, F., Schweitzer, J. K., Boshans, R. L., & D’Souza‐Schorey, C. (2002) · Nature Cell Biology · doi:10.1038/ncb881 · Cited by 303
Dlg, Scrib and Lgl regulate neuroblast cell size and mitotic spindle asymmetry
Albertson, R., & Doe, C. Q. (2003) · Nature Cell Biology · doi:10.1038/ncb922 · Cited by 269
Molecular Mechanisms of Epithelial Morphogenesis
Schöck, F., & Perrimon, N. (2002) · Annual Review of Cell and Developmental Biology · doi:10.1146/annurev.cellbio.18.022602.131838 · Cited by 259
Epithelial polarity and tubulogenesis in vitro.
Zegers, M. M. P., O'Brien, L., Yu, W., Datta, A., & Mostov, K. (2003) · Trends in Cell Biology · doi:10.1016/s0962-8924(03)00036-9 · Cited by 256
Kemphues, K. J. (2000) · Cell · doi:10.1016/s0092-8674(00)80844-2 · Cited by 252
Role of Rho family GTPases in epithelial morphogenesis.Preprint
Aelst, L. V., & Symons, M. (2002) · Genes & Development · doi:10.1101/gad.978802 · Cited by 247
Junctional recruitment of mammalian Scribble relies on E-cadherin engagement
Navarro, C., Nola, S., Audebert, S., Santoni, M.-J., Arsanto, J.-P., Ginestier, C., Marchetto, S., Jacquemier, J., Isnardon, D., Le Bivic, A., et al. (2005) · Oncogene · doi:10.1038/sj.onc.1208632 · Cited by 237
Mammalian Scribble Forms a Tight Complex with the βPIX Exchange Factor
Audebert, S., Navarro, C., Nourry, C., Chasserot-Golaz, S., Lécine, P., Bellaiche, Y., Dupont, J.-L., Premont, R. T., Sempéré, C., Strub, J.-M., et al. (2004) · Current Biology · doi:10.1016/j.cub.2004.05.051 · Cited by 218
Multitasking in Tumor Progression: Signaling Functions of Cell Adhesion Molecules
Cavallaro, U., & Christofori, G. (2004) · Annals of the New York Academy of Sciences · doi:10.1196/annals.1294.006 · Cited by 159
Domains controlling cell polarity and proliferation in the Drosophila tumor suppressor Scribble
Zeitler, J., Hsu, C. P., Dionne, H., & Bilder, D. (2004) · The Journal of Cell Biology · doi:10.1083/jcb.200407158 · Cited by 135
Albertson, R., Chabu, C., Sheehan, A., & Doe, C. Q. (2004) · Journal of Cell Science · doi:10.1242/jcs.01525 · Cited by 135
Nakagawa, S., Yano, T., Nakagawa, K., Takizawa, S., Suzuki, Y., Yasugi, T., Huibregtse, J. M., & Taketani, Y. (2004) · British Journal of Cancer · doi:10.1038/sj.bjc.6601465 · Cited by 117
Structure of the I(2)gl gene of Drosophila and delimitation of its tumor suppressor domain
Jacob, L. R., Opper, M., Metzroth, B., Phannavong, B., & Mechler, B. M. (1987) · Cell · doi:10.1016/0092-8674(87)90217-0 · Cited by 106
Petit, M. M., Meulemans, S. M., Alen, P., Ayoubi, T. A., Jansen, E., & Van de Ven, W. J. (2005) · BMC Cell Biology · doi:10.1186/1471-2121-6-1 · Cited by 99
Tanimura, S., Chatani, Y., Hoshino, R., Sato, M., Watanabe, S., Kataoka, T., Nakamura, T., & Kohno, M. (1998) · Oncogene · doi:10.1038/sj.onc.1201905 · Cited by 95
Thyrotropin receptor trafficking relies on the hScrib–βPIX–GIT1–ARF6 pathway
Lahuna, O., Quellari, M., Achard, C. S., Nola, S., Méduri, G., Navarro, C., Vitale, N., Borg, J., & Misrahi, M. (2005) · The EMBO Journal · doi:10.1038/sj.emboj.7600616 · Cited by 85
hScrib interacts with ZO-2 at the cell-cell junctions of epithelial cells
Métais, J.-Y., Navarro, C., Santoni, M.-J., Audebert, S., & Borg, J.-P. (2005) · FEBS Letters · doi:10.1016/j.febslet.2005.05.062 · Cited by 77
Cell-Cell Dissociation upon Epithelial Cell Scattering Requires a Step Mediated by the Proteasome
Tsukamoto, T., & Nigám, S. K. (1999) · Journal of Biological Chemistry · doi:10.1074/jbc.274.35.24579 · Cited by 60
Cai, W., Chen, J.-Z., Ruan, L.-M., & Wang, Y. (2005) · Journal of Zhejiang University. Science A · doi:10.1631/jzus.2005.b0622 · Cited by 29
Research works printed but not linked: 1
- 1999, J. Cell Biol., 146, 219
Cited by
Sorted by citations
Molecular mechanisms of epithelial–mesenchymal transition
Lamouille, S., Xu, J., & Derynck, R. (2014) · Nature Reviews Molecular Cell Biology · doi:10.1038/nrm3758 · Cited by 8,091
Cadherins and cancer: how does cadherin dysfunction promote tumor progression?
Jeanes, A., Gottardi, C. J., & Yap, A. S. (2008) · Oncogene · doi:10.1038/onc.2008.343 · Cited by 791
Tight junctions/adherens junctions: basic structure and function
Niessen, C. M. (2007) · Journal of Investigative Dermatology · doi:10.1038/sj.jid.5700865 · Cited by 756
Epithelial–mesenchymal transition in tumor metastasis
Yeung, K. T., & Yang, J. (2016) · Molecular Oncology · doi:10.1002/1878-0261.12017 · Cited by 744
Organization and execution of the epithelial polarity programme
Rodriguez-Boulan, E. J., & Macara, I. G. (2014) · Nature Reviews Molecular Cell Biology · doi:10.1038/nrm3775 · Cited by 727
Self-citation
Metadata
- Authors
- Qin, Y., Capaldo, C., Gumbiner, B. M., & Macara, I. G.
- Affiliations
- University of Virginia (US)
- Venue
- The Journal of Cell Biology
- Publisher
- Rockefeller University Press
- Published
- 2005-12-12
- Volume
- 171
- Issue
- 6
- Pages
- 1061-1071
- ISSN
- 0021-9525 (ISSN-L)
- 1540-8140
- PMC
- PMC2171311
- OpenAlex
- W2052131905
- Cited by
- 285
- References
- 52
- Citations by year
- 2026: 10 · 2025: 5 · 2024: 9 · 2023: 12 · 2022: 11 · 2021: 10 · 2020: 8 · 2019: 15 · 2018: 12 · 2017: 18 · 2016: 17 · 2015: 13 · 2014: 16 · 2013: 15 · 2012: 26
- FWCI
- 7.98
- Type
- journal article
- Language
- en
- Open access
- green
- www.ncbi.nlm.nih.gov
- Licence
- cc-by-nc-sa
- Locations
- The Journal of Cell Biology (publishedVersion)
- PubMed Central (publishedVersion, cc-by-nc-sa)
- PubMed (publishedVersion)
- Funders
- National Cancer Institute (P01CA040042, CA 040042)
- National Institute of General Medical Sciences (GM 070902, R01GM070902)
- Topics
- Health Sciences › Medicine › Immunology and Allergy › Cell Adhesion Molecules Research
- Life Sciences › Biochemistry, Genetics and Molecular Biology › Cell Biology › Cellular Mechanics and Interactions
- Life Sciences › Biochemistry, Genetics and Molecular Biology › Cell Biology › Hippo pathway signaling and YAP/TAZ
- Keywords
- Scribble, epithelial polarity, E-cadherin, cell-cell adhesion, cell migration, tight junction assembly, catenins, alpha-catenin, mesenchymal transition, tumor suppressor, MDCK cells, planar cell polarity, betaPIX
- MeSH terms
- Animals, Cell Adhesion, Cell Count, Cell Movement, Cells, Cultured, Dogs, Epithelial Cells, Fluorescent Antibody Technique, Humans, Membrane Proteins, Phenotype, Protein Binding, Transfection, Cadherins, Microscopy, Confocal, Cell Cycle Proteins, Guanine Nucleotide Exchange Factors, Gene Silencing, Tumor Suppressor Proteins, RNA Interference, alpha Catenin, Rho Guanine Nucleotide Exchange Factors
About these checks
Registry, retraction, Cites and statistics results are computed, not judged, with one exception: a printed reference that no index lists is read once by a model before it counts as a citation error. Claims are extracted by a model and kept only when their quote appears verbatim in the text; each cited source is then checked, with a model’s help, for whether it says what the claim relies on. Those verdicts can be wrong — read the claim’s quote and the cited source before relying on one.
Statistics and arithmetic are recomputed, not judged.
Confidence bands are shown only for fields calibrated on our annotated test set. None is calibrated yet, so no band is shown.
What counts as a claim ›How we measure confidence ›How we check this ›
Are you an author, or do you see a problem with this page? Request a review
