CoChat

Microtubule stabilization specifies initial neuronal polarization

Open access
Witte, Harald, Neukirchen, Dorothee, Bradke, Frank · 2008 · The Journal of Cell Biology

The DOI matches its Crossref record; 56 of the 56 references it cites were found in a registry or an index.

Abstract

Axon formation is the initial step in establishing neuronal polarity. We examine here the role of microtubule dynamics in neuronal polarization using hippocampal neurons in culture. We see increased microtubule stability along the shaft in a single neurite before axon formation and in the axon of morphologically polarized cells. Loss of polarity or formation of multiple axons after manipulation of neuronal polarity regulators, synapses of amphids defective (SAD) kinases, and glycogen synthase kinase-3β correlates with characteristic changes in microtubule turnover. Consistently, changing the microtubule dynamics is sufficient to alter neuronal polarization. Application of low doses of the microtubule-destabilizing drug nocodazole selectively reduces the formation of future dendrites. Conversely, low doses of the microtubule-stabilizing drug taxol shift polymerizing microtubules from neurite shafts to process tips and lead to the formation of multiple axons. Finally, local stabilization of microtubules using a photoactivatable analogue of taxol induces axon formation from the activated area. Thus, local microtubule stabilization in one neurite is a physiological signal specifying neuronal polarization.

Overview

The claims and statistics of this paper haven’t been checked yet.

Free: it reads the open-access text and checks the first 5 claims that cite a source we can check. Create a free account to check every claim.

A few free checks a day · papers already verified open instantly · results are public

Integrity signals

Registry

Crossref · 10.1083/jcb.200707042

Cites

56 of 56 references verified0 citation errors · 0 not checkable

Statistics

Figures

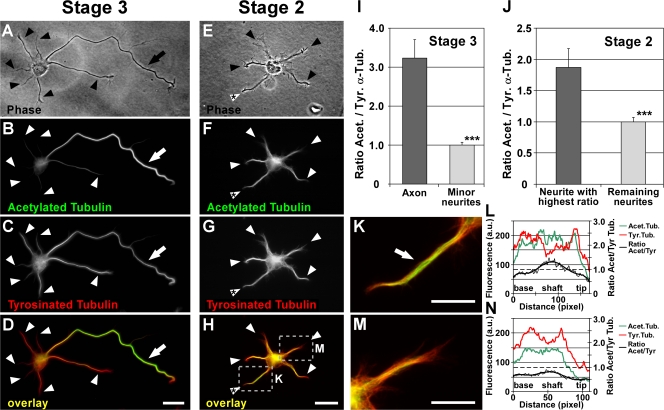
Figure 1. Differential distribution of acetylated and tyrosinated MTs in hippocampal neurons. (A–H) Polarized stage 3 (A–D) and morphologically unpolarized stage 2 (E–H) rat hippocampal neurons stained for acetylated (B and F) and tyrosinated (C and G) α-tubulin (arrows, axons; arrowheads, minor neurites). Cells were permeabilized during fixation to remove unpolymerized tubulin subunits, therefore only tubulin incorporated in MTs was assessed. In stage 3 neurons, a high ratio of acetylated to tyrosinated α-tubulin is found in MTs in the axonal shaft (D, arrow) in comparison to MTs of minor neurites (D, arrowheads, and I). In 35.0 ± 6.1% of morphologically unpolarized stage 2 neurons, the ratio of acetylated/tyrosinated α-tubulin is significantly increased in one of the minor neurites (H, white arrowhead with asterisk; P < 0.05 by Hampel outlier test). The areas boxed in H are shown in higher magnification in K and M. (I and J) Ratio quantification of fluorescence intensities of acetylated and tyrosinated α-tubulin in MTs of stage 2 (J) and 3 (I) neurons (mean ± SEM; n > 105 neurons from three independent experiments for each stage 2 and 3). Values are normalized to the mean of nonaxonal or nonmaximal processes for stage 3 and 2, respectively. ***, P < 0.001 by t test. (K–N) Higher magnification views (K and M) and profiles of immunofluorescence intensity (in arbitrary units; L and N) of acetylated and tyrosinated α-tubulin of the neurites marked in H. Bars: (A–H) 20 μm; (K and M) 10 μm.
Figure 1. Differential distribution of acetylated and tyrosinated MTs in hippocampal neurons. (A–H) Polarized stage 3 (A–D) and morphologically unpolarized stage 2 (E–H) rat hippocampal neurons stained for acetylated (B and F) and tyrosinated (C and G) α-tubulin (arrows, axons; arrowheads, minor neurites). Cells were permeabilized during fixation to remove unpolymerized tubulin subunits, therefore only tubulin incorporated in MTs was assessed. In stage 3 neurons, a high ratio of acetylated to tyrosinated α-tubulin is found in MTs in the axonal shaft (D, arrow) in comparison to MTs of minor neurites (D, arrowheads, and I). In 35.0 ± 6.1% of morphologically unpolarized stage 2 neurons, the ratio of acetylated/tyrosinated α-tubulin is significantly increased in one of the minor neurites (H, white arrowhead with asterisk; P < 0.05 by Hampel outlier test). The areas boxed in H are shown in higher magnification in K and M. (I and J) Ratio quantification of fluorescence intensities of acetylated and tyrosinated α-tubulin in MTs of stage 2 (J) and 3 (I) neurons (mean ± SEM; n > 105 neurons from three independent experiments for each stage 2 and 3). Values are normalized to the mean of nonaxonal or nonmaximal processes for stage 3 and 2, respectively. ***, P < 0.001 by t test. (K–N) Higher magnification views (K and M) and profiles of immunofluorescence intensity (in arbitrary units; L and N) of acetylated and tyrosinated α-tubulin of the neurites marked in H. Bars: (A–H) 20 μm; (K and M) 10 μm.CC BY-NC-SA · PubMed Central
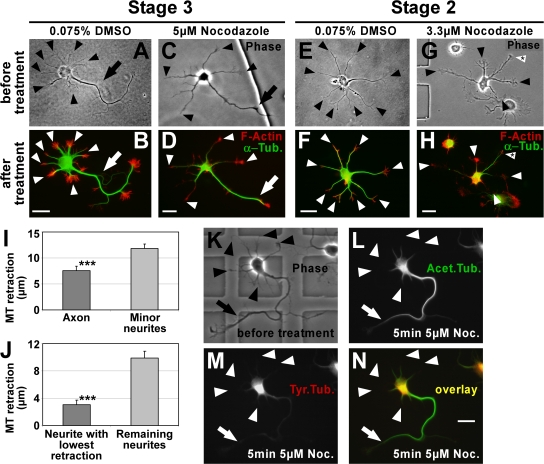
Figure 2. Stable MTs are enriched in axons. (A–H) To consider actual differences in MT stability only, MTs (green) were partially depolymerized by treatment with nocodazole and their retraction from the distal end of the processes toward the cell body was examined (see I and J). F-actin (red) outlining the neuron was used as a reference point for measuring MT retraction. In DMSO-treated control cells, MTs reach close to the distal end of both axon (B, arrow) and minor neurites (B and F, arrowheads). In nocodazole-treated cells, MTs of minor neurites retract toward the cell body (D and H, arrowheads). MTs in the axon of stage 3 cells (D, arrow) and in one of the minor neurites of stage 2 cells (H, arrowhead with asterisk) are more resistant to depolymerization. Arrows, axons; arrowheads, minor neurites. (I and J) MT retraction after nocodazole treatment in polarized stage 3 (I) and morphologically unpolarized stage 2 (J) neurons (mean ± SEM; n = 119 and 50 neurons from five and three independent experiments, respectively; ***, P < 0.001 by t test). (K–N) Polarized rat hippocampal neurons with one axon (arrow) and several minor neurites (arrowheads) after 2 DIV before (K) and after (L–N) treatment with nocodazole (5 μM for 5 min). Tyrosinated (M and N, red) and acetylated (L and N, green) MTs were assessed. Bars, 20 μm.
Figure 2. Stable MTs are enriched in axons. (A–H) To consider actual differences in MT stability only, MTs (green) were partially depolymerized by treatment with nocodazole and their retraction from the distal end of the processes toward the cell body was examined (see I and J). F-actin (red) outlining the neuron was used as a reference point for measuring MT retraction. In DMSO-treated control cells, MTs reach close to the distal end of both axon (B, arrow) and minor neurites (B and F, arrowheads). In nocodazole-treated cells, MTs of minor neurites retract toward the cell body (D and H, arrowheads). MTs in the axon of stage 3 cells (D, arrow) and in one of the minor neurites of stage 2 cells (H, arrowhead with asterisk) are more resistant to depolymerization. Arrows, axons; arrowheads, minor neurites. (I and J) MT retraction after nocodazole treatment in polarized stage 3 (I) and morphologically unpolarized stage 2 (J) neurons (mean ± SEM; n = 119 and 50 neurons from five and three independent experiments, respectively; ***, P < 0.001 by t test). (K–N) Polarized rat hippocampal neurons with one axon (arrow) and several minor neurites (arrowheads) after 2 DIV before (K) and after (L–N) treatment with nocodazole (5 μM for 5 min). Tyrosinated (M and N, red) and acetylated (L and N, green) MTs were assessed. Bars, 20 μm.CC BY-NC-SA · PubMed Central
Figure 3. Altered neuronal polarity correlates with changed MT stability. (A and B) Rat hippocampal neurons grown in the presence of the GSK-3β inhibitor SB 415286 for 72 (A) and 24 h (B). Stage 3 neurons have formed multiple axons that feature an increased MT stability (A, arrows) compared with minor neurites (A, arrowhead). A rise in MT acetylation in several minor neurites (B, arrowheads with asterisk) precedes the formation of multiple axons in morphologically still unpolarized stage 2 neurons treated with GSK-3β inhibitor. Arrows, axons; arrowhead, minor neurites. Bars, 20 μm. (C) Ratio quantification of fluorescence intensities of acetylated and tyrosinated α-tubulin in MTs of unpolarized stage 2 neurons. The normalized average ratio of the five longest neurites is shown. Approximately 5 h after treatment with SB 415286, stage 2 neurons show a trend toward increased MT acetylation (23.0 ± 10.6%), which indicates a rise in MT stability. The increase is significant after ∼8 h (47.4 ± 8.7%; mean ± SEM; n > 50 neurons per condition and time point from three independent experiments; *, P < 0.05 by t test). (D) Rat hippocampal neurons (3 DIV) treated with the GSK-3β inhibitor SB 415286 (10–20 μM treatment 6–8 h after plating) formed 2.1 ± 0.1 axons on average. These supernumerary axons show an increased ratio of acetylated to tyrosinated α-tubulin equal (P > 0.35 by t test) to that of the single axon of stage 3 control neurons (treatment with 0.04% DMSO; mean ± SEM; n > 35 neurons from three independent experiments). (E and F) Hippocampal neurons (3 DIV) derived from mice deficient for SAD A and B kinase show disturbed polarity and lack a defined axon. Instead, SAD A/B knockout neurons form multiple processes of similar length and uniform tubulin acetylation levels (see G), yet a high cell-to-cell variability. Bars, 20 μm. (G) Ratio quantification of fluorescence intensities of acetylated and tyrosinated α-tubulin in MTs. Processes of SAD A−/−B−/− neurons are short of the specific enrichment of acetylated MTs in one process found in wild-type as well as littermate control neurons (SAD A+/+B+/−; mean ± SEM; n = 66 and 27 neurons from three independent experiments for SAD A−/− SAD B−/− and control, respectively). Note that the acetylation/tyrosination ratio varies slightly in control cells between species (rat vs. mouse; D and G). (H) Ratio of the acetylation/tyrosination ratios of the longest versus second longest process per cell for SAD A−/−B−/− and control neurons (mean ± SEM; ***, P < 0.001 by t test).
Figure 3. Altered neuronal polarity correlates with changed MT stability. (A and B) Rat hippocampal neurons grown in the presence of the GSK-3β inhibitor SB 415286 for 72 (A) and 24 h (B). Stage 3 neurons have formed multiple axons that feature an increased MT stability (A, arrows) compared with minor neurites (A, arrowhead). A rise in MT acetylation in several minor neurites (B, arrowheads with asterisk) precedes the formation of multiple axons in morphologically still unpolarized stage 2 neurons treated with GSK-3β inhibitor. Arrows, axons; arrowhead, minor neurites. Bars, 20 μm. (C) Ratio quantification of fluorescence intensities of acetylated and tyrosinated α-tubulin in MTs of unpolarized stage 2 neurons. The normalized average ratio of the five longest neurites is shown. Approximately 5 h after treatment with SB 415286, stage 2 neurons show a trend toward increased MT acetylation (23.0 ± 10.6%), which indicates a rise in MT stability. The increase is significant after ∼8 h (47.4 ± 8.7%; mean ± SEM; n > 50 neurons per condition and time point from three independent experiments; *, P < 0.05 by t test). (D) Rat hippocampal neurons (3 DIV) treated with the GSK-3β inhibitor SB 415286 (10–20 μM treatment 6–8 h after plating) formed 2.1 ± 0.1 axons on average. These supernumerary axons show an increased ratio of acetylated to tyrosinated α-tubulin equal (P > 0.35 by t test) to that of the single axon of stage 3 control neurons (treatment with 0.04% DMSO; mean ± SEM; n > 35 neurons from three independent experiments). (E and F) Hippocampal neurons (3 DIV) derived from mice deficient for SAD A and B kinase show disturbed polarity and lack a defined axon. Instead, SAD A/B knockout neurons form multiple processes of similar length and uniform tubulin acetylation levels (see G), yet a high cell-to-cell variability. Bars, 20 μm. (G) Ratio quantification of fluorescence intensities of acetylated and tyrosinated α-tubulin in MTs. Processes of SAD A−/−B−/− neurons are short of the specific enrichment of acetylated MTs in one process found in wild-type as well as littermate control neurons (SAD A+/+B+/−; mean ± SEM; n = 66 and 27 neurons from three independent experiments for SAD A−/− SAD B−/− and control, respectively). Note that the acetylation/tyrosination ratio varies slightly in control cells between species (rat vs. mouse; D and G). (H) Ratio of the acetylation/tyrosination ratios of the longest versus second longest process per cell for SAD A−/−B−/− and control neurons (mean ± SEM; ***, P < 0.001 by t test).CC BY-NC-SA · PubMed Central
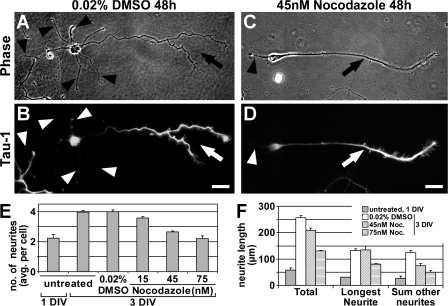
Figure 4. Moderate MT destabilization selectively blocks the formation of minor neurites. (A–D) Rat hippocampal neurons (3 DIV) cultured in the presence of various low concentrations of nocodazole or 0.02% DMSO (treatment after 1 DIV) stained for Tau-1 (B and D). (A and B) Control neurons have formed one axon (A, arrow) with the typical Tau-1 gradient toward its distal part (B, arrow) and several Tau-1–negative minor neurites (arrowheads). (C and D) The number of minor neurites (arrowhead) is reduced under growth conditions that slightly destabilize MTs, however, neurons are still able to form an axon (arrow). Bars, 20 μm. (E) Nocodazole reduces the number of minor neurites formed in a concentration-dependent manner (neurites per cell: 4.0 ± 0.1, 3.6 ± 0.1, 2.6 ± 0.1, and 2.2 ± 0.2 for 0.02% DMSO and 15, 45, and 75 nM nocodazole, respectively; P < 0.001 by ANOVA; n > 750 neurons from three independent experiments per condition). (F) Neurite extension is not blocked by low concentrations of nocodazole. Total neurite length increased from day 1 to 3 under all conditions (P < 0.001 by t test), though to a lesser extent when treated with 45 or 75 nM nocodazole (increase from 57.5 ± 7.8 to 255.8 ± 9.7, 209.3 ± 8.6, or 130.3 ± 3.6 μm for 0.02% DMSO and 45 or 75 nM nocodazole, respectively; n > 275 neurons per condition from three independent experiments). Data is presented as mean ± SEM.
Figure 4. Moderate MT destabilization selectively blocks the formation of minor neurites. (A–D) Rat hippocampal neurons (3 DIV) cultured in the presence of various low concentrations of nocodazole or 0.02% DMSO (treatment after 1 DIV) stained for Tau-1 (B and D). (A and B) Control neurons have formed one axon (A, arrow) with the typical Tau-1 gradient toward its distal part (B, arrow) and several Tau-1–negative minor neurites (arrowheads). (C and D) The number of minor neurites (arrowhead) is reduced under growth conditions that slightly destabilize MTs, however, neurons are still able to form an axon (arrow). Bars, 20 μm. (E) Nocodazole reduces the number of minor neurites formed in a concentration-dependent manner (neurites per cell: 4.0 ± 0.1, 3.6 ± 0.1, 2.6 ± 0.1, and 2.2 ± 0.2 for 0.02% DMSO and 15, 45, and 75 nM nocodazole, respectively; P < 0.001 by ANOVA; n > 750 neurons from three independent experiments per condition). (F) Neurite extension is not blocked by low concentrations of nocodazole. Total neurite length increased from day 1 to 3 under all conditions (P < 0.001 by t test), though to a lesser extent when treated with 45 or 75 nM nocodazole (increase from 57.5 ± 7.8 to 255.8 ± 9.7, 209.3 ± 8.6, or 130.3 ± 3.6 μm for 0.02% DMSO and 45 or 75 nM nocodazole, respectively; n > 275 neurons per condition from three independent experiments). Data is presented as mean ± SEM.CC BY-NC-SA · PubMed Central
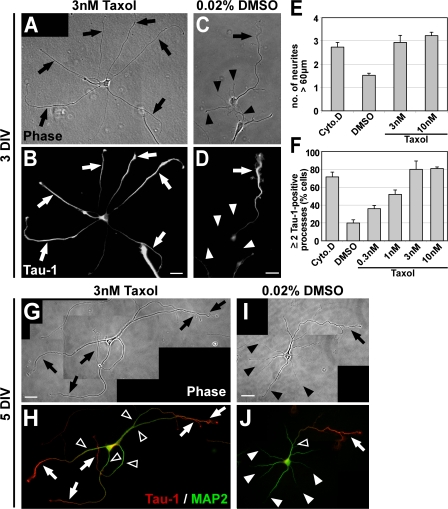
Figure 5. Taxol-induced MT stabilization triggers the formation of multiple axons. (A–D) Rat hippocampal neurons (3 DIV) grown in the presence of low concentrations of taxol (3 nM) or DMSO (treatment after 1 DIV) stained for the axonal marker Tau-1. Taxol induces the formation of multiple elongated processes (A, arrows) positive for Tau-1 (B, arrows). Control neurons have formed one axon (arrow) and several minor neurites (arrowheads; C and D). (E) The number of neurites longer than 60 μm is increased after 2 d of taxol treatment (mean ± SEM; P < 0.001 by t test; n > 170 neurons per condition from three independent experiments). DMSO (0.02%), vehicle; Cyto.D (1 μM Cytochalasin D), positive control (Bradke and Dotti, 1999). (F) The number of cells with two or more Tau-1–positive processes increases in a concentration-dependent manner in taxol-treated neurons (mean ± SEM; P < 0.001 by ANOVA; n > 800 neurons per condition from at least three independent experiments). (G–J) Rat hippocampal neurons (5 DIV) grown in the presence of taxol (3 nM; G and H) or DMSO (treatment after 1 DIV; I and J) and stained for Tau-1 (H and J, red) and the dendritic marker MAP2 (H and J, green). DMSO-treated neurons have formed one axon (arrows) and several dendrites (arrowheads; I) Taxol-induced processes (G, arrows) show a proximal-distal gradient of Tau-1 (H, arrows) like control axons (J, arrow). The MAP2 signal is restricted to dendrites (J, white arrowheads) and the proximal part of axons and taxol-induced processes (H and J, open arrowheads). Bars: (A–D) 20 μm; (G–J) 25 μm.
Figure 5. Taxol-induced MT stabilization triggers the formation of multiple axons. (A–D) Rat hippocampal neurons (3 DIV) grown in the presence of low concentrations of taxol (3 nM) or DMSO (treatment after 1 DIV) stained for the axonal marker Tau-1. Taxol induces the formation of multiple elongated processes (A, arrows) positive for Tau-1 (B, arrows). Control neurons have formed one axon (arrow) and several minor neurites (arrowheads; C and D). (E) The number of neurites longer than 60 μm is increased after 2 d of taxol treatment (mean ± SEM; P < 0.001 by t test; n > 170 neurons per condition from three independent experiments). DMSO (0.02%), vehicle; Cyto.D (1 μM Cytochalasin D), positive control (Bradke and Dotti, 1999). (F) The number of cells with two or more Tau-1–positive processes increases in a concentration-dependent manner in taxol-treated neurons (mean ± SEM; P < 0.001 by ANOVA; n > 800 neurons per condition from at least three independent experiments). (G–J) Rat hippocampal neurons (5 DIV) grown in the presence of taxol (3 nM; G and H) or DMSO (treatment after 1 DIV; I and J) and stained for Tau-1 (H and J, red) and the dendritic marker MAP2 (H and J, green). DMSO-treated neurons have formed one axon (arrows) and several dendrites (arrowheads; I) Taxol-induced processes (G, arrows) show a proximal-distal gradient of Tau-1 (H, arrows) like control axons (J, arrow). The MAP2 signal is restricted to dendrites (J, white arrowheads) and the proximal part of axons and taxol-induced processes (H and J, open arrowheads). Bars: (A–D) 20 μm; (G–J) 25 μm.CC BY-NC-SA · PubMed Central
Figure 6. Multiaxonal neurons mature and form neuronal networks. (A–E) Maturation of taxol-treated neurons. To unequivocally identify the origin of axons in the dense neuronal network neurons establish, we used cultures of mouse hippocampal neurons in which a subset of cells expressed EGFP under the control of a ubiquitously active promoter (Okabe et al., 1997). Mixed wild-type/GFP cultures containing 1–3% of neurons expressing GFP allow individual neurons to be followed in dense networks (A and B). Taxol (final concentration 3 μm) was added to the medium of the mixed culture after 1 DIV, neurons were further grown in the presence of the drug, fixed after 11 DIV, and immunostained for GFP (green) and the presynaptic marker synapsin 1 (blue). (A and B) Taxol-treated neurons have formed multiple axons (arrows) in 81.3 ± 2.2% of the cases (n > 120 neurons). (C–E) Higher magnifications of the regions marked in A and B. The multiaxonal GFP-positive neurons cluster the presynaptic marker synapsin 1 in their axons. Magnifications of the regions boxed in C–E are shown as insets to better visualize the localization of synapsin 1 on GFP-positive axons (arrows). Bars: (A and B) 100 μm; (C–E) 20 μm.
Figure 6. Multiaxonal neurons mature and form neuronal networks. (A–E) Maturation of taxol-treated neurons. To unequivocally identify the origin of axons in the dense neuronal network neurons establish, we used cultures of mouse hippocampal neurons in which a subset of cells expressed EGFP under the control of a ubiquitously active promoter (Okabe et al., 1997). Mixed wild-type/GFP cultures containing 1–3% of neurons expressing GFP allow individual neurons to be followed in dense networks (A and B). Taxol (final concentration 3 μm) was added to the medium of the mixed culture after 1 DIV, neurons were further grown in the presence of the drug, fixed after 11 DIV, and immunostained for GFP (green) and the presynaptic marker synapsin 1 (blue). (A and B) Taxol-treated neurons have formed multiple axons (arrows) in 81.3 ± 2.2% of the cases (n > 120 neurons). (C–E) Higher magnifications of the regions marked in A and B. The multiaxonal GFP-positive neurons cluster the presynaptic marker synapsin 1 in their axons. Magnifications of the regions boxed in C–E are shown as insets to better visualize the localization of synapsin 1 on GFP-positive axons (arrows). Bars: (A and B) 100 μm; (C–E) 20 μm.CC BY-NC-SA · PubMed Central
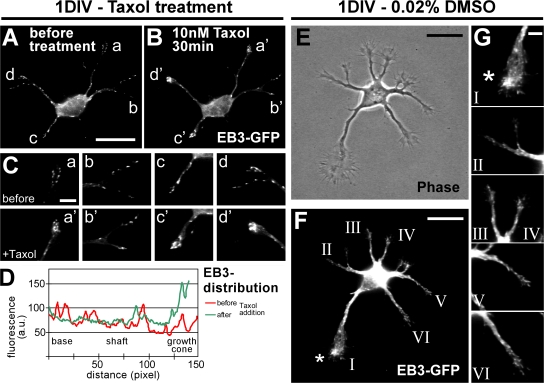
Figure 7. Taxol directs growing MT plus ends toward the tips of processes. (A–D) After 1 DIV, unpolarized neurons transfected with EB3-GFP (A) were subjected to low doses of taxol. The effect on MT dynamics was examined 30 min after treatment by monitoring the distribution of EB3-GFP (B–D). n = 52 neurons from eight independent experiments. (C) Higher magnification of the growth cones marked in A and B. EB3-GFP is mainly localized at the tips of neurites after a 30-min treatment with 10 nM taxol (a'–d') in comparison to a more even distribution before treatment (a–d). (D) Profiles of EB3-GFP immunofluorescence intensity (arbitrary units) of a representative neurite (neurite “c”) before (red) and after (green) taxol treatment. (E–G) Dynamic MT plus ends in polarizing neurons (1 DIV) visualized by transfection with EB3-GFP. (G) Higher magnification of the growth cones marked in F. The growth cone of the future axon (F and G, asterisk) harbors a high amount of dynamic MTs in comparison to the growth cones of the remaining minor neurites in 64 ± 12% of the cases (n = 14 neurons from more than five independent experiments). Bars: (A and B) 20 μm; (C) 5 μm; (E and F) 20 μm; (G) 5 μm.
Figure 7. Taxol directs growing MT plus ends toward the tips of processes. (A–D) After 1 DIV, unpolarized neurons transfected with EB3-GFP (A) were subjected to low doses of taxol. The effect on MT dynamics was examined 30 min after treatment by monitoring the distribution of EB3-GFP (B–D). n = 52 neurons from eight independent experiments. (C) Higher magnification of the growth cones marked in A and B. EB3-GFP is mainly localized at the tips of neurites after a 30-min treatment with 10 nM taxol (a'–d') in comparison to a more even distribution before treatment (a–d). (D) Profiles of EB3-GFP immunofluorescence intensity (arbitrary units) of a representative neurite (neurite “c”) before (red) and after (green) taxol treatment. (E–G) Dynamic MT plus ends in polarizing neurons (1 DIV) visualized by transfection with EB3-GFP. (G) Higher magnification of the growth cones marked in F. The growth cone of the future axon (F and G, asterisk) harbors a high amount of dynamic MTs in comparison to the growth cones of the remaining minor neurites in 64 ± 12% of the cases (n = 14 neurons from more than five independent experiments). Bars: (A and B) 20 μm; (C) 5 μm; (E and F) 20 μm; (G) 5 μm.CC BY-NC-SA · PubMed Central
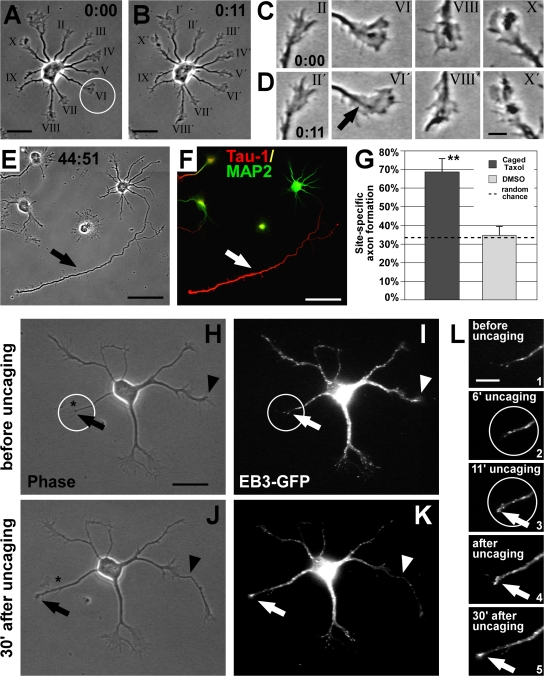
Figure 8. Local MT stabilization promotes axon formation. (A and B) Rat hippocampal neuron (1 DIV) before (A) and after (B) UV-mediated photoactivation (circle) of caged taxol at the tip of one randomly chosen minor neurite. (C and D) Photoactivation did not interfere with the overall growth cone dynamics; most growth cones, including the pulsed one (arrow), are active. (E and F) 2 d after uncaging, the pulsed process had become the axon (arrow), which is Tau-1–positive (red) and MAP2-negative (green; F). (G) Probability of axon formation in the targeted area doubles after local activation of caged taxol compared with that expected by random chance (mean ± SEM; **, P < 0.01 by χ2 test). Control treatment (DMSO and UV) does not influence randomized axon formation (P > 0.8 by χ2 test). (H–L) Caged taxol was locally activated at the tip of a nongrowing neurite (circle) of an EB3-GFP–transfected neuron at 1 DIV. Before uncaging, the chosen neurite does not grow and shows little MT dynamics (H and I [arrow], and L, 1), whereas another neurite is rapidly growing (H and I, arrowhead; also see J and K). During uncaging (L, 2 and 3), the process becomes activated, visualized by enrichment of EB3-GFP at its tip (L, 3, arrow). After uncaging, the pulsed neurite shows increased thickness (J and K). Dynamic MTs keep protruding to the peripheral part of the process, promoting its outgrowth (K and L, 4 and 5, arrow). The asterisk in H and J indicates the initial position of the neurite tip in H. Bars: (A, B, and H–K) 20 μm; (C and D) 5 μm; (E and F) 50 μm; (L) 10 μm.
Figure 8. Local MT stabilization promotes axon formation. (A and B) Rat hippocampal neuron (1 DIV) before (A) and after (B) UV-mediated photoactivation (circle) of caged taxol at the tip of one randomly chosen minor neurite. (C and D) Photoactivation did not interfere with the overall growth cone dynamics; most growth cones, including the pulsed one (arrow), are active. (E and F) 2 d after uncaging, the pulsed process had become the axon (arrow), which is Tau-1–positive (red) and MAP2-negative (green; F). (G) Probability of axon formation in the targeted area doubles after local activation of caged taxol compared with that expected by random chance (mean ± SEM; **, P < 0.01 by χ2 test). Control treatment (DMSO and UV) does not influence randomized axon formation (P > 0.8 by χ2 test). (H–L) Caged taxol was locally activated at the tip of a nongrowing neurite (circle) of an EB3-GFP–transfected neuron at 1 DIV. Before uncaging, the chosen neurite does not grow and shows little MT dynamics (H and I [arrow], and L, 1), whereas another neurite is rapidly growing (H and I, arrowhead; also see J and K). During uncaging (L, 2 and 3), the process becomes activated, visualized by enrichment of EB3-GFP at its tip (L, 3, arrow). After uncaging, the pulsed neurite shows increased thickness (J and K). Dynamic MTs keep protruding to the peripheral part of the process, promoting its outgrowth (K and L, 4 and 5, arrow). The asterisk in H and J indicates the initial position of the neurite tip in H. Bars: (A, B, and H–K) 20 μm; (C and D) 5 μm; (E and F) 50 μm; (L) 10 μm.CC BY-NC-SA · PubMed Central

Verification

Claims the paper makes

The claims and statistics of this paper haven’t been checked yet.

Free: it reads the open-access text and checks the first 5 claims that cite a source we can check. Create a free account to check every claim.

A few free checks a day · papers already verified open instantly · results are public

Claims other papers make about this one

Each is checked against this paper’s own text: does it say what the citing paper says it does?

Self-check

Percentages, sums and reported differences re-computed from the paper’s own numbers.

The self-check needs the paper’s full text.

Citations

Cites

Show all 56 references

Research works printed but not linked: 3

  1. 1991, J. Cell Sci. Suppl., 15, 75
  2. 2005, Cell., 120, 123
  3. 2003, Nat. Rev. Mol. Cell Biol., 4, 938

Cited by

See all 593

Metadata

Authors
Witte, H., Neukirchen, D., & Bradke, F.
Affiliations
  • Max Planck Institute of Neurobiology (DE)
  • Max Planck Society (DE)
Venue
The Journal of Cell Biology
Published
2008-02-11
Volume
180
Issue
3
Pages
619-632
ISSN
  • 0021-9525 (ISSN-L)
  • 1540-8140
OpenAlex
W2084158780
Cited by
564
References
54
Citations by year
2026: 22 · 2025: 21 · 2024: 19 · 2023: 25 · 2022: 35 · 2021: 36 · 2020: 49 · 2019: 27 · 2018: 27 · 2017: 29 · 2016: 38 · 2015: 38 · 2014: 24 · 2013: 24 · 2012: 39
FWCI
15.86
Type
journal article
Language
en
Open access
Licence
cc-by-nc-sa
Locations
  • The Journal of Cell Biology (publishedVersion)
  • PubMed Central (publishedVersion, cc-by-nc-sa)
  • PubMed (publishedVersion)
  • Max Planck Institute for Plasma Physics (submittedVersion)
  • Max Planck Digital Library (submittedVersion)
  • MPG.PuRe (Max Planck Society) (submittedVersion)
Topics
  • Life Sciences › Neuroscience › Cellular and Molecular Neuroscience › Axon Guidance and Neuronal Signaling
  • Life Sciences › Neuroscience › Developmental Neuroscience › Neurogenesis and neuroplasticity mechanisms
  • Life Sciences › Biochemistry, Genetics and Molecular Biology › Cell Biology › Microtubule and mitosis dynamics
Keywords
neuronal polarity, axon formation, microtubule stabilization, microtubule dynamics, hippocampal neurons, glycogen synthase kinase-3β, nocodazole, paclitaxel, dendrite formation
MeSH terms
Glycogen Synthase Kinase 3 beta, Animals, Cell Differentiation, Cells, Cultured, Central Nervous System, Hippocampus, Microtubules, Neurons, Nocodazole, Neurites, Cell Polarity, Paclitaxel, Protein Serine-Threonine Kinases, Mice, Knockout, Growth Cones, Intercellular Signaling Peptides and Proteins, Glycogen Synthase Kinase 3, Tubulin Modulators, Mice, Rats

About these checks

Registry, retraction, Cites and statistics results are computed, not judged, with one exception: a printed reference that no index lists is read once by a model before it counts as a citation error. Claims are extracted by a model and kept only when their quote appears verbatim in the text; each cited source is then checked, with a model’s help, for whether it says what the claim relies on. Those verdicts can be wrong — read the claim’s quote and the cited source before relying on one.

Statistics and arithmetic are recomputed, not judged.

Confidence bands are shown only for fields calibrated on our annotated test set. None is calibrated yet, so no band is shown.

What counts as a claim ›How we measure confidence ›How we check this ›

Are you an author, or do you see a problem with this page? Request a review

Data sources

Bibliographic data: Semantic Scholar, OpenAlex, Crossref.

Contains information from the Semantic Scholar Academic Graph Datasets, made available under the ODC Attribution License (ODC-BY 1.0).

Semantic Scholar’s data is described in: Kinney, R., et al. (2023). The Semantic Scholar Open Data Platform. arXiv:2301.10140.