

The DOI matches its Crossref record; 30 of the 30 references it cites were found in a registry or an index.
Expression of interleukin (IL)-2 and IL-7 receptors discriminates between human regulatory and activated T cells
Open accessAbstract
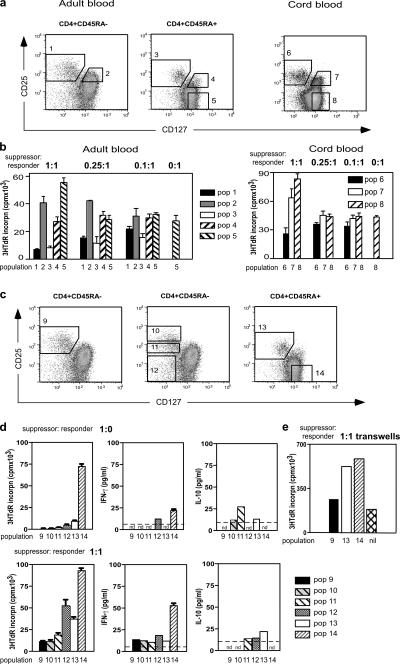
Abnormalities in CD4+CD25+Foxp3+ regulatory T (T reg) cells have been implicated in susceptibility to allergic, autoimmune, and immunoinflammatory conditions. However, phenotypic and functional assessment of human T reg cells has been hampered by difficulty in distinguishing between CD25-expressing activated and regulatory T cells. Here, we show that expression of CD127, the α chain of the interleukin-7 receptor, allows an unambiguous flow cytometry–based distinction to be made between CD127lo T reg cells and CD127hi conventional T cells within the CD25+CD45RO+RA− effector/memory and CD45RA+RO− naive compartments in peripheral blood and lymph node. In healthy volunteers, peripheral blood CD25+CD127lo cells comprised 6.35 ± 0.26% of CD4+ T cells, of which 2.05 ± 0.14% expressed the naive subset marker CD45RA. Expression of FoxP3 protein and the CD127lo phenotype were highly correlated within the CD4+CD25+ population. Moreover, both effector/memory and naive CD25+CD127lo cells manifested suppressive activity in vitro, whereas CD25+CD127hi cells did not. Cell surface expression of CD127 therefore allows accurate estimation of T reg cell numbers and isolation of pure populations for in vitro studies and should contribute to our understanding of regulatory abnormalities in immunopathic diseases.
Overview
The claims and statistics of this paper haven’t been checked yet.
Run the check — free, no account needed. It reads the open-access text and checks the sources it cites.
Integrity signals
Registry
Cites
Statistics
Figures
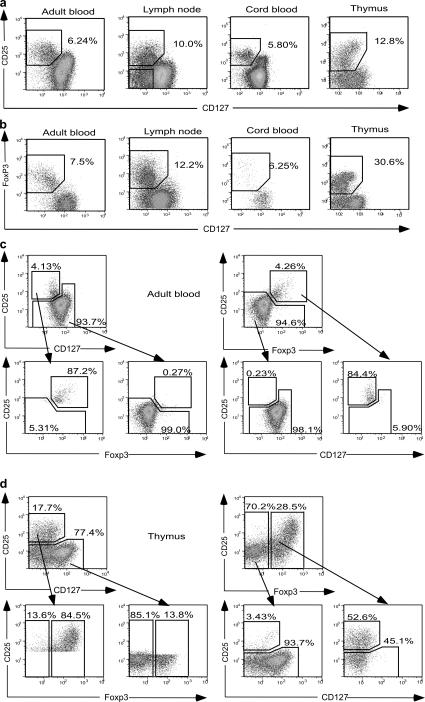
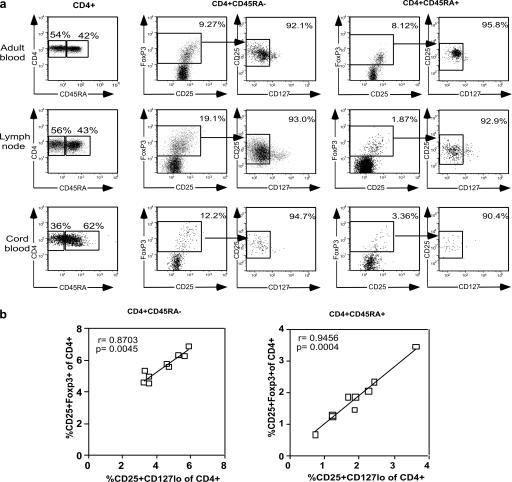
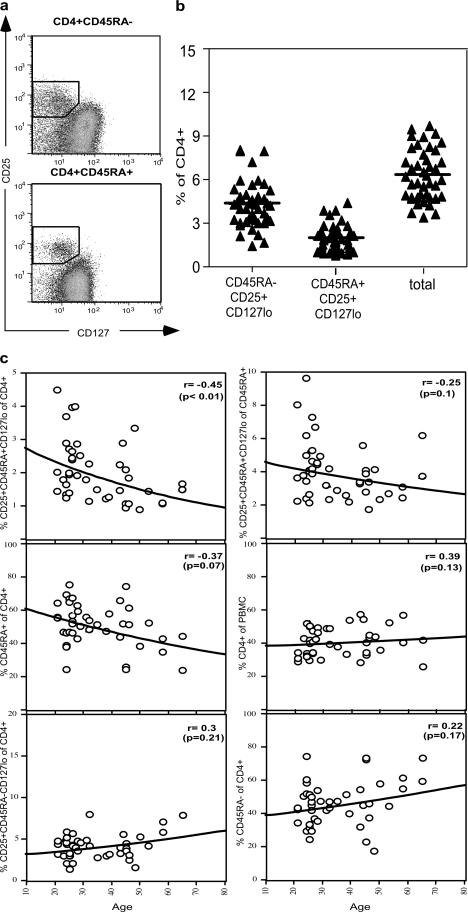
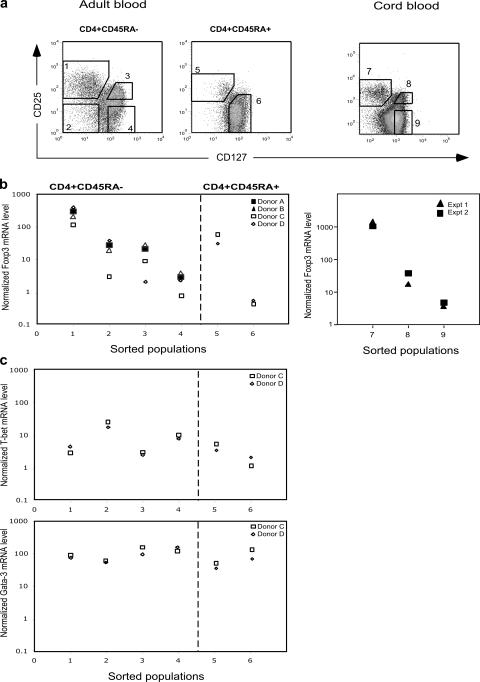
Verification
Claims the paper makes
The claims and statistics of this paper haven’t been checked yet.
Run the check — free, no account needed. It reads the open-access text and checks the sources it cites.
Claims other papers make about this one
Each is checked against this paper’s own text: does it say what the citing paper says it does?
The source backs part of the claim, not all of it — or backs it for a different population, condition or comparison.
In the citing paper
“In terms of surface phenotype, the best accepted combination of markers is high expression of the IL-2 receptor α chain (CD25) and low expression of the IL-7R α chain (CD127) [134, 385].”
From Guidelines for the use of flow cytometry and cell sorting in immunological studies (third edition) (2021) · cites this paper as [385]
Experimental — accuracy not yet measured
Self-check
Percentages, sums and reported differences re-computed from the paper’s own numbers.
The self-check needs the paper’s full text.
Citations
Cites
Sakaguchi, S. (2003) · Annual Review of Immunology · doi:10.1146/annurev.immunol.21.120601.141122 · Cited by 3,315
CD4+CD25high Regulatory Cells in Human Peripheral Blood
Baecher‐Allan, C., Brown, J. A., Freeman, G. J., & Hafler, D. A. (2001) · The Journal of Immunology · doi:10.4049/jimmunol.167.3.1245 · Cited by 1,889
Loss of Functional Suppression by CD4+CD25+ Regulatory T Cells in Patients with Multiple Sclerosis
Viglietta, V., Baecher‐Allan, C., Weiner, H. L., & Hafler, D. A. (2004) · The Journal of Experimental Medicine · doi:10.1084/jem.20031579 · Cited by 1,858
Ulcerative colitis-like disease in mice with a disrupted interleukin-2 gene
Sadlack, B., Merz, H., Schorle, H., Schimpl, A., Feller, A. C., & Horak, I. D. (1993) · Cell · doi:10.1016/0092-8674(93)80067-o · Cited by 1,744
Lymphopenia in interleukin (IL)-7 gene-deleted mice identifies IL-7 as a nonredundant cytokine
von Freeden-Jeffry, U., Vieira, P., Lucian, L., McNeil, T., Burdach, S. E. G., & Murray, R. (1995) · Journal of Experimental Medicine · doi:10.1084/jem.181.4.1519 · Cited by 1,648
Compromised Function of Regulatory T Cells in Rheumatoid Arthritis and Reversal by Anti-TNFα Therapy
Ehrenstein, M. R., Evans, J. G., Singh, A., Moore, S., Warnes, G., Isenberg, D. A., & Mauri, C. (2004) · The Journal of Experimental Medicine · doi:10.1084/jem.20040165 · Cited by 1,253
Ling, E. M., Smith, T. R. F., Nguyen, X. D., Pridgeon, C., Dallman, M. J., Arbery, J., Carr, V. A., & Robinson, D. S. (2004) · The Lancet · doi:10.1016/s0140-6736(04)15592-x · Cited by 759
Homeostasis and anergy of CD4+CD25+ suppressor T cells in vivo
Gavin, M. A., Clarke, S. R. M., Negrou, E., Gallegos, A. M., & Rudensky, A. Y. (2001) · Nature Immunology · doi:10.1038/ni743 · Cited by 643
Multiple immuno-regulatory defects in type-1 diabetes
Kukreja, A., Cost, G., Marker, J., Zhang, C., Sun, Z., Lin‐Su, K., Ten, S., Sanz, M. M., Exley, M. A., Wilson, B., et al. (2002) · Journal of Clinical Investigation · doi:10.1172/jci13605 · Cited by 640
Analysis of FOXP3 protein expression in human CD4+CD25+ regulatory T cells at the single-cell level
Roncador, G., Brown, P. J., Maestre, L., Hüe, S., Martinez-Torrecuadrada, J. L., Ling, K., Pratap, S., Toms, C., Fox, B. C., Cerundolo, V., et al. (2005) · European Journal of Immunology · doi:10.1002/eji.200526189 · Cited by 592
Research works printed but not linked: 1
- 2005, Hum. Immunol., 66, 13
Cited by
Sorted by citations
Vignali, D. A. A., Collison, L. W., & Workman, C. J. (2008) · Nature Reviews Immunology · doi:10.1038/nri2343 · Cited by 3,463
FOXP3+ regulatory T cells in the human immune system
Sakaguchi, S., Miyara, M., Costantino, C. M., & Hafler, D. A. (2010) · Nature reviews. Immunology · doi:10.1038/nri2785 · Cited by 2,524
Miyara, M., Yoshioka, Y., Kitoh, A., Shima, T., Wing, K., Niwa, A., Parizot, C., Taflin, C., Heike, T., Valeyre, D., et al. (2009) · Immunity · doi:10.1016/j.immuni.2009.03.019 · Cited by 2,291
“III (CD45RA Foxp3 cells) to suppress was confirmed by using CD127 as an additional marker for purifying FoxP3-expressing cells from CD4 T cells (Figure S5; Liu et al., 2006; Seddiki et al., 2006).”
BackgroundMethodInfluentialThe PD‐1 pathway in tolerance and autoimmunity
Francisco, L. M., Sage, P. T., & Sharpe, A. H. (2010) · Immunological Reviews · doi:10.1111/j.1600-065x.2010.00923.x · Cited by 2,300
“represented a more pure population of regulatory cells that were more suppressive than their CD4CD25CD127 counterparts (158, 160).”
BackgroundRegulatory T cells in cancer immunosuppression — implications for anticancer therapy
Togashi, Y., Shitara, K., & Nishikawa, H. (2019) · Nature Reviews Clinical Oncology · doi:10.1038/s41571-019-0175-7 · Cited by 1,620
Cancer Research Communications
Calura, E., Fruscio, R., Paracchini, L., Bignotti, E., Martini, P., Sales, G., Beltrame, L., Clivio, L., Ceppi, L., Di Marino, M., et al. (2021) · doi:10.1158/1078-0432 · Cited by 1,537
Interleukin-2 and Regulatory T Cells in Graft-versus-Host Disease
Koreth, J., Matsuoka, K., Kim, H. T., McDonough, S. M., Bindra, B., Alyea, E. P., Armand, P. A., Cutler, C. S., Ho, V. T., Treister, N. S., et al. (2011) · New England Journal of Medicine · doi:10.1056/nejmoa1108188 · Cited by 1,118
New insights into the regulation of T cells by γc family cytokines
Rochman, Y., Spolski, R. J., & Leonard, W. J. (2009) · Nature reviews. Immunology · doi:10.1038/nri2580 · Cited by 1,082
“Similarly, most human CD4 + CD25 + FOXP3 + T Reg cells have lower levels of IL-7Rα expression than do CD4 + CD25 + FOXP3 − T cell”
Guidelines for the use of flow cytometry and cell sorting in immunological studies (second edition)
Cossarizza, A., Chang, H., Radbruch, A., Acs, A., Adam, D., Adam‐Klages, S., Agace, W. W., Aghaeepour, N., Akdiş, M., Allez, M., et al. (2019) · European Journal of Immunology · doi:10.1002/eji.201970107 · Cited by 1,007
Allan, S. E., Crome, S. Q., Crellin, N. K., Passerini, L., Steiner, T. S., Bacchetta, R., Roncarolo, M. G., & Levings, M. K. (2007) · International Immunology · doi:10.1093/intimm/dxm014 · Cited by 872
“Recently, it was reported that human nTregs can be distinguished from Teff cells on the basis of low CD127 (IL-7Ra) expression (26, 27 ), possibly due to the capacity of FOXP3 to interact with and repress the CD127 promoter (26).”
BackgroundDistribution and compartmentalization of human circulating and tissue-resident memory T cell subsets
Sathaliyawala, T., Kubota, M., Yudanin, N., Turner, D., Camp, P., Thome, J. J. C., Bickham, K. L., Lerner, H., Goldstein, M., Sykes, M., et al. (2013) · Immunity · doi:10.1016/j.immuni.2012.09.020 · Cited by 848
“CD69 memory T cells in lymphoid and mucosal sites were largely IL-7R (Figure 4B), indicative of a resting memory T cell phenotype, as IL-7R is downregulated on activated effector T cells (Dooms et al., 2007; Kaech et al., 2003; Paiardini et al., 2005; Seddiki et al., 2006).”
Gruver, A., Hudson, L., & Sempowski, G. (2007) · The Journal of Pathology · doi:10.1002/path.2104 · Cited by 834
“Recently, the observation that the IL-7 receptor (CD127) is not expressed on Foxp3+ cells and a subset of CD4+, CD25+, CD127 cells are suppressive, but CD127 cells are not, indicates that this may be a useful staining protocol to identify live Tregs in functional assays [115,116].”
BackgroundA Homozygous CARD9 Mutation in a Family with Susceptibility to Fungal Infections
Glocker, E.-O., Hennigs, A., Nabavi, M., Schäffer, A. A., Woellner, C., Salzer, U., Pfeifer, D., Veelken, H., Warnatz, K., Tahami, F., et al. (2009) · New England Journal of Medicine · doi:10.1056/nejmoa0810719 · Cited by 800
Walter, S., Weinschenk, T., Stenzl, A., Zdrojowy, R., Pluzanska, A., Szczylik, C. A., Staehler, M. D., Brugger, W., Dietrich, P.-Y., Mendrzyk, R., et al. (2012) · Nature Medicine · doi:10.1038/nm.2883 · Cited by 788
Tran, D. Q., Ramsey, H. E., & Shevach, E. M. (2007) · Blood · doi:10.1182/blood-2007-06-094656 · Cited by 738
Human CD25highFoxp3pos regulatory T cells differentiate into IL-17–producing cells
Koenen, H. J. P. M., Smeets, R. L., Vink, P. M., van Rijssen, E., Boots, A. M. H., & Joosten, I. (2008) · Blood · doi:10.1182/blood-2008-01-133967 · Cited by 756
Battaglia, M., Stabilini, A., Migliavacca, B., Horejs‐Hoeck, J., Kaupper, T., & Roncarolo, M. (2006) · The Journal of Immunology · doi:10.4049/jimmunol.177.12.8338 · Cited by 746
“Overall, these data indicate that there is no reduced frequency of CD4 CD25 FOXP3 Tregs in T1D subjects.”
BackgroundInfluentialHuman FOXP3+ Regulatory T Cell Heterogeneity and Function in Autoimmunity and Cancer
Wing, J. B., Tanaka, A., & Sakaguchi, S. (2019) · Immunity · doi:10.1016/j.immuni.2019.01.020 · Cited by 726
Natural regulatory T cells: mechanisms of suppression
Miyara, M., & Sakaguchi, S. (2007) · Trends in Molecular Medicine · doi:10.1016/j.molmed.2007.01.003 · Cited by 726
Treatment strategies for allergy and asthma
Holgate, S. T., & Polosa, R. (2008) · Nature reviews. Immunology · doi:10.1038/nri2262 · Cited by 713
Trzonkowski, P., Bieniaszewska, M., Juścińska, J., Dobyszuk, A., Krzystyniak, A., Marek-Trzonkowska, N. M., Myśliwska, J. M., & Hellmann, A. R. (2009) · Clinical Immunology · doi:10.1016/j.clim.2009.06.001 · Cited by 683
Deficiency of Th17 cells in hyper IgE syndrome due to mutations in STAT3
Ma, C. S., Chew, G. Y. J., Simpson, N., Priyadarshi, A., Wong, M., Grimbacher, B., Fulcher, D. A., Tangye, S. G., & Cook, M. C. (2008) · The Journal of Experimental Medicine · doi:10.1084/jem.20080218 · Cited by 652
How do Regulatory T Cells Work?
Corthay, A. (2009) · Scandinavian Journal of Immunology · doi:10.1111/j.1365-3083.2009.02308.x · Cited by 691
Romano, E., Kusio-Kobialka, M., Foukas, P. G., Baumgaertner, P., Meyer, C., Ballabeni, P., Michielin, O., Weide, B., Romero, P., & Speiser, D. E. (2015) · Proceedings of the National Academy of Sciences · doi:10.1073/pnas.1417320112 · Cited by 601
“Sex Male 21 (72) Female 8 (28) ECOG performance status 0 17 (59) 1 12 (41) M stage M1a 2 (7) M1b 6 (21) M1c 21 (72) Prior lines of systemic therapy for metastatic disease 1 28 (97) 2 1 (3) Ipilimumab cycles 4 23 (79) 3 3 (10) 2 3 (10) 1 0”
Gabitass, R. F., Annels, N. E., Stocken, D. D., Pandha, H., & Middleton, G. (2011) · Cancer Immunology Immunotherapy · doi:10.1007/s00262-011-1028-0 · Cited by 574
“periphery [3‐5]. Intracellular expression of the forkhead box protein 3 transcription factor (FoxP3) and low expression of the IL-7 receptor, CD127, are further characteristics of suppressive Tregs [1, 6 ].”
BackgroundHe, J., Zhang, X., Wei, Y., Sun, X., Chen, Y., Deng, J., Jin, Y., Gan, Y., Hu, X., Jia, R., et al. (2016) · Nature Medicine · doi:10.1038/nm.4148 · Cited by 579
Harnessing the biology of IL-7 for therapeutic application
Mackall, C. L., Fry, T. J., & Gress, R. E. (2011) · Nature reviews. Immunology · doi:10.1038/nri2970 · Cited by 602
“IL-7Rα expression is notably low on FOXP3 + T Reg cells compared with non-regulatory T cell subsets, such that cells with a CD4 + CD25 hi IL-7Rα low phenotype are highly enriched for T Reg cell”
BackgroundTwo Functional Subsets of FOXP3+ Regulatory T Cells in Human Thymus and Periphery
Ito, T., Hanabuchi, S., Wang, Y.-H., Park, W. R., Arima, K., Bover, L. C., Qin, F. X.-F., Gilliet, M. F., & Liu, Y. (2008) · Immunity · doi:10.1016/j.immuni.2008.03.018 · Cited by 565
“Recent studies have shown that there are at least two populations of FOXP3+ Treg cells in human adult blood, one with CD45RA+ naive phenotype and one with CD45RO+ memory phenotype (Seddiki et al., 2006b; Valmori et al., 2005).”
BackgroundGuidelines for the use of flow cytometry and cell sorting in immunological studies (third edition)
Cossarizza, A., Chang, H., Radbruch, A., Abrignani, S., Addo, R., Akdis, M., Andrä, I., Andreata, F., Annunziato, F., Arranz, E., et al. (2021) · European Journal of Immunology · doi:10.1002/eji.202170126 · Cited by 531
Kaufmann, D., Kavanagh, D. G., Pereyra, F., Zaunders, J., Mackey, E. W., Miura, T., Palmer, S., Brockman, M. A., Rathod, A., Trocha, A. K., et al. (2007) · Nature Immunology · doi:10.1038/ni1515 · Cited by 523
“4e,f ; the CD25 hi CD127 lo phenotype reliably identifies T reg cell”
BackgroundSelf-citationRoles of regulatory T cells in cancer immunity
Takeuchi, Y., & Nishikawa, H. (2016) · International Immunology · doi:10.1093/intimm/dxw025 · Cited by 533
“Although CD4 CD25 T cells with additional low level expression of CD127 (the α-chain of the IL-7 receptor) were reported to possess FoxP3 expression and suppressive function [45,46], CD127 is also down-regulated following recent activation of naive T cells that also express low level of FoxP3 [47], suggesting possible…”
BackgroundImmunobiology of Allogeneic Hematopoietic Stem Cell Transplantation
Welniak, L. A., Blazar, B. R., & Murphy, W. J. (2006) · Annual Review of Immunology · doi:10.1146/annurev.immunol.25.022106.141606 · Cited by 535
Regulatory T-cell immunotherapy for tolerance to self antigens and alloantigens in humans
Roncarolo, M., & Battaglia, M. (2007) · Nature reviews. Immunology · doi:10.1038/nri2138 · Cited by 521
Regulatory T cell development in the absence of functional Foxp3
Lin, W. X., Haribhai, D., Relland, L. M., Truong, N., Carlson, M. R. J., Williams, C. B., & Chatila, T. A. (2007) · Nature Immunology · doi:10.1038/ni1445 · Cited by 485
“Expression of CD127 (interleukin 7 (IL-7) receptor-α), reported to be lower in peripheral T reg cell”
BackgroundIL-17–producing human peripheral regulatory T cells retain suppressive function
Bériou, G., Costantino, C. M., Ashley, C. W., Yang, L., Kuchroo, V. K., Baecher‐Allan, C., & Hafler, D. A. (2009) · Blood · doi:10.1182/blood-2008-10-183251 · Cited by 501
Next-generation regulatory T cell therapy
Ferreira, L. M. R., Müller, Y. D., Bluestone, J. A., & Tang, Q. (2019) · Nature Reviews Drug Discovery · doi:10.1038/s41573-019-0041-4 · Cited by 491
Sportès, C., Hakim, F. T., Memon, S. A., Zhang, H., Chua, K., Brown, M. R., Fleisher, T. A., Krumlauf, M., Babb, R. R., Chow, C. K., et al. (2008) · The Journal of Experimental Medicine · doi:10.1084/jem.20071681 · Cited by 476
CD39+Foxp3+ Regulatory T Cells Suppress Pathogenic Th17 Cells and Are Impaired in Multiple Sclerosis
Fletcher, J. M., Lonergan, R. M., Costelloe, L., Kinsella, K., Moran, B., O’Farrelly, C., Tubridy, N. J., & Mills, K. H. G. (2009) · The Journal of Immunology · doi:10.4049/jimmunol.0901881 · Cited by 476
Santner‐Nanan, B., Peek, M. J., Khanam, R., Richarts, L., Zhu, E., Groth, B. F. D. S., & Nanan, R. K. H. (2009) · The Journal of Immunology · doi:10.4049/jimmunol.0901154 · Cited by 469
“We used a flow-sorting strategy based on our recently described CD4 CD127CD25 marker combination (23) to isolate 98% pure viable Treg cells from healthy pregnant, preeclamptic, and nonpregnant women.”
BackgroundMethodInfluentialSelf-citationPD-1 Blockade Expands Intratumoral Memory T Cells
Ribas, A., Shin, D. S., Zaretsky, J., Frederiksen, J., Cornish, A., Avramis, E., Seja, E., Kivork, C., Siebert, J., Kaplan-Lefko, P., et al. (2016) · Cancer Immunology Research · doi:10.1158/2326-6066.cir-15-0210 · Cited by 405
“Tregs were defined by the phenotype of CD45þCD3þCD4þCD25High CD127Low (22); the proportion of Tregs changed little on treatment (Fig.”
BackgroundInfluentialLages, C. S., Suffia, I., Velilla, P. A., Huang, B., Warshaw, G., Hildeman, D. A., Belkaid, Y., & Chougnet, C. (2008) · The Journal of Immunology · doi:10.4049/jimmunol.181.3.1835 · Cited by 399
“ceptor CD127 increases the specificity of Treg characterization for human cells (50, 51).”
BackgroundGoodyear, O. C., Dennis, M., Jilani, N., Loke, J. C. T., Siddique, S., Ryan, G. B., Nunnick, J., Khanum, R., Raghavan, M., Cook, M. A., et al. (2012) · Blood · doi:10.1182/blood-2011-09-377044 · Cited by 400
Role of Treg in immune regulation of allergic diseases
Palomares, Ó., Yaman, G., Azkur, A. K., Akkoç, T., Akdiş, M., & Akdiş, C. A. (2010) · European Journal of Immunology · doi:10.1002/eji.200940045 · Cited by 402
Mougiakakos, D., Choudhury, A., Lladser, Á., Kiessling, R. W., & Johansson, C. C. (2010) · Advances in cancer research · doi:10.1016/s0065-230x(10)07003-x · Cited by 413
Wang, W., Hao, C.-F., Yilin, Yin, G., Bao, S., Qiu, L., & Lin, Q. (2010) · Journal of Reproductive Immunology · doi:10.1016/j.jri.2009.12.003 · Cited by 386
Human regulatory T cells: role in autoimmune disease and therapeutic opportunities
Brusko, T. M., Putnam, A. L., & Bluestone, J. A. (2008) · Immunological Reviews · doi:10.1111/j.1600-065x.2008.00637.x · Cited by 379
“This approach was based on the observation that CD127 is inversely correlated with FOXP3 expression in humans (47, 48).”
BackgroundCamisaschi, C., Casati, C., Rini, F., Perego, M., De Filippo, A., Triebel, F., Parmiani, G., Belli, F., Rivoltini, L., & Castelli, C. (2010) · The Journal of Immunology · doi:10.4049/jimmunol.0903879 · Cited by 350
“This same set of markers, together with a low expression level of CD127 (6, 7), also identifies human natural Treg cells.”
BackgroundHoffmann, P., Boeld, T. J., Eder, R., Huehn, J., Floess, S., Wieczorek, G., Olek, S., Dietmaier, W., Andreesen, R., & Edinger, M. (2009) · European Journal of Immunology · doi:10.1002/eji.200838904 · Cited by 356
Regulatory T cells and immune regulation of allergic diseases: roles of IL-10 and TGF-β
Palomares, Ó., Martín‐Fontecha, M., Lauener, R. P., Traidl‐Hoffmann, C., Cavkaytar, Ö., Akdis, M., & Akdiş, C. A. (2014) · Genes and Immunity · doi:10.1038/gene.2014.45 · Cited by 360
IL-7 administration drives T cell–cycle entry and expansion in HIV-1 infection
Sereti, I., Dunham, R. M., Spritzler, J., Aga, E., Proschan, M. A., Medvik, K., Battaglia, C. A., LANDAY, A. L., Pahwa, S. G., Fischl, M. A., et al. (2009) · Blood · doi:10.1182/blood-2008-10-186601 · Cited by 357
Self-citationHuman FoxP3+ regulatory T cells in systemic autoimmune diseases
Miyara, M., Gorochov, G., Ehrenstein, M. R., Musset, L., Sakaguchi, S., & Amoura, Z. (2011) · Autoimmunity Reviews · doi:10.1016/j.autrev.2011.05.004 · Cited by 359
Transient regulatory T-cells: A state attained by all activated human T-cells
Pillai, V., Ortega, S. B., Wang, C. K., & Karandikar, N. J. (2006) · Clinical Immunology · doi:10.1016/j.clim.2006.10.014 · Cited by 344
“It has been recently shown that low CD127 (IL-7 receptor) expression may be a specific marker for natural FOXP3+ Tregs [17;36].”
BackgroundInfluentialFrom IPEX syndrome to FOXP3 mutation: a lesson on immune dysregulation
Bacchetta, R., Barzaghi, F., & Roncarolo, M. (2016) · Annals of the New York Academy of Sciences · doi:10.1111/nyas.13011 · Cited by 346
Mechanisms of immune regulation in allergic diseases: the role of regulatory T and B cells
Palomares, Ó., Akdis, M., Martín‐Fontecha, M., & Akdiş, C. A. (2017) · Immunological Reviews · doi:10.1111/imr.12555 · Cited by 346
Wang, H. Y., & Wang, R. (2007) · Current Opinion in Immunology · doi:10.1016/j.coi.2007.02.004 · Cited by 329
CD4+ Regulatory and Effector/Memory T Cell Subsets Profile Motor Dysfunction in Parkinson’s Disease
Hutter-Saunders, J. A. L., Estes, K. A., Kosloski, L. M., Allen, H. E., Dempsey, K., Torres‐Russotto, D. R., Meza, J. L., Santamaria, P. M., Bertoni, J. M., Murman, D. L., et al. (2012) · Journal of Neuroimmune Pharmacology · doi:10.1007/s11481-012-9402-z · Cited by 339
“Naïve T cells were identified as CD4+CD25-CD127+, Treg were identified as CD4+CD25+CD127- and Teff were identified as CD4+CD25+CD127+, as expression of the alpha-chain of the IL-7 receptor, CD127, is inversely correlated with expression of FoxP3 and CD4+CD25+CD127-/low Treg are hypo-proliferative and suppressive (Liu…”
Venet, F., Chung, C., Kherouf, H., Geeraert, A., Malcus, C., Poitevin, F., Bohé, J., Lepape, A., Ayala, A., & Monneret, G. (2008) · Intensive Care Medicine · doi:10.1007/s00134-008-1337-8 · Cited by 320
“To investigate this, the whole blood percentage of Treg (assessed by using a newly described and reproducible gating strategy based on the CD4, CD25, CD127 and FOXP3 flow cytometric measurement [15,16]) was correlated with the proliferative response of mononuclear cells purified from septic shock patients after mitoge…”
MethodMesenchymal cells recruit and regulate T regulatory cells
Ianni, M. D., Papa, B. D., Ioanni, M. D., Moretti, L., Bonifacio, E., Cecchini, D., Sportoletti, P., Falzetti, F., & Tabilio, A. (2008) · Experimental Hematology · doi:10.1016/j.exphem.2007.11.007 · Cited by 315
Thome, J. J. C., Bickham, K. L., Ohmura, Y., Kubota, M., Matsuoka, N., Gordon, C., Granot, T., Griesemer, A., Lerner, H., Kato, T., et al. (2016) · Nature Medicine · doi:10.1038/nm.4008 · Cited by 305
“Quantitation of T reg cells based on gating of CD25 + CD127 − FOXP3 + CD4 + T cells 24,25 (Fig.”
CD4+FOXP3+ T Regulatory Cells in Human Autoimmunity: More Than a Numbers Game
Long, S. A., & Buckner, J. H. (2011) · The Journal of Immunology · doi:10.4049/jimmunol.1003224 · Cited by 298
“Low expression of CD127 on CD4CD25 cells can more precisely identify stable FOXP3 Treg in control subjects (60, 61).”
BackgroundAyyoub, M., Deknuydt, F., Raimbaud, I., Dousset, C., Leveque, L., Bioley, G., & Valmori, D. (2009) · Proceedings of the National Academy of Sciences · doi:10.1073/pnas.0900621106 · Cited by 301
In vivo prevention of transplant arteriosclerosis by ex vivo–expanded human regulatory T cells
Nadig, S. N., Więckiewicz, J., Wu, D. C., Warnecke, G., Zhang, W., Luo, S., Șchiopu, A., Taggart, D. P., & Wood, K. J. (2010) · Nature Medicine · doi:10.1038/nm.2154 · Cited by 292
“The recent observation of the inverse correlation between the IL-7 Rα (CD127) subunit and the suppressive capacity of CD25hiCD4+ Treg cells allows for an additional potential target to isolate and expand cells with increased suppressive function ex vivo[19-21].”
BackgroundRegulatory T-cells in autoimmune diseases: Challenges, controversies and—yet—unanswered questions
Grant, C. R., Liberal, R., Mieli‐Vergani, G., Vergani, D., & Longhi, M. S. (2014) · Autoimmunity Reviews · doi:10.1016/j.autrev.2014.10.012 · Cited by 292
“In the CD4 pos CD25 high population, CD127 expression is inversely correlated with suppressive function [42-44].”
BackgroundGeneration and persistence of human tissue-resident memory T cells in lung transplantation
Snyder, M. E., Finlayson, M. O., Connors, T. J., Dogra, P., Senda, T., Bush, E. C., Carpenter, D. J., Marboe, C. C., Benvenuto, L. J., Shah, L., et al. (2019) · Science Immunology · doi:10.1126/sciimmunol.aav5581 · Cited by 285
Human natural Treg microRNA signature: Role of microRNA‐31 and microRNA‐21 in FOXP3 expression
Rouas, R., Fayyad‐Kazan, H., Zein, N. E., Lewalle, P., Rothé, F., Simion, A., Akl, H., Mourtada, M., Rifai, M. E., Burny, A., et al. (2009) · European Journal of Immunology · doi:10.1002/eji.200838509 · Cited by 287
Mjösberg, J., Berg, G. E., Jenmalm, M. C., & Ernerudh, J. (2009) · Biology of Reproduction · doi:10.1095/biolreprod.109.081208 · Cited by 281
“CD127 has been proposed a surrogate surface marker for FOXP3 because these two proteins are inversely correlated, FOXP3 cells being CD127 [26, 27].”
BackgroundSmolders, J., Thewissen, M. M., Peelen, E., Menheere, P. P. C. A., Tervaert, J. W. C., Damoiseaux, J. G. M. C., & Hupperts, R. (2009) · PLoS ONE · doi:10.1371/journal.pone.0006635 · Cited by 270
“Human CD4CD25CD127(2) Tregs [23,24] and CD4CD25(2) responder T cells (Tresps) were sorted on a FacsAria (BD Biosciences) cell sorter (Figure 1A).”
BackgroundMethodInfluentialOutcomes of acute leukemia patients transplanted with naive T cell–depleted stem cell grafts
Bleakley, M., Heimfeld, S., Loeb, K. R., Jones, L. A., Chaney, C. N., Seropian, S., Gooley, T. A., Sommermeyer, F., Riddell, S. R., & Shlomchik, W. D. (2015) · Journal of Clinical Investigation · doi:10.1172/jci81229 · Cited by 268
Differentiation and function of Foxp3+ effector regulatory T cells
Cretney, E., Kallies, A., & Nutt, S. L. (2012) · Trends in Immunology · doi:10.1016/j.it.2012.11.002 · Cited by 273
Immunosuppressive CD14 + HLA‐DR low/− monocytes in prostate cancer
Vuk‐Pavlović, S., Bulur, P. A., Lin, Y., Qin, R., Szumlanski, C. L., Zhao, X., & Dietz, A. B. (2009) · The Prostate · doi:10.1002/pros.21078 · Cited by 265
Chung, D. J., Rossi, M., Romano, E., Ghith, J., Yuan, J. D., Munn, D. H., & Young, J. W. (2009) · Blood · doi:10.1182/blood-2008-11-191197 · Cited by 270
Acute graft-versus-host disease: from the bench to the bedside
Socié, G., & Blazar, B. R. (2009) · Blood · doi:10.1182/blood-2009-06-204669 · Cited by 268
Vang, K. B., Yang, J., Mahmud, S. A., Burchill, M. A., Vegoe, A. L., & Farrar, M. A. (2008) · The Journal of Immunology · doi:10.4049/jimmunol.181.5.3285 · Cited by 262
“Finally, these findings also have implications for the use of low-level IL-7R expression to identify Tregs (24, 25) as this receptor may be upregulated under conditions of limited IL-2 availability.”
Venken, K., Hellings, N., Broekmans, T., Hensen, K., Rummens, J., & Stinissen, P. (2008) · The Journal of Immunology · doi:10.4049/jimmunol.180.9.6411 · Cited by 272
“IL-7 receptor -chain (CD127) at their cell surface (8, 9).”
BackgroundResultInfluentialCouper, K. N., Blount, D. G., Wilson, M. S., Hafalla, J. C. R., Belkaid, Y., Kamanaka, M., Flavell, R. A., de Souza, J. B., & Riley, E. M. (2008) · PLoS Pathogens · doi:10.1371/journal.ppat.1000004 · Cited by 262
“Although it has been observed in humans [47,48] and mice [48] that CD127 is down-regulated on endogenous (Foxp3) regulatory T cells, our data demonstrate – for the first time - that CD127 is also down-regulated on adaptive (Foxp3(2)) Tr1 cells.”
BackgroundHodge, S. J., Hodge, G. L., Jersmann, H. P. A., Matthews, G. M., Ahern, J., Holmes, M., & Reynolds, P. N. (2008) · American Journal of Respiratory and Critical Care Medicine · doi:10.1164/rccm.200711-1666oc · Cited by 258
“Enumeration of Tregs (CD31CD251CD1272) ( 19 ), Th1 (CD31CD62L2CD45RO1) (20), and cytotoxic (CD81CD281) and activated T cells (CD31CD251) was performed on samples of blood, brush (intraepithelial T cells), and BAL.”
BackgroundHuman fetal dendritic cells promote prenatal T-cell immune suppression through arginase-2
McGovern, N. N., Shin, A., Low, G., Low, D., Duan, K., Yao, L. J., Msallam, R., Low, I., Shadan, N. B., Sumatoh, H., et al. (2017) · Nature · doi:10.1038/nature22795 · Cited by 253
Bracci, L., Moschella, F., Sestili, P., Sorsa, V. L., Valentini, M., Canini, I., Baccarini, S., Maccari, S., Ramoni, C., Belardelli, F., et al. (2007) · Clinical Cancer Research · doi:10.1158/1078-0432.ccr-06-1209 · Cited by 257
No Alterations in the Frequency of FOXP3+ Regulatory T-Cells in Type 1 Diabetes
Brusko, T. M., Wasserfall, C. H., MCGRAIL, K. M., Schatz, R., Viener, H. L., Schatz, D., Haller, M. J., Rockell, J., Gottlieb, P. A., Clare-Salzler, M. J., et al. (2007) · Diabetes · doi:10.2337/db06-1248 · Cited by 253
“The surface marker CD127 (IL-7 receptor -chain) appears to be expressed at the highest levels on effector T-cells, whereas functional Tregs are CD127 or negative (17,18).”
BackgroundGraft-versus-Host Disease — From the Bench to the Bedside?
Socié, G. (2005) · New England Journal of Medicine · doi:10.1056/nejme058175 · Cited by 251
Role of regulatory T cells and FOXP3 in human diseases
Bacchetta, R., Gambineri, E., & Roncarolo, M. (2007) · Journal of Allergy and Clinical Immunology · doi:10.1016/j.jaci.2007.06.023 · Cited by 260
Shreffler, W. G., Wanich, N., Moloney, M., Nowak-Wegrzyn, A. H., & Sampson, H. A. (2009) · Journal of Allergy and Clinical Immunology · doi:10.1016/j.jaci.2008.09.051 · Cited by 247
“VOLUME 123, NUMBER 1 SHREFFLER ET AL 49 Allergen-specific Treg cells are CD251CD271 cytotoxic T lymphocyte–associated antigen 41 CD45RO1 We next characterized the phenotype of FoxP3-expressing cells from a subset of subjects for expression of other reported markers of the CD41CD251 Treg cells, including those known to…”
BackgroundTherapeutic targeting of regulatory T cells in cancer
Shan, F., Somasundaram, A., Bruno, T. C., Workman, C. J., & Vignali, D. A. A. (2022) · Trends in cancer · doi:10.1016/j.trecan.2022.06.008 · Cited by 255
Matsuoka, K., Kim, H. T., McDonough, S. M., Bascug, G., Warshauer, B., Koreth, J., Cutler, C. S., Ho, V. T., Alyea, E. P., Antin, J. H., et al. (2010) · Journal of Clinical Investigation · doi:10.1172/jci41072 · Cited by 249
Clark, R. A., Huang, S. J., Murphy, G. F., Mollet, I. G., Hijnen, D., Muthukuru, M., SCHANBACHER, C. F., Edwards, V. L., Miller, D. M., Kim, J. E., et al. (2008) · The Journal of Experimental Medicine · doi:10.1084/jem.20071190 · Cited by 250
Regulatory T Cells: the Many Faces of Foxp3
Georgiev, P., Charbonnier, L., & Chatila, T. A. (2019) · Journal of Clinical Immunology · doi:10.1007/s10875-019-00684-7 · Cited by 253
“is > 90% Treg cells as confirmed by high FOXP3 expression and demethylation at the FOXP3 locus [34, 36, 37].”
BackgroundCD4+CD25+CD127low/− T Cells: A More Specific Treg Population in Human Peripheral Blood
Yu, N., Li, X., Song, W., Yu, D., Yu, D., Zeng, X., Li, M., Leng, X., & Li, X.-P. (2012) · Inflammation · doi:10.1007/s10753-012-9496-8 · Cited by 236
Allan, S. E., McMurchy, A. N., Mérindol, N., Crellin, N. K., Amendola, M., Bacchetta, R., Naldini, L., Roncarolo, M. G., Soudeyns, H., & Levings, M. K. (2007) · Molecular Therapy · doi:10.1038/sj.mt.6300341 · Cited by 233
Oo, Y. H., Weston, C. J., Lalor, P. F., Curbishley, S. M., Withers, D. R., Reynolds, G. M., Shetty, S., Harki, J., Shaw, J. C., Eksteen, B., et al. (2010) · The Journal of Immunology · doi:10.4049/jimmunol.0901216 · Cited by 232
“Liver and blood-derived Tregs were defined by the characteristic phenotype CD4CD25CD127FoxP3 (8, 9).”
BackgroundRegulatory T cells in autoimmune neuroinflammation
Kleinewietfeld, M., & Hafler, D. A. (2014) · Immunological Reviews · doi:10.1111/imr.12169 · Cited by 238
“We have demonstrated that the majority of human Tregs only express low levels of CD49d and that by depleting CD49+, in combination with CD127+ cells, the isolation of Tregs is achievable without the use of CD25.”
BackgroundInfluentialManches, O., Munn, D. H., Fallahi, A., Lifson, J. D., Chaperot, L., Plumas, J., & Bhardwaj, N. (2008) · Journal of Clinical Investigation · doi:10.1172/jci34823 · Cited by 247
Sportès, C., Babb, R. R., Krumlauf, M., Hakim, F. T., Steinberg, S. M., Chow, C. K., Brown, M. R., Fleisher, T. A., Noël, P., Marić, I., et al. (2010) · Clinical Cancer Research · doi:10.1158/1078-0432.ccr-09-1303 · Cited by 227
“Additionally, CD4/FoxP3 regulatory T cells showed markedly less proliferation, consistent with their low IL-7Rα-chain expression (36, 37), expanded less than”
BackgroundLi, S., Lefranc, M., Miles, J. J., Alamyar, E., Giudicelli, V., Duroux, P., Freeman, J., Corbin, V., Scheerlinck, J. Y., Frohman, M. A., et al. (2013) · Nature Communications · doi:10.1038/ncomms3333 · Cited by 225
The split personality of regulatory T cells in HIV infection
Chevalier, M. F., & Weiss, L. (2012) · Blood · doi:10.1182/blood-2012-07-409755 · Cited by 227
Treg cells in health and autoimmune diseases: New insights from single cell analysis
Scheinecker, C., Göschl, L., & Bonelli, M. M. (2019) · Journal of Autoimmunity · doi:10.1016/j.jaut.2019.102376 · Cited by 224
Brimnes, M. K., Vangsted, A. J., Knudsen, L. M., Gimsing, P., Gang, A. O., Johnsen, H. E., & Svane, I. M. (2010) · Scandinavian Journal of Immunology · doi:10.1111/j.1365-3083.2010.02463.x · Cited by 218
The dynamic co-evolution of memory and regulatory CD4+ T cells in the periphery
Akbar, A. N., Vukmanovic‐Stejic, M., Taams, L. S., & Macallan, D. C. (2007) · Nature reviews. Immunology · doi:10.1038/nri2037 · Cited by 215
TREG-cell therapies for autoimmune rheumatic diseases
Miyara, M., Ito, Y., & Sakaguchi, S. (2014) · Nature Reviews Rheumatology · doi:10.1038/nrrheum.2014.105 · Cited by 218
Regulatory T cell proliferative potential is impaired in human autoimmune disease
Carbone, F., Rosa, V. D., Carrieri, P. B., Montella, S., Bruzzese, D., Porcellini, A., Procaccini, C., Cava, A. L., & Matarese, G. (2013) · Nature Medicine · doi:10.1038/nm.3411 · Cited by 222
Santegoets, S. J. A. M., Dijkgraaf, E. M., Battaglia, A., Beckhove, P., Britten, C. M., Gallimore, A., Godkin, A. J., Gouttefangeas, C., de Gruijl, T. D., Koenen, H. J. P. M., et al. (2015) · Cancer Immunology Immunotherapy · doi:10.1007/s00262-015-1729-x · Cited by 213
Metadata
- Authors
- Seddiki, N., Santner-Nanan, B., Martinson, J., Zaunders, J., Sasson, S., Landay, A., Solomon, M., Selby, W., Alexander, S. I., Nanan, R., Kelleher, A., & de St. Groth, B. F.
- Affiliations
- The University of Sydney (AU)
- 4Department of Paediatrics, University of Sydney, Western Clinical School, Penrith, NSW 2751, Australia
- Rush University Medical Center (US)
- St Vincent's Hospital Sydney (AU)
- Royal Prince Alfred Hospital (AU)
- Children's Hospital at Westmead (AU)
- UNSW Sydney (AU)
- 1Centenary Institute of Cancer Medicine and Cell Biology, Faculty of Medicine, University of Sydney, Newtown, NSW 2042, Australia
- ORCID
- Venue
- The Journal of Experimental Medicine
- Publisher
- Rockefeller University Press
- Published
- 2006-07-03
- Volume
- 203
- Issue
- 7
- Pages
- 1693-1700
- ISSN
- 0022-1007 (ISSN-L)
- 1540-9538
- PMC
- PMC2118333
- OpenAlex
- W2168628806
- Cited by
- 1,512
- References
- 30
- Citations by year
- 2026: 18 · 2025: 25 · 2024: 32 · 2023: 32 · 2022: 44 · 2021: 49 · 2020: 58 · 2019: 75 · 2018: 51 · 2017: 64 · 2016: 74 · 2015: 63 · 2014: 87 · 2013: 92 · 2012: 116
- FWCI
- 45.91
- Type
- journal article
- Language
- en
- Open access
- bronze
- doi.org
- Locations
- The Journal of Experimental Medicine (publishedVersion)
- Europe PMC (PubMed Central) (publishedVersion, cc-by-nc-sa)
- PubMed Central (publishedVersion, cc-by-nc-sa)
- PubMed (publishedVersion)
- UNSWorks (University of New South Wales, Sydney, Australia) (submittedVersion, cc-by-nc-nd)
- Funders
- Crohn's and Colitis Foundation of America
- Crohn's and Colitis Foundation
- Medical Research Council
- National Health and Medical Research Council
- National Institute of Allergy and Infectious Diseases (P01AI055793, AI55793, U19AI055793)
- Topics
- Life Sciences › Immunology and Microbiology › Immunology › T-cell and B-cell Immunology
- Life Sciences › Immunology and Microbiology › Immunology › Psoriasis: Treatment and Pathogenesis
- Life Sciences › Immunology and Microbiology › Immunology › IL-33, ST2, and ILC Pathways
- Keywords
- regulatory T cells, CD127, interleukin-2 receptor, Foxp3, CD25, CD4+ T cells, naive T cells, effector memory T cells
- MeSH terms
- Adult, Humans, Infant, Newborn, Lymphocyte Activation, Receptors, Interleukin-2, T-Lymphocyte Subsets, Receptors, Interleukin-7, T-Lymphocytes, Regulatory
About these checks
Registry, retraction, Cites and statistics results are computed, not judged, with one exception: a printed reference that no index lists is read once by a model before it counts as a citation error. Claims are extracted by a model and kept only when their quote appears verbatim in the text; each cited source is then checked, with a model’s help, for whether it says what the claim relies on. Those verdicts can be wrong — read the claim’s quote and the cited source before relying on one.
Statistics and arithmetic are recomputed, not judged.
Confidence bands are shown only for fields calibrated on our annotated test set. None is calibrated yet, so no band is shown.
What counts as a claim ›How we measure confidence ›How we check this ›
Are you an author, or do you see a problem with this page? Request a review
