

The DOI matches its Crossref record; 47 of the 47 references it cites were found in a registry or an index.
Regulation of inflammatory responses by IL-17F
Open accessAbstract
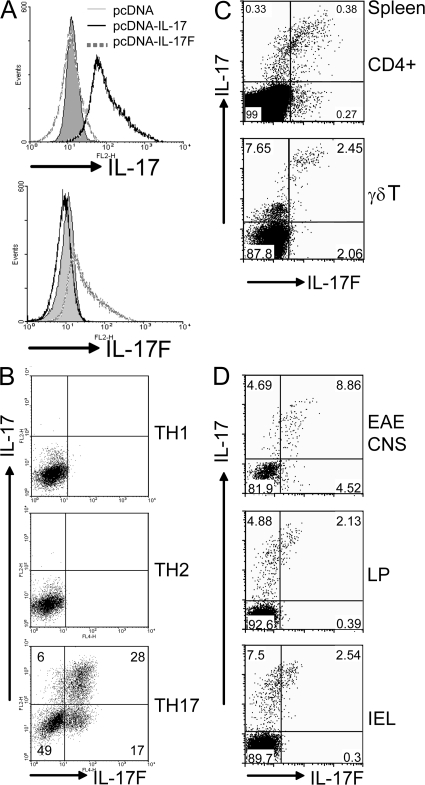
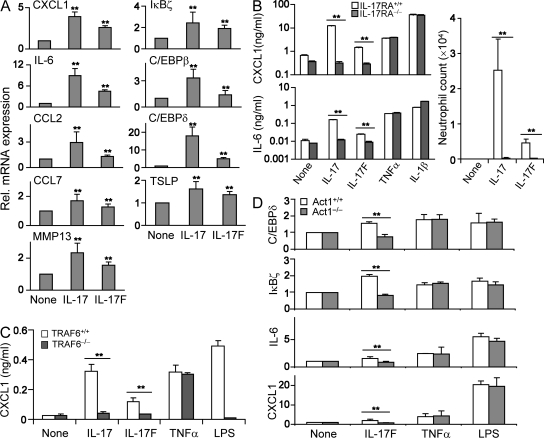
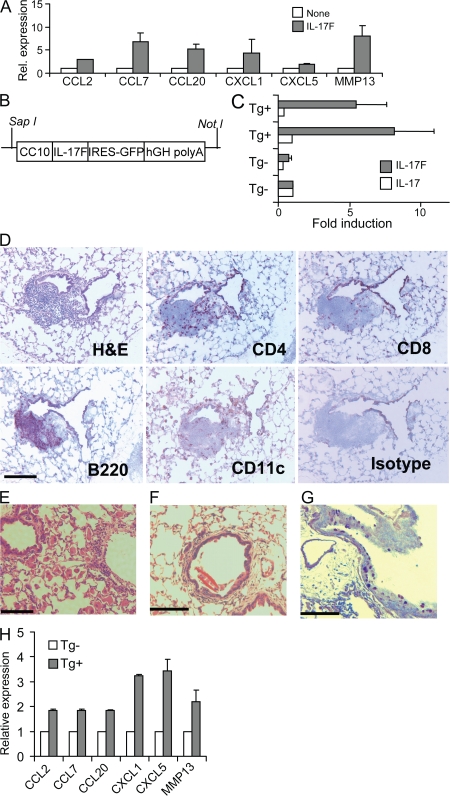
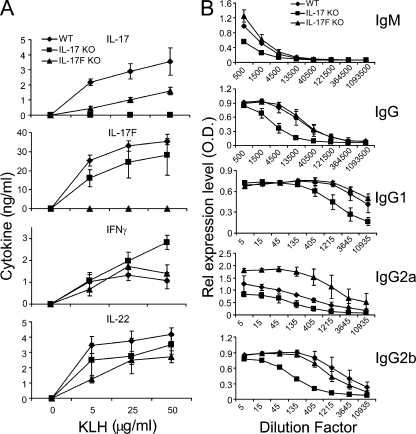
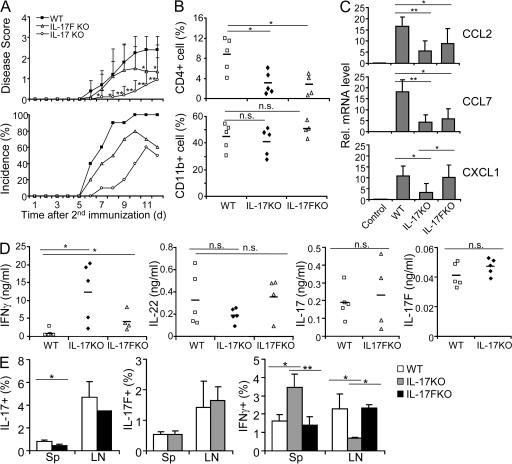
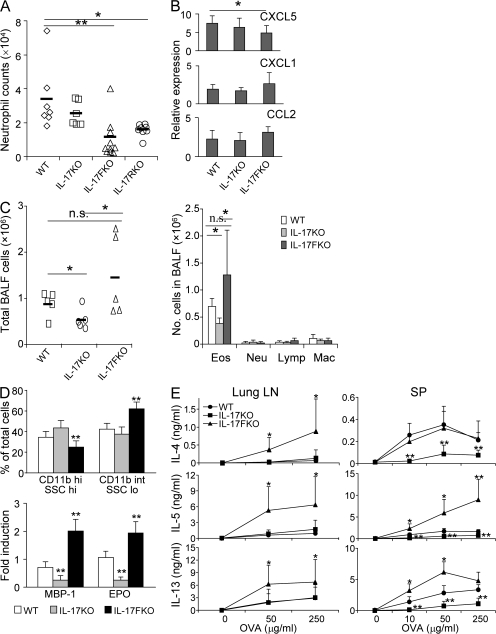
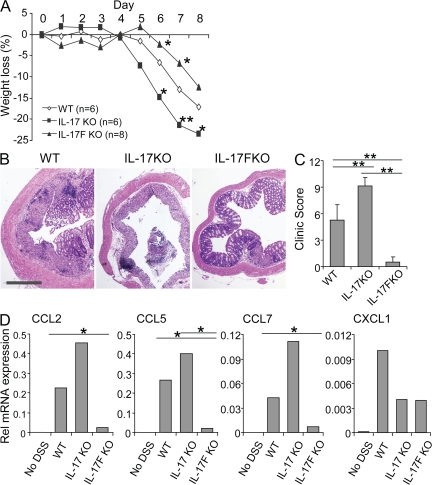
Although interleukin (IL) 17 has been extensively characterized, the function of IL-17F, which has an expression pattern regulated similarly to IL-17, is poorly understood. We show that like IL-17, IL-17F regulates proinflammatory gene expression in vitro, and this requires IL-17 receptor A, tumor necrosis factor receptor–associated factor 6, and Act1. In vivo, overexpression of IL-17F in lung epithelium led to infiltration of lymphocytes and macrophages and mucus hyperplasia, similar to observations made in IL-17 transgenic mice. To further understand the function of IL-17F, we generated and analyzed mice deficient in IL-17F or IL-17. IL-17, but not IL-17F, was required for the initiation of experimental autoimmune encephalomyelitis. Mice deficient in IL-17F, but not IL-17, had defective airway neutrophilia in response to allergen challenge. Moreover, in an asthma model, although IL-17 deficiency reduced T helper type 2 responses, IL-17F–deficient mice displayed enhanced type 2 cytokine production and eosinophil function. In addition, IL-17F deficiency resulted in reduced colitis caused by dextran sulfate sodium, whereas IL-17 knockout mice developed more severe disease. Our results thus demonstrate that IL-17F is an important regulator of inflammatory responses that seems to function differently than IL-17 in immune responses and diseases.
Overview
The claims and statistics of this paper haven’t been checked yet.
Run the check — free, no account needed. It reads the open-access text and checks the sources it cites.
Integrity signals
Registry
Cites
Statistics
Figures
Verification
Claims the paper makes
The claims and statistics of this paper haven’t been checked yet.
Run the check — free, no account needed. It reads the open-access text and checks the sources it cites.
Claims other papers make about this one
Each is checked against this paper’s own text: does it say what the citing paper says it does?
In the citing paper
“Fate-mapping studies using IL-17-fate reporter mice showed IL-23R-dependent differentiation of IL-17-producing cells into encephalitogenic IFNγ-producing Th1/Th17 cells”
From TH17 cell heterogeneity and its role in tissue inflammation (2023) · cites this paper as [76]
In the citing paper
“Use of cell fate reporter mice showed that T cells that initially express IL-17 (ex-Th17 cells) can subsequently express proinflammatory cytokines, including IFNγ and GM-CSF [38, 76].”
From TH17 cell heterogeneity and its role in tissue inflammation (2023) · cites this paper as [76]
In the citing paper
“Under inflammatory conditions, tissue Th17 cells have been reported to exhibit plastic changes in their effector programs.”
From TH17 cell heterogeneity and its role in tissue inflammation (2023) · cites this paper as [76]
In the citing paper
“In the absence of IL-23, Th17 cells lose the ability to up-regulate IFNγ and GM-CSF [76].”
From TH17 cell heterogeneity and its role in tissue inflammation (2023) · cites this paper as [76]
In the citing paper
“A key driver of the Th17 cell transition towards a pathogenic phenotype is the cytokine IL-23.”
From TH17 cell heterogeneity and its role in tissue inflammation (2023) · cites this paper as [76]
In the citing paper
“This conclusion is further supported by the findings that GM-CSF+ T cells co-express a great variety of other cytokines including IL-2, IL-3, IL-4, IL-6, IL-13, IL-17A, IL-22, IFNγ, and TNF [33, 36, 76, 175].”
From TH17 cell heterogeneity and its role in tissue inflammation (2023) · cites this paper as [76]
Self-check
Percentages, sums and reported differences re-computed from the paper’s own numbers.
The self-check needs the paper’s full text.
Citations
Cites
Ivanov, I. I., McKenzie, B. S., Zhou, L., Tadokoro, C. E., Lepelley, A., Lafaille, J. J., Cua, D. J., & Littman, D. R. (2006) · Cell · doi:10.1016/j.cell.2006.07.035 · Cited by 5,145
Harrington, L. E., Hatton, R. D., Mangan, P. R., Turner, H., Murphy, T. L., Murphy, K. M., & Weaver, C. T. (2005) · Nature Immunology · doi:10.1038/ni1254 · Cited by 4,742
A distinct lineage of CD4 T cells regulates tissue inflammation by producing interleukin 17
Park, H., Li, Z., Yang, X. O., Chang, S. H., Nurieva, R., Wang, Y.-H., Wang, Y., Hood, L., Zhu, Z., Tian, Q., et al. (2005) · Nature Immunology · doi:10.1038/ni1261 · Cited by 4,265
Self-citationIL-23 drives a pathogenic T cell population that induces autoimmune inflammation
Langrish, C. L., Chen, Y., Blumenschein, W. M., Mattson, J., Basham, B., Sedgwick, J. D., McClanahan, T., Kastelein, R. A., & Cua, D. J. (2005) · The Journal of Experimental Medicine · doi:10.1084/jem.20041257 · Cited by 4,099
Interleukin-17 Family Members and Inflammation
Kolls, J. K., & Lindén, A. (2004) · Immunity · doi:10.1016/j.immuni.2004.08.018 · Cited by 2,371
Interleukin-22, a TH17 cytokine, mediates IL-23-induced dermal inflammation and acanthosis
Zheng, Y., Danilenko, D. M., Valdez, P. A., Kasman, I. M., Eastham‐Anderson, J., Wu, J., & Ouyang, W. (2006) · Nature · doi:10.1038/nature05505 · Cited by 1,888
Zhu, Z., Homer, R., Wang, Z., Chen, Q., Geba, G. P., Wang, J., Zhang, Y., & Elias, J. A. (1999) · Journal of Clinical Investigation · doi:10.1172/jci5909 · Cited by 1,732
Self-citationT Helper 17 Lineage Differentiation Is Programmed by Orphan Nuclear Receptors RORα and RORγ
Yang, X. O., Pappu, B. P., Nurieva, R., Akimzhanov, A., Kang, H. S., Chung, Y., Ma, L., Shah, B., Panopoulos, A. D., Schluns, K. S., et al. (2008) · Immunity · doi:10.1016/j.immuni.2007.11.016 · Cited by 1,605
Self-citationSTAT3 Regulates Cytokine-mediated Generation of Inflammatory Helper T Cells
Yang, X. O., Panopoulos, A. D., Nurieva, R., Chang, S. H., Wang, D., Watowich, S. S., & Dong, C. (2007) · Journal of Biological Chemistry · doi:10.1074/jbc.c600321200 · Cited by 1,530
Self-citationYe, P., Rodriguez, F. H., Kanaly, S. T., Stocking, K. L., Schurr, J. R., Schwarzenberger, P. O., Oliver, P., Huang, W., Zhang, P., Zhang, J., et al. (2001) · The Journal of Experimental Medicine · doi:10.1084/jem.194.4.519 · Cited by 1,522
Research works printed but not linked: 1
- 2006, Nat. Immunol., 7, 709
Cited by
Sorted by citations
Korn, T., Bettelli, E., Oukka, M., & Kuchroo, V. K. (2009) · Annual Review of Immunology · doi:10.1146/annurev.immunol.021908.132710 · Cited by 4,873
Cytokines in inflammatory bowel disease
Neurath, M. F. (2014) · Nature Reviews Immunology · doi:10.1038/nri3661 · Cited by 2,706
Intestinal homeostasis and its breakdown in inflammatory bowel disease
Maloy, K. J., & Powrie, F. M. (2011) · Nature · doi:10.1038/nature10208 · Cited by 1,911
Kaser, A., Zeissig, S., & Blumberg, R. S. (2010) · Annual Review of Immunology · doi:10.1146/annurev-immunol-030409-101225 · Cited by 1,806
Structure and signalling in the IL-17 receptor family
Gaffen, S. L. (2009) · Nature reviews. Immunology · doi:10.1038/nri2586 · Cited by 1,475
Targeting IL-17 and TH17 cells in chronic inflammation
Miossec, P., & Kolls, J. K. (2012) · Nature Reviews Drug Discovery · doi:10.1038/nrd3794 · Cited by 1,414
Functional Specialization of Interleukin-17 Family Members
Iwakura, Y., Ishigame, H., Saijo, S., & Nakae, S. (2011) · Immunity · doi:10.1016/j.immuni.2011.02.012 · Cited by 1,289
T cell subsets and their signature cytokines in autoimmune and inflammatory diseases
Raphael, I., Nalawade, S. A., Eagar, T. N., & Forsthuber, T. G. (2014) · Cytokine · doi:10.1016/j.cyto.2014.09.011 · Cited by 1,240
Molecular Antagonism and Plasticity of Regulatory and Inflammatory T Cell Programs
Yang, X. O., Nurieva, R., Martínez, G., Kang, H. S., Chung, Y., Pappu, B. P., Shah, B., Chang, S. H., Schluns, K. S., Watowich, S. S., et al. (2008) · Immunity · doi:10.1016/j.immuni.2008.05.007 · Cited by 1,169
Self-citationNurieva, R. I., Chung, Y., Hwang, D., Yang, X. O., Kang, H. S., Ma, L., Wang, Y.-H., Watowich, S. S., Jetten, A. M., Tian, Q., et al. (2008) · Immunity · doi:10.1016/j.immuni.2008.05.009 · Cited by 1,205
Self-citationProinflammatory Cytokines in the Pathogenesis of Inflammatory Bowel Diseases
Strober, W., & Fuss, I. J. (2011) · Gastroenterology · doi:10.1053/j.gastro.2011.02.016 · Cited by 1,126
El-Behi, M., Ciric, B., Dai, H., Yan, Y., Cullimore, M., Safavi, F., Zhang, G.-X., Dittel, B. N., & Rostami, A. (2011) · Nature Immunology · doi:10.1038/ni.2031 · Cited by 1,071
“, whereas TNF, IL-21, IL-22 and IL-17F are not required for the development of EA”
A Comprehensive Review and Update on the Pathogenesis of Inflammatory Bowel Disease
Guan, Q. (2019) · Journal of Immunology Research · doi:10.1155/2019/7247238 · Cited by 1,142
Ishigame, H., Kakuta, S., Nagai, T., Kadoki, M., Nambu, A., Komiyama, Y., Fujikado, N., Tanahashi, Y., Akitsu, A., Kotaki, H., et al. (2009) · Immunity · doi:10.1016/j.immuni.2008.11.009 · Cited by 1,004
IL-17 and IL-17-producing cells in protection versus pathology
Mills, K. H. G. (2022) · Nature reviews. Immunology · doi:10.1038/s41577-022-00746-9 · Cited by 1,068
Endotyping asthma: new insights into key pathogenic mechanisms in a complex, heterogeneous disease
Anderson, G. P. (2008) · The Lancet · doi:10.1016/s0140-6736(08)61452-x · Cited by 1,016
Innate and adaptive immune responses in asthma
Holgate, S. T. (2012) · Nature Medicine · doi:10.1038/nm.2731 · Cited by 942
The Immunologic Role of IL-17 in Psoriasis and Psoriatic Arthritis Pathogenesis
Blauvelt, A., & Chiricozzi, A. (2018) · Clinical Reviews in Allergy & Immunology · doi:10.1007/s12016-018-8702-3 · Cited by 821
Interleukins, from 1 to 37, and interferon-γ: Receptors, functions, and roles in diseases
Akdiş, M., Bürgler, S., Crameri, R., Eiwegger, T., Fujita, H., Alcaide, E. G., Klunker, S., Meyer, N., O’Mahony, L., Palomares, Ó., et al. (2011) · Journal of Allergy and Clinical Immunology · doi:10.1016/j.jaci.2010.11.050 · Cited by 809
A protective function for interleukin 17A in T cell–mediated intestinal inflammation
O'Connor Jr, W., Kamanaka, M., Booth, C. J., Town, T., Nakae, S., Iwakura, Y., Kolls, J. K., & Flavell, R. A. (2009) · Nature Immunology · doi:10.1038/ni.1736 · Cited by 756
Cytokine Networks in the Pathophysiology of Inflammatory Bowel Disease
Friedrich, M., Pohin, M., & Powrie, F. M. (2019) · Immunity · doi:10.1016/j.immuni.2019.03.017 · Cited by 776
Bleomycin and IL-1β–mediated pulmonary fibrosis is IL-17A dependent
Wilson, M. S., Madala, S. K., Ramalingam, T. R., Gochuico, B. R., Rosas, I. O., Cheever, A. W., & Wynn, T. A. (2010) · Journal of Experimental Medicine · doi:10.1084/jem.20092121 · Cited by 730
Jetten, A. M. (2009) · Nuclear Receptor Signaling · doi:10.1621/nrs.07003 · Cited by 700
IL-17 family: Cytokines, receptors and signaling
Gu, C., Wu, L., & Li, X. (2013) · Cytokine · doi:10.1016/j.cyto.2013.07.022 · Cited by 623
T-Cell Signaling Regulated by the Tec Family Kinase, ItkPreprint
Andreotti, A. H., Schwartzberg, P. L., Joseph, R. E., & Berg, L. J. (2010) · Cold Spring Harbor Perspectives in Biology · doi:10.1101/cshperspect.a002287 · Cited by 608
Immunological pathogenesis of inflammatory bowel disease
Lee, S., Kwon, J. E., & Cho, M. (2018) · Intestinal Research · doi:10.5217/ir.2018.16.1.26 · Cited by 606
Inflammation and colorectal cancer: colitis-associated neoplasia
Grivennikov, S. I. (2012) · Seminars in Immunopathology · doi:10.1007/s00281-012-0352-6 · Cited by 574
The Role of IL-17 and related cytokines in inflammatory autoimmune diseases
Kuwabara, T., Ishikawa, F., Kondo, M., & Kakiuchi, T. (2017) · Mediators of Inflammation · doi:10.1155/2017/3908061 · Cited by 519
IL-17 cytokines in immunity and inflammation
Jin, W., & Dong, C. (2013) · Emerging Microbes & Infections · doi:10.1038/emi.2013.58 · Cited by 543
Self-citationThe roles of IL‐17A in inflammatory immune responses and host defense against pathogens
Iwakura, Y., Nakae, S., Saijo, S., & Ishigame, H. (2008) · Immunological Reviews · doi:10.1111/j.1600-065x.2008.00699.x · Cited by 531
IL-17C regulates the innate immune function of epithelial cells in an autocrine manner
Ramirez-Carrozzi, V., Sambandam, A., Luis, E., Lin, Z., Jeet, S., Lesch, J., Hackney, J., Kim, J., Zhou, M., Lai, J., et al. (2011) · Nature Immunology · doi:10.1038/ni.2156 · Cited by 477
Interleukin 17 is a chief orchestrator of immunity
Veldhoen, M. (2017) · Nature Immunology · doi:10.1038/ni.3742 · Cited by 493
The IL-17 Family of Cytokines in Psoriasis: IL-17A and Beyond
Brembilla, N. C., Senra, L., & Boehncke, W. (2018) · Frontiers in Immunology · doi:10.3389/fimmu.2018.01682 · Cited by 491
IL-12, IL-23 and IL-17 in IBD: immunobiology and therapeutic targeting
Moschen, A. R., Tilg, H., & Raine, T. (2018) · Nature Reviews Gastroenterology & Hepatology · doi:10.1038/s41575-018-0084-8 · Cited by 488
The Th17 pathway and inflammatory diseases of the intestines, lungs, and skin
Weaver, C. T., Elson, C. O., Fouser, L. A., & Kolls, J. K. (2013) · Annual Review of Pathology Mechanisms of Disease · doi:10.1146/annurev-pathol-011110-130318 · Cited by 462
Spatially distinct tumor immune microenvironments stratify triple-negative breast cancers
Gruosso, T., Gigoux, M., Manem, V. S., Bertos, N., Zuo, D., Perlitch, I., Saleh, S. M. I., Zhao, H., Souleimanova, M., Johnson, R. M., et al. (2019) · Journal of Clinical Investigation · doi:10.1172/jci96313 · Cited by 452
IL-23 and Th17 Cells Enhance Th2-Cell–mediated Eosinophilic Airway Inflammation in Mice
Wakashin, H., Hirose, K., Maezawa, Y., Kagami, S., Suto, A., Watanabe, N., Saito, Y., Hatano, M., Tokuhisa, T., Iwakura, Y., et al. (2008) · American Journal of Respiratory and Critical Care Medicine · doi:10.1164/rccm.200801-086oc · Cited by 441
Haworth, O., Cernadas, M., Yang, R., Serhan, C. N., & Levy, B. D. (2008) · Nature Immunology · doi:10.1038/ni.1627 · Cited by 436
Cytokines and Chemokines inMycobacterium tuberculosisInfection
Domingo-Gonzalez, R., Prince, O. A., Cooper, A. M., & Khader, S. A. (2016) · Microbiology Spectrum · doi:10.1128/microbiolspec.tbtb2-0018-2016 · Cited by 434
Wilson, R. H., Whitehead, G. S., Nakano, H., Free, M. E., Kolls, J. K., & Cook, D. N. (2009) · American Journal of Respiratory and Critical Care Medicine · doi:10.1164/rccm.200904-0573oc · Cited by 411
IL-17A and IL-17F do not contribute vitally to autoimmune neuro-inflammation in mice
Haak, S., Croxford, A. L., Kreymborg, K., Heppner, F. L., Pouly, S., Becher, B., & Waisman, A. (2008) · Journal of Clinical Investigation · doi:10.1172/jci35997 · Cited by 412
Expression of the T Helper 17-Associated Cytokines IL-17A and IL-17F in Asthma and COPD
Doe, C., Bafadhel, M., Siddiqui, S., Desai, D., Mistry, V., Rugman, P., McCormick, M. J., Woods, J., May, R. D., Sleeman, M. A., et al. (2010) · CHEST Journal · doi:10.1378/chest.09-3058 · Cited by 399
Pathological versus protective functions of IL-22 in airway inflammation are regulated by IL-17A
Sonnenberg, G. F., Nair, M. G., Kirn, T. J., Zaph, C., Fouser, L. A., & Artis, D. (2010) · The Journal of Experimental Medicine · doi:10.1084/jem.20092054 · Cited by 404
Martín‐Orozco, N., Chung, Y., Chang, S. H., Wang, Y., & Dong, C. (2009) · European Journal of Immunology · doi:10.1002/eji.200838475 · Cited by 370
Self-citationInterleukin-17 and its expanding biological functions
Xu, S., & Cao, X. (2010) · Cellular and Molecular Immunology · doi:10.1038/cmi.2010.21 · Cited by 362
Kudo, M., Ishigatsubo, Y., & Aoki, I. (2013) · Frontiers in Microbiology · doi:10.3389/fmicb.2013.00263 · Cited by 362
Lipocalin-2: Structure, function, distribution and role in metabolic disorders
Jaberi, S. A., Cohen, A., D’Souza, C. M., Abdulrazzaq, Y. M., Ojha, S. K., Bastaki, S. M. A., & Adeghate, E. A. (2021) · Biomedicine & Pharmacotherapy · doi:10.1016/j.biopha.2021.112002 · Cited by 349
Alcorn, J. F., Crowe, C. R., & Kolls, J. K. (2010) · Annual Review of Physiology · doi:10.1146/annurev-physiol-021909-135926 · Cited by 357
Wang, K., Kim, M. K., Caro, G. D., Wong, J., Shalapour, S., Wan, J., Zhang, W., Zhong, Z., Sánchez‐López, E., Wu, L., et al. (2014) · Immunity · doi:10.1016/j.immuni.2014.11.009 · Cited by 353
Differential regulation of interleukin 17 and interferon production in inflammatory bowel disease
Rovedatti, L., Kudo, T., Biancheri, P., Sarra, M., Knowles, C. H., Rampton, D. S., Corazza, G. R., Monteleone, G., Sabatino, A. D., & MacDonald, T. T. (2009) · Gut · doi:10.1136/gut.2009.182170 · Cited by 350
Recent advances in inflammatory bowel disease: mucosal immune cells in intestinal inflammation
Cader, M. Z., & Kaser, A. (2013) · Gut · doi:10.1136/gutjnl-2012-303955 · Cited by 351
Res, P. C. M., Pişkin, G., de Boer, O. J., van der Loos, C. M., Teeling, P., Bos, J. D., & Teunissen, M. B. M. (2010) · PLoS ONE · doi:10.1371/journal.pone.0014108 · Cited by 335
Involvement of JAK/STAT signaling in the pathogenesis of inflammatory bowel disease
Coskun, M., Salem, M. A., Pedersen, J., & Nielsen, O. H. (2013) · Pharmacological Research · doi:10.1016/j.phrs.2013.06.007 · Cited by 334
T helper 17 cells play a critical pathogenic role in lung cancer
Chang, S. H., Mirabolfathinejad, S. G., Katta, H., Cumpian, A. M., Gong, L., Caetano, M. S., Moghaddam, S. J., & Dong, C. (2014) · Proceedings of the National Academy of Sciences · doi:10.1073/pnas.1319051111 · Cited by 326
Self-citationSong, X., Zhu, S., Shi, P., Liu, Y., Shi, Y., Levin, S. D., & Qian, Y. (2011) · Nature Immunology · doi:10.1038/ni.2155 · Cited by 312
Role of Th17 Cells in the Pathogenesis of Human IBD
Gálvez, J. (2014) · ISRN Inflammation · doi:10.1155/2014/928461 · Cited by 333
Jakubczyk, D., Leszczyńska, K., & Górska, S. (2020) · Nutrients · doi:10.3390/nu12071973 · Cited by 323
Mucosal fungi promote gut barrier function and social behavior via Type 17 immunity
Leonardi, I., Gao, I. H., Lin, W.-Y., Allen, M., Li, X. V., Fiers, W. D., De Celie, M. B., Putzel, G. G., Yantiss, R. K., Johncilla, M., et al. (2022) · Cell · doi:10.1016/j.cell.2022.01.017 · Cited by 307
Reynolds, J. M., Pappu, B. P., Peng, J., Martínez, G., Zhang, Y., Chung, Y., Ma, L., Yang, X. O., Nurieva, R., Tian, Q., et al. (2010) · Immunity · doi:10.1016/j.immuni.2010.04.010 · Cited by 304
Self-citationChen, X., Wu, X., Zhou, Q., Howard, O. M. Z., Netea, M. G., & Oppenheim, J. J. (2012) · The Journal of Immunology · doi:10.4049/jimmunol.1202659 · Cited by 291
TH17 cell heterogeneity and its role in tissue inflammation
Schnell, A., Littman, D. R., & Kuchroo, V. K. (2023) · Nature Immunology · doi:10.1038/s41590-022-01387-9 · Cited by 286
IL-17/IL-17 receptor system in autoimmune disease: mechanisms and therapeutic potential
Zhu, S., & Qian, Y. (2012) · Clinical Science · doi:10.1042/cs20110496 · Cited by 291
The interleukin-17 cytokine family: critical players in host defence and inflammatory diseases
Pappu, R., Ramirez-Carrozzi, V. R., & Sambandam, A. (2011) · Immunology · doi:10.1111/j.1365-2567.2011.03465.x · Cited by 289
Interleukin-17C Promotes Th17 Cell Responses and Autoimmune Disease via Interleukin-17 Receptor E
Chang, S. H., Reynolds, J. M., Pappu, B. P., Chen, G., Martínez, G., & Dong, C. (2011) · Immunity · doi:10.1016/j.immuni.2011.09.010 · Cited by 281
Self-citationCytokines, IBD, and Colitis-associated Cancer
Francescone, R., Hou, V., & Grivennikov, S. I. (2015) · Inflammatory Bowel Diseases · doi:10.1097/mib.0000000000000236 · Cited by 278
Glatt, S., Baeten, D., BAKER, T. S., Griffiths, M., Ionescu, L., Lawson, A. D. G., Maroof, A., Oliver, R., Popa, S., Strimenopoulou, F., et al. (2017) · Annals of the Rheumatic Diseases · doi:10.1136/annrheumdis-2017-212127 · Cited by 270
Microbiome, inflammation and colorectal cancer
Chen, J., Pitmon, E., & Wang, K. (2017) · Seminars in Immunology · doi:10.1016/j.smim.2017.09.006 · Cited by 274
CD4 T-cell differentiation and inflammatory bowel disease
Zenewicz, L. A., Antov, A., & Flavell, R. A. (2009) · Trends in Molecular Medicine · doi:10.1016/j.molmed.2009.03.002 · Cited by 270
Bcl6 expression specifies the T follicular helper cell program in vivo
Liu, X., Yan, X. S., Zhong, B., Nurieva, R., Wang, A., Wang, X., Martín‐Orozco, N., Wang, Y., Chang, S. H., Esplugues, E., et al. (2012) · The Journal of Experimental Medicine · doi:10.1084/jem.20120219 · Cited by 273
Self-citationIL-17 contributes to CD4-mediated graft-versus-host disease
Kappel, L. W., Goldberg, G. L., King, C. G., Suh, D. Y., Smith, O. M., Ligh, C. A., Holland, A. M., Grubin, J., Mark, N. M., Liu, C., et al. (2008) · Blood · doi:10.1182/blood-2008-08-172155 · Cited by 261
IL-17A secretion by CD8+ T cells supports Th17-mediated autoimmune encephalomyelitis
Huber, M., Heink, S., Pagenstecher, A., Reinhard, K., Ritter, J., Visekruna, A., Guralnik, A., Bollig, N., Jeltsch, K. M., Heinemann, C., et al. (2012) · Journal of Clinical Investigation · doi:10.1172/jci63681 · Cited by 264
McGinley, A. M., Sutton, C. E., Edwards, S. C., Leane, C. M., DeCourcey, J., Teijeiro, A., Hamilton, J. A., Boon, L., Djouder, N., & Mills, K. H. G. (2020) · Immunity · doi:10.1016/j.immuni.2020.01.002 · Cited by 248
Sarra, M., Pallone, F., MacDonald, T. T., & Monteleone, G. (2010) · Inflammatory Bowel Diseases · doi:10.1002/ibd.21248 · Cited by 259
Lazarevic, V., & Glimcher, L. H. (2011) · Nature Immunology · doi:10.1038/ni.2059 · Cited by 255
Th17 cytokines and their emerging roles in inflammation and autoimmunity
Fouser, L. A., Wright, J. F., Dunussi‐Joannopoulos, K., & Collins, M. A. (2008) · Immunological Reviews · doi:10.1111/j.1600-065x.2008.00712.x · Cited by 249
CD4 T-Cell Subsets and the Pathophysiology of Inflammatory Bowel Disease
Gómez-Bris, R., Saéz, Á., Herrero‐Fernández, B., Rius, C., Sánchez-Martinez, H., & González, J. M. (2023) · International Journal of Molecular Sciences · doi:10.3390/ijms24032696 · Cited by 265
Growth Factor FGF2 Cooperates with Interleukin-17 to Repair Intestinal Epithelial Damage
Song, X., Dai, D., He, X., Zhu, S., Yao, Y., Gao, H., Wang, J., Qu, F., Qiu, J., Wang, H., et al. (2015) · Immunity · doi:10.1016/j.immuni.2015.06.024 · Cited by 249
Mukherjee, S., Lindell, D. M., Berlin, A. A., Morris, S. B., Shanley, T. P., Hershenson, M. B., & Lukacs, N. W. (2011) · American Journal Of Pathology · doi:10.1016/j.ajpath.2011.03.003 · Cited by 242
Th17 Response and Inflammatory Autoimmune Diseases
Waite, J. C., & Skokos, D. (2011) · International Journal of Inflammation · doi:10.1155/2012/819467 · Cited by 243
IL-17 family member cytokines: Regulation and function in innate immunity
Reynolds, J. M., Angkasekwinai, P., & Dong, C. (2010) · Cytokine & Growth Factor Reviews · doi:10.1016/j.cytogfr.2010.10.002 · Cited by 244
Self-citationToll-like receptor 4 signaling in T cells promotes autoimmune inflammation
Reynolds, J. M., Martínez, G., Chung, Y., & Dong, C. (2012) · Proceedings of the National Academy of Sciences · doi:10.1073/pnas.1120585109 · Cited by 240
Self-citationEmerging roles of T helper 17 and regulatory T cells in lung cancer progression and metastasis
Marshall, E. A., Ng, K. W., Kung, S. H. Y., Conway, E. M., Martínez, V. D., Halvorsen, E. C., Rowbotham, D. A., Vucic, E. A., Plumb, A. W., Becker‐Santos, D. D., et al. (2016) · Molecular Cancer · doi:10.1186/s12943-016-0551-1 · Cited by 233
Signaling of interleukin-17 family cytokines in immunity and inflammation
Chang, S. H., & Dong, C. (2010) · Cellular Signalling · doi:10.1016/j.cellsig.2010.11.022 · Cited by 238
Self-citationCD 4+ T‐cell subsets in intestinal inflammation
Shale, M., Schiering, C., & Powrie, F. M. (2013) · Immunological Reviews · doi:10.1111/imr.12039 · Cited by 230
Cytokine networking of innate immunity cells: a potential target of therapy
Střı́ž, I., Brabcová, E., Kolesár, L., & Sekerková, A. (2014) · Clinical Science · doi:10.1042/cs20130497 · Cited by 231
From interleukin-23 to T-helper 17 cells: human T-helper cell differentiation revisited
Boniface, K., Blom, B., Liu, Y., & De Waal Malefyt, R. (2008) · Immunological Reviews · doi:10.1111/j.1600-065x.2008.00714.x · Cited by 218
STAT3 in CD4+ T helper cell differentiation and inflammatory diseases
Egwuagu, C. E. (2009) · Cytokine · doi:10.1016/j.cyto.2009.07.003 · Cited by 219
Alterations of the Gut Microbiota in Hashimoto's Thyroiditis Patients
Zhao, F., Feng, J., Li, J., Zhao, L., Liu, Y., Chen, H., Jin, Y., Zhu, B., & Wei, Y. (2018) · Thyroid · doi:10.1089/thy.2017.0395 · Cited by 224
Gómez‐Rodríguez, J., Sahu, N., Handon, R., Davidson, T. S., Anderson, S. M., Kirby, M., August, A., & Schwartzberg, P. L. (2009) · Immunity · doi:10.1016/j.immuni.2009.07.009 · Cited by 217
Zhong, B., Liu, X., Wang, X., Chang, S. H., Liu, X., Wang, A., Reynolds, J. M., & Dong, C. (2012) · Nature Immunology · doi:10.1038/ni.2427 · Cited by 206
IL-1 and IL-23 Mediate Early IL-17A Production in Pulmonary Inflammation Leading to Late Fibrosis
Gasse, P., Riteau, N., Vacher, R., Michel, M.-L., Fautrel, A., di Padova, F., Fick, L., Charron, S., Lagente, V., Eberl, G., et al. (2011) · PLoS ONE · doi:10.1371/journal.pone.0023185 · Cited by 208
Role of the IL23/IL17 Pathway in Crohn’s Disease
Schmitt, H., Neurath, M. F., & Atreya, R. N. (2021) · Frontiers in Immunology · doi:10.3389/fimmu.2021.622934 · Cited by 208
Biological role of Toll-like receptor-4 in the brain
Trotta, T., Porro, C., Calvello, R., & Panaro, M. A. (2014) · Journal of Neuroimmunology · doi:10.1016/j.jneuroim.2014.01.014 · Cited by 209
T helper 17 cell heterogeneity and pathogenicity in autoimmune disease
Ghoreschi, K., Laurence, A. D. J., Yang, X., Hirahara, K., & O’Shea, J. J. (2011) · Trends in Immunology · doi:10.1016/j.it.2011.06.007 · Cited by 207
Self-citationAirway mucus: The good, the bad, the sticky
Evans, C. M., & Koo, J. S. (2008) · Pharmacology & Therapeutics · doi:10.1016/j.pharmthera.2008.11.001 · Cited by 216
The activation and regulation of IL-17 receptor mediated signaling
Song, X., & Qian, Y. (2013) · Cytokine · doi:10.1016/j.cyto.2013.03.014 · Cited by 206
IL-23R+ innate lymphoid cells induce colitis via interleukin-22-dependent mechanism
Eken, A., Singh, A. K., Treuting, P. M., & Oukka, M. (2013) · Mucosal Immunology · doi:10.1038/mi.2013.33 · Cited by 216
Regulation and Function of Proinflammatory TH17 Cells
Martínez, G., Nurieva, R., Yang, X. O., & Dong, C. (2008) · Annals of the New York Academy of Sciences · doi:10.1196/annals.1443.021 · Cited by 213
Self-citationImmunology of Inflammatory Bowel Disease: Molecular Mechanisms and Therapeutics
Lu, Q., Yang, M.-F., Liang, Y.-J., Xu, J., Xu, H.-M., Nie, Y.-Q., Wang, L.-S., Yao, J., & Li, D.-F. (2022) · Journal of Inflammation Research · doi:10.2147/jir.s353038 · Cited by 222
Pivotal Roles of T-Helper 17-Related Cytokines, IL-17, IL-22, and IL-23, in Inflammatory Diseases
Qu, N., Xu, M., Mizoguchi, I., Furusawa, J.-I., Kaneko, K. J., Watanabe, K., Mizuguchi, J., Itoh, M., Kawakami, Y., & Yoshimoto, T. (2013) · Clinical and Developmental Immunology · doi:10.1155/2013/968549 · Cited by 199
Metadata
- Authors
- Yang, X. O., Chang, S. H., Park, H., Nurieva, R., Shah, B., Acero, L., Wang, Y.-H., Schluns, K. S., Broaddus, R. R., Zhu, Z., & Dong, C.
- Affiliations
- The University of Texas MD Anderson Cancer Center (US)
- 1Department of Immunology
- University of Washington (US)
- Johns Hopkins University (US)
- ORCID
- Venue
- The Journal of Experimental Medicine
- Publisher
- Rockefeller University Press
- Published
- 2008-04-14
- Volume
- 205
- Issue
- 5
- Pages
- 1063-1075
- ISSN
- 0022-1007 (ISSN-L)
- 1540-9538
- PMC
- PMC2373839
- OpenAlex
- W2110264653
- Cited by
- 739
- References
- 47
- Citations by year
- 2026: 6 · 2025: 14 · 2024: 18 · 2023: 27 · 2022: 40 · 2021: 31 · 2020: 33 · 2019: 27 · 2018: 38 · 2017: 45 · 2016: 39 · 2015: 54 · 2014: 56 · 2013: 56 · 2012: 54
- FWCI
- 28.07
- Type
- journal article
- Language
- en
- Open access
- green
- www.ncbi.nlm.nih.gov
- Licence
- cc-by-nc-sa
- Locations
- The Journal of Experimental Medicine (publishedVersion)
- PubMed Central (publishedVersion, cc-by-nc-sa)
- PubMed (publishedVersion)
- Topics
- Life Sciences › Immunology and Microbiology › Immunology › Psoriasis: Treatment and Pathogenesis
- Life Sciences › Immunology and Microbiology › Immunology › Cytokine Signaling Pathways and Interactions
- Life Sciences › Immunology and Microbiology › Immunology › T-cell and B-cell Immunology
- Keywords
- IL-17F, IL-17, inflammation, IL-17 receptor A, TRAF6, Act1, pro-inflammatory gene expression, lung epithelium, experimental autoimmune encephalomyelitis, airway neutrophilia, allergen challenge, asthma, Th2 immune response, eosinophils, colitis, dextran sulfate
- MeSH terms
- Animals, Cell Line, Fibroblasts, Homeostasis, Inflammation, Lymphocyte Activation, Mice, Transgenic, T-Lymphocytes, Transfection, CD4-Positive T-Lymphocytes, Mice, Knockout, Reverse Transcriptase Polymerase Chain Reaction, Interleukin-17, Mice
About these checks
Registry, retraction, Cites and statistics results are computed, not judged, with one exception: a printed reference that no index lists is read once by a model before it counts as a citation error. Claims are extracted by a model and kept only when their quote appears verbatim in the text; each cited source is then checked, with a model’s help, for whether it says what the claim relies on. Those verdicts can be wrong — read the claim’s quote and the cited source before relying on one.
Statistics and arithmetic are recomputed, not judged.
Confidence bands are shown only for fields calibrated on our annotated test set. None is calibrated yet, so no band is shown.
What counts as a claim ›How we measure confidence ›How we check this ›
Are you an author, or do you see a problem with this page? Request a review
