

The DOI matches its Crossref record; 129 of the 130 references it cites were found in a registry or an index.
Human germline heterozygous gain-of-function STAT6 variants cause severe allergic disease
Open accessPublished version of a preprint
Abstract
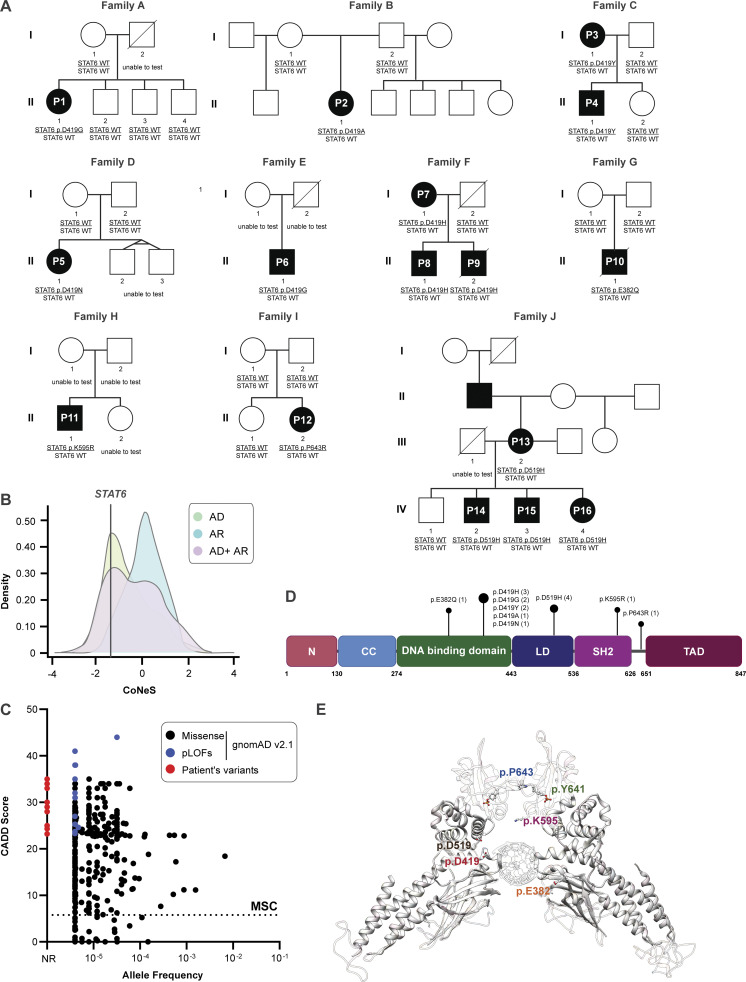
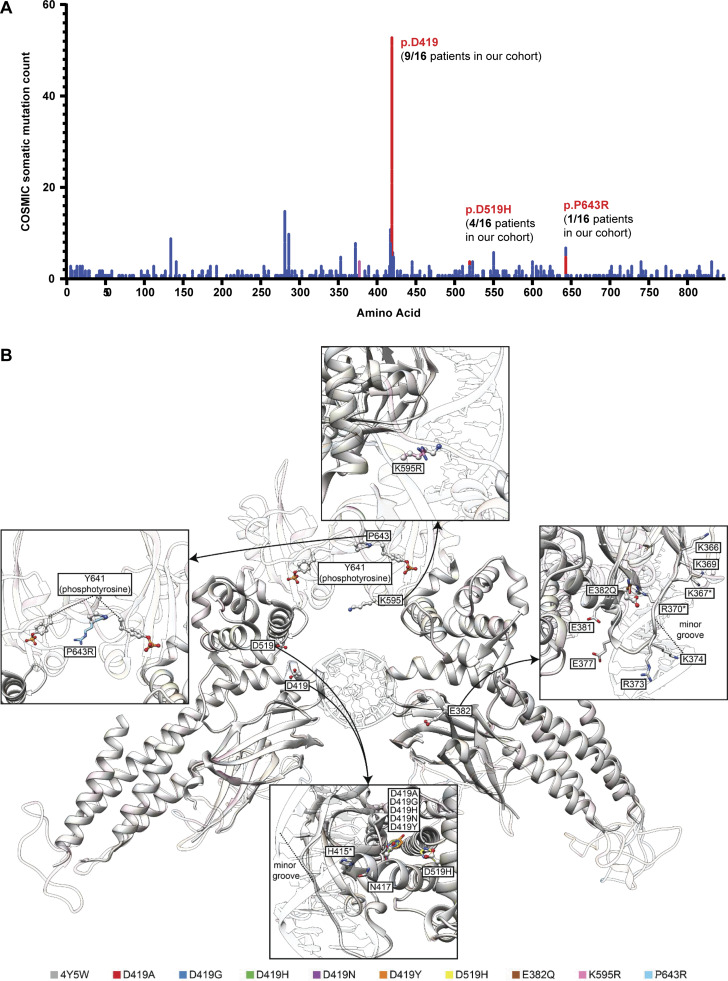
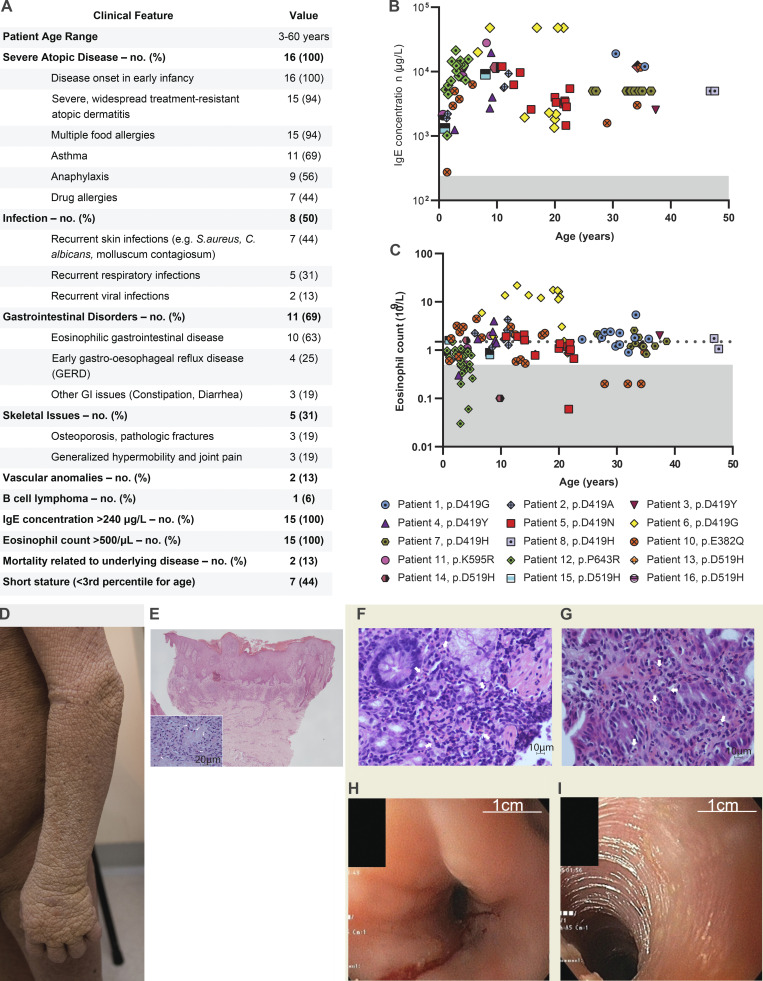
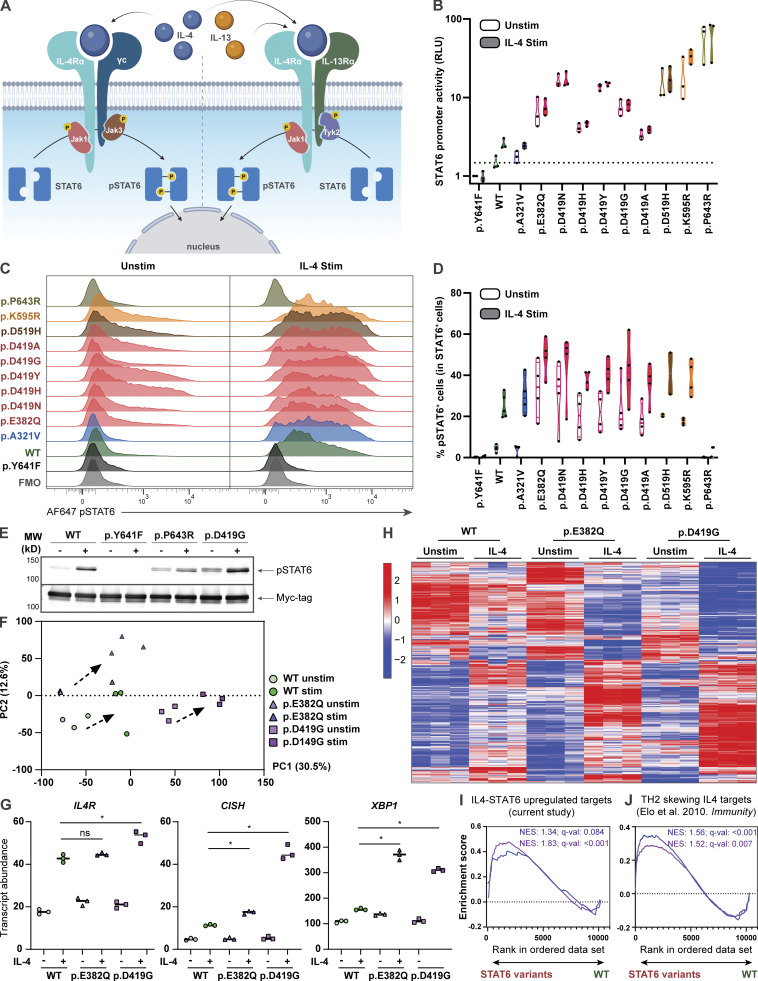
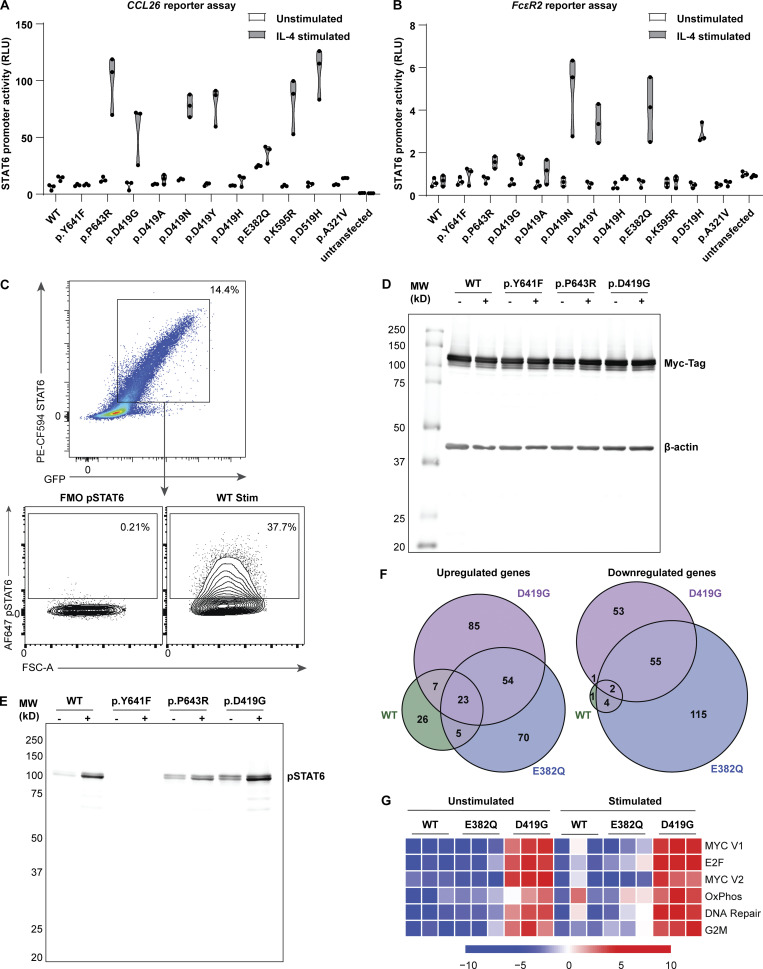
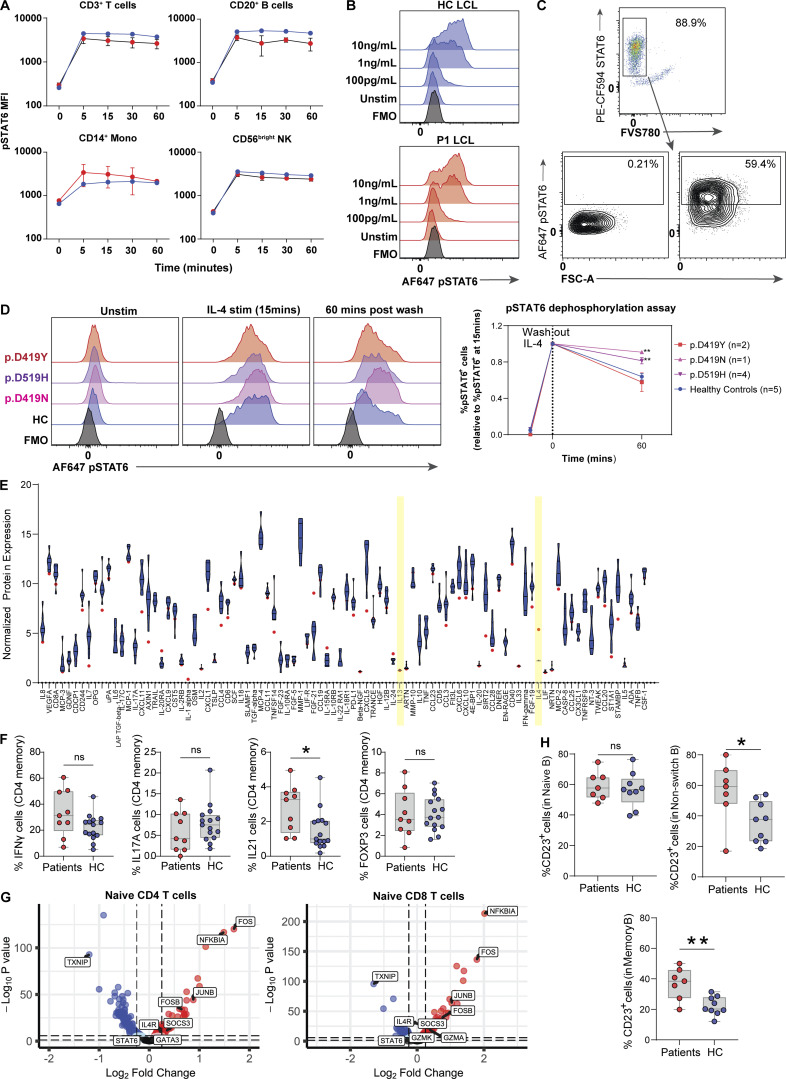
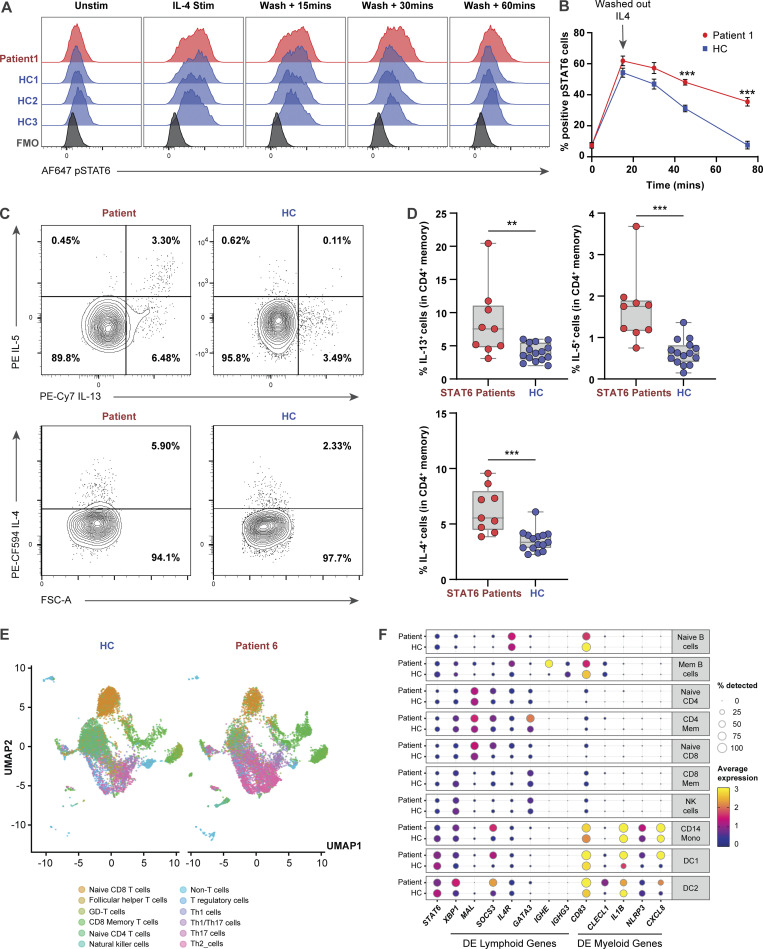
STAT6 (signal transducer and activator of transcription 6) is a transcription factor that plays a central role in the pathophysiology of allergic inflammation. We have identified 16 patients from 10 families spanning three continents with a profound phenotype of early-life onset allergic immune dysregulation, widespread treatment-resistant atopic dermatitis, hypereosinophilia with esosinophilic gastrointestinal disease, asthma, elevated serum IgE, IgE-mediated food allergies, and anaphylaxis. The cases were either sporadic (seven kindreds) or followed an autosomal dominant inheritance pattern (three kindreds). All patients carried monoallelic rare variants in STAT6 and functional studies established their gain-of-function (GOF) phenotype with sustained STAT6 phosphorylation, increased STAT6 target gene expression, and TH2 skewing. Precision treatment with the anti–IL-4Rα antibody, dupilumab, was highly effective improving both clinical manifestations and immunological biomarkers. This study identifies heterozygous GOF variants in STAT6 as a novel autosomal dominant allergic disorder. We anticipate that our discovery of multiple kindreds with germline STAT6 GOF variants will facilitate the recognition of more affected individuals and the full definition of this new primary atopic disorder.
Overview
The claims and statistics of this paper haven’t been checked yet.
Run the check — free, no account needed. It reads the open-access text and checks the sources it cites.
Integrity signals
Registry
Cites
Statistics
Figures
Verification
Claims the paper makes
The claims and statistics of this paper haven’t been checked yet.
Run the check — free, no account needed. It reads the open-access text and checks the sources it cites.
Claims other papers make about this one
Each is checked against this paper’s own text: does it say what the citing paper says it does?
The source backs part of the claim, not all of it — or backs it for a different population, condition or comparison.
In the citing paper
“These results suggest that JAK1 inhibition and IL-4Rα antagonism both lead to suppression of STAT6 activation 34,35 , thereby reducing downstream type 2-associated inflammatory signalling within the HDM-VSA model.”
From Vascularized human skin assembloids model compartmental skin organization and immune responsiveness in vitro (2026) · cites this paper as [35]
Experimental — accuracy not yet measured
Self-check
Percentages, sums and reported differences re-computed from the paper’s own numbers.
The self-check needs the paper’s full text.
Citations
Cites
UCSF Chimera—A visualization system for exploratory research and analysis
Pettersen, E. F., Goddard, T. D., Huang, C. C., Couch, G. S., Greenblatt, D. M., Meng, E. C., & Ferrin, T. E. (2004) · Journal of Computational Chemistry · doi:10.1002/jcc.20084 · Cited by 46,047
limma powers differential expression analyses for RNA-sequencing and microarray studies
Ritchie, M. E., Phipson, B., Wu, D., Hu, Y., Law, C. W., Shi, W., & Smyth, G. K. (2015) · Nucleic Acids Research · doi:10.1093/nar/gkv007 · Cited by 40,458
SWISS-MODEL: homology modelling of protein structures and complexes
Waterhouse, A. M., Bertoni, M., Bienert, S., Studer, G., Tauriello, G., Gumienny, R., Heer, F. T., de Beer, T., Rempfer, C., Bordoli, L., et al. (2018) · Nucleic Acids Research · doi:10.1093/nar/gky427 · Cited by 13,248
Robust enumeration of cell subsets from tissue expression profiles
Newman, A. M., Liu, C. L., Green, M. R., Gentles, A. J., Feng, W., Xu, Y., Hoang, C. D., Diehn, M., & Alizadeh, A. A. (2015) · Nature Methods · doi:10.1038/nmeth.3337 · Cited by 13,224
A method and server for predicting damaging missense mutations.
Adzhubei, I. A., Schmidt, S., Peshkin, L., Ramensky, V. E., Gerasimova, A., Bork, P., Kondrashov, A. S., & Sunyaev, S. R. (2010) · Nature Methods · doi:10.1038/nmeth0410-248 · Cited by 13,194
Aran, D., Looney, A. P., Liu, L., Wu, E., Fong, V., Hsu, A., Chak, S., Naikawadi, R. P., Wolters, P. J., Abate, A. R., et al. (2019) · Nature Immunology · doi:10.1038/s41590-018-0276-y · Cited by 4,984
COSMIC: the Catalogue Of Somatic Mutations In Cancer
Tate, J. G., Bamford, S., Jubb, H. C., Sondka, Z., Beare, D. M., Bindal, N., Boutselakis, H., Cole, C. G., Creatore, C., Dawson, E., et al. (2019) · Nucleic Acids Research · doi:10.1093/nar/gky1015 · Cited by 4,867
Hafemeister, C., & Satija, R. (2019) · Genome Biology · doi:10.1186/s13059-019-1874-1 · Cited by 4,479
SIFT web server: predicting effects of amino acid substitutions on proteins
Sim, N.-L., Kumar, P. N., Hu, J., Henikoff, S., Schneider, G., & Ng, P. C. (2012) · Nucleic Acids Research · doi:10.1093/nar/gks539 · Cited by 2,419
A cross-population atlas of genetic associations for 220 human phenotypes
Sakaue, S., Kanai, M., Tanigawa, Y., Karjalainen, J. M., Kurki, M., Koshiba, S., Narita, A., Konuma, T., Yamamoto, K., Akiyama, M., et al. (2021) · Nature Genetics · doi:10.1038/s41588-021-00931-x · Cited by 2,335
Cited by
Sorted by citations
Poli, M. C., Aksentijevich, I. A., Bousfiha, A. A., Cunningham‐Rundles, C., Hambleton, S., Klein, C., Morio, T., Pïcard, C., Puel, A., Rezaei, N., et al. (2025) · Journal of Human Immunity · doi:10.70962/jhi.20250003 · Cited by 354
Self-citationSensory Neurons Promote Immune Homeostasis in the Lung
Tamari, M., Bel, K. L. D., Heul, A. V., Zamidar, L., Orimo, K., Hoshi, M., Trier, A. M., Yano, H., Yang, T.-L., Biggs, C. M., et al. (2022) · Cell · doi:10.1016/j.cell.2023.11.027 · Cited by 136
Self-citationSamra, S., Bergerson, J., Freeman, A. F., & Turvey, S. E. (2024) · Journal of Allergy and Clinical Immunology · doi:10.1016/j.jaci.2024.09.020 · Cited by 97
Self-citationKim, B., Rothenberg, M. E., Sun, X., Bachert, C., Artis, D., Zaheer, R. S., Deniz, Y. M., Rowe, P., & Cyr, S. L. (2023) · Journal of Allergy and Clinical Immunology · doi:10.1016/j.jaci.2023.08.017 · Cited by 97
Ott, N., Faletti, L. E., Heeg, M., Andreani, V., & Grimbacher, B. (2023) · Journal of Clinical Immunology · doi:10.1007/s10875-023-01483-x · Cited by 87
The ins and outs of innate and adaptive type 2 immunity
Molofsky, A. B., & Locksley, R. M. (2023) · Immunity · doi:10.1016/j.immuni.2023.03.014 · Cited by 73
The Evolution, Immunopathogenesis and Biomarkers of Type 2 Inflammation in Common Allergic Disorders
Gao, Y., Wang, Z., Öğülür, İ., Li, S., Yazıcı, D., Li, X., Pat, Y., Zheng, Y., Babayev, H., Zeyneloglu, C., et al. (2025) · Allergy · doi:10.1111/all.16620 · Cited by 76
The ups and downs of STAT3 function: too much, too little and human immune dysregulation
Mackie, J., Ma, C. S., Tangye, S. G., & Guérin, A. (2023) · Clinical & Experimental Immunology · doi:10.1093/cei/uxad007 · Cited by 47
The Th17/IL-17 Axis and Host Defense Against Fungal Infections
Tangye, S. G., & Puel, A. (2023) · The Journal of Allergy and Clinical Immunology In Practice · doi:10.1016/j.jaip.2023.04.015 · Cited by 50
Self-citationAutosomal Dominant STAT6 Gain of Function Causes Severe Atopy Associated with Lymphoma
Minskaia, E., Maimaris, J., Jenkins, P., Albuquerque, A. S., Hong, Y., Eleftheriou, D., Gilmour, K. C., Grace, R., Moreira, F., Grimbacher, B., et al. (2023) · Journal of Clinical Immunology · doi:10.1007/s10875-023-01530-7 · Cited by 45
Self-citationHuman germline gain-of-function in STAT6: from severe allergic disease to lymphoma and beyond
Sharma, M., Suratannon, N., Leung, D., Barış, S., Takeuchi, I., Samra, S., Yanagi, K., Duque, J. S. R., Benamar, M., Bel, K. L. D., et al. (2024) · Trends in Immunology · doi:10.1016/j.it.2023.12.003 · Cited by 45
Self-citationGenetic/Environmental Contributions and Immune Dysregulation in Children with Atopic Dermatitis
Chong, A. C., Visitsunthorn, K., & Ong, P. Y. (2022) · Journal of Asthma and Allergy · doi:10.2147/jaa.s293900 · Cited by 49
Successful treatment of JAK1-associated inflammatory disease
Fayand, A., Hentgen, V., Posseme, C., Lacout, C., Pïcard, C., Moguelet, P., Cescato, M., Sbeih, N., Moreau, T., Zhu, Y. Y. J., et al. (2023) · Journal of Allergy and Clinical Immunology · doi:10.1016/j.jaci.2023.06.004 · Cited by 39
Casanova, J. (2025) · Journal of Human Immunity · doi:10.70962/jhi.20250001 · Cited by 34
Self-citationThe Microbe, the Infection Enigma, and the Host
Casanova, J., & Abel, L. (2024) · Annual Review of Microbiology · doi:10.1146/annurev-micro-092123-022855 · Cited by 33
Self-citationMechanisms and therapeutic prospect of the JAK-STAT signaling pathway in liver cancer
Jia, J., Zhou, X. J., & Chu, Q. (2024) · Molecular and Cellular Biochemistry · doi:10.1007/s11010-024-04983-5 · Cited by 31
Update on inborn errors of immunity
IJspeert, H., Edwards, E. S. J., O’Hehir, R. E., Dalm, V. A. S. H., & van Zelm, M. C. (2024) · Journal of Allergy and Clinical Immunology · doi:10.1016/j.jaci.2024.12.1075 · Cited by 40
Update on the genetics of allergic diseases
Lawson, L. P., Parameswaran, S., Panganiban, R. A. M., Constantine, G. M., Weirauch, M. T., & Kottyan, L. C. (2025) · Journal of Allergy and Clinical Immunology · doi:10.1016/j.jaci.2025.03.012 · Cited by 33
Kostova, P., Papochieva, V. E., Miteva, D. S., Georgieva, B., Mileva, S., Shahid, M., Lukanov, T., & Petrova, G. (2023) · Antibodies · doi:10.3390/antib12040070 · Cited by 26
JAK / STAT defects and immune dysregulation, and guiding therapeutic choices
Chaimowitz, N. S., Smith, M. R., & Satter, L. F. (2024) · Immunological Reviews · doi:10.1111/imr.13312 · Cited by 27
TH2-driven manifestations of inborn errors of immunity
James, A. E., Abdalgani, M., Khoury, P., Freeman, A. F., & Milner, J. D. (2024) · Journal of Allergy and Clinical Immunology · doi:10.1016/j.jaci.2024.05.007 · Cited by 23
Self-citationCellular and molecular basis of proximal small intestine disorders
Bildstein, T., Charbit‐Henrion, F., Azabdaftari, A., Cerf–Bensussan, N., & Uhlig, H. H. (2024) · Nature Reviews Gastroenterology & Hepatology · doi:10.1038/s41575-024-00962-9 · Cited by 23
Vorsteveld, E. E., van der Made, C. I., Smeekens, S. P., Schuurs-Hoeijmakers, J. H. M., Astuti, G., Diepstra, H., Gilissen, C., Hoenselaar, E., Janssen, A., van Roozendaal, K. E. P., et al. (2024) · Clinical Immunology · doi:10.1016/j.clim.2024.110375 · Cited by 23
Self-citationSaito, H., Tamari, M., Motomura, K., Ikutani, M., Nakae, S., Matsumoto, K., & Morita, H. (2024) · Journal of Allergy and Clinical Immunology · doi:10.1016/j.jaci.2024.09.023 · Cited by 20
Golinska, M. A., Wołyniak, M., Kulesza, P., & Fendler, W. M. (2025) · Frontiers in Immunology · doi:10.3389/fimmu.2025.1621178 · Cited by 24
Inborn errors of immunity: A field without frontiers
Bucciol, G., Delafontaine, S., Meyts, I., & Poli, M. C. (2023) · Immunological Reviews · doi:10.1111/imr.13297 · Cited by 21
Self-citationNeuroimmune mechanisms of type 2 inflammation in the skin and lung
Tamari, M., & Ver Heul, A. M. (2025) · Allergology International · doi:10.1016/j.alit.2025.02.001 · Cited by 17
The genetics of hyper IgE syndromes
AlYafie, R. S., Velayutham, D., van Panhuys, N., & Jithesh, P. V. (2025) · Frontiers in Immunology · doi:10.3389/fimmu.2025.1516068 · Cited by 16
Primary atopic disorders: inborn errors of immunity causing severe allergic disease
Vaseghi‐Shanjani, M., Samra, S., Yousefi, P., Biggs, C. M., & Turvey, S. E. (2025) · Current Opinion in Immunology · doi:10.1016/j.coi.2025.102538 · Cited by 15
Self-citationPharmacological targeting of the JAK–STAT pathway: new concepts and emerging indications
Haikarainen, T., Virtanen, A. T., Cravatt, B. F., & Silvennoinen, O. (2026) · Nature Reviews Drug Discovery · doi:10.1038/s41573-025-01336-9 · Cited by 17
Giancotta, C., Colantoni, N., Pacillo, L., Santilli, V., Amodio, D., Manno, E. C., Cotugno, N., Rotulo, G. A., Rivalta, B., Finocchi, A., et al. (2023) · Frontiers in Pediatrics · doi:10.3389/fped.2023.1129249 · Cited by 14
Self-citationLiongue, C., Sobah, M. L., & Ward, A. C. (2023) · Biomedicines · doi:10.3390/biomedicines12010045 · Cited by 15
Genetic and Molecular Contributors in Eosinophilic Esophagitis
Sato, H., Osonoi, K., Sharlin, C. S., & Shoda, T. (2023) · Current Allergy and Asthma Reports · doi:10.1007/s11882-023-01075-0 · Cited by 14
Toth, K. A., Schmitt, E. G., & Cooper, M. A. (2023) · The Journal of Immunology · doi:10.4049/jimmunol.2200905 · Cited by 13
Atopic manifestations of inborn errors of immunity
Sams, L. A., Wijetilleka, S., Ponsford, M., Gennery, A. R., & Jolles, S. R. A. (2023) · Current Opinion in Allergy and Clinical Immunology · doi:10.1097/aci.0000000000000943 · Cited by 13
IL4Rα and IL17A Blockade Rescue Autoinflammation in SOCS1 Haploinsufficiency
Gruber, C. N., Lee, A. E., Buta, S., Khattri, S., Gottlieb, A. B., Frost, J., Bowcock, A. M., Ho, H.-E., & Bogunovic, D. (2023) · Journal of Clinical Immunology · doi:10.1007/s10875-023-01635-z · Cited by 12
Taietti, I., Catamerò, F., Lodi, L., Giovannini, M., & Castagnoli, R. (2025) · Current Opinion in Allergy and Clinical Immunology · doi:10.1097/aci.0000000000001059 · Cited by 12
Arnau‐Soler, A., Ashley, S., Ghauri, A., Jeanrenaud, A. C. S. N., Marenholz, I., Blümchen, K., Cibin, P., Iakupova, A., Hübner, N., Beyer, K., et al. (2025) · Allergy · doi:10.1111/all.16627 · Cited by 12
T-helper-2 cells and atopic disease: lessons learnt from inborn errors of immunity
Ma, C. S. (2023) · Current Opinion in Immunology · doi:10.1016/j.coi.2023.102298 · Cited by 11
IL‐4/IL‐13 pathway in nasal type 2 inflammation: The central role and targeted therapy
Zhu, Z., Zhao, C., & Wang, M. (2024) · Eye & ENT Research · doi:10.1002/eer3.5 · Cited by 11
Interplay between epigenetic and genetic alterations in inborn errors of immunity
Rodríguez‐Ubreva, J., Calvillo, C. L., Satter, L. F., & Ballestar, E. (2023) · Trends in Immunology · doi:10.1016/j.it.2023.09.005 · Cited by 11
Anaphylaxis biomarkers: present and future
Pampura, A. N., Esakova, N. V., Zimin, S., & Filippova, E. (2024) · European Annals of Allergy and Clinical Immunology · doi:10.23822/eurannaci.1764-1489.350 · Cited by 10
Kim, K. C., Jeong, G. H., Bang, C. H., & Lee, J. H. (2024) · International Journal of Molecular Sciences · doi:10.3390/ijms252413539 · Cited by 10
Self-citationAtopic dermatitis and lymphoma risk: a systematic review and meta-analysis
Tian, Y., Li, Y., Yang, C., Yuan, G., Peng, B., Su, L., & Wu, J. (2025) · Frontiers in Oncology · doi:10.3389/fonc.2025.1580550 · Cited by 9
Transcription factor defects in inborn errors of immunity with atopy
Vaseghi‐Shanjani, M., Yousefi, P., Sharma, M., Samra, S., Sifuentes, E., Turvey, S. E., & Biggs, C. M. (2023) · Frontiers in Allergy · doi:10.3389/falgy.2023.1237852 · Cited by 9
Self-citationWu, Z., Lian, G., He, L., Hu, P., Guo, Y., & Su, Z. (2026) · Immunology and Cell Biology · doi:10.1111/imcb.70078 · Cited by 8
Genetic landscape of atopic dermatitis
Paternoster, L. (2024) · Current Opinion in Allergy and Clinical Immunology · doi:10.1097/aci.0000000000001005 · Cited by 8
Faguer, S., Delabesse, É., Paul, C. F., & Pasquet, M. (2023) · Journal of Clinical Immunology · doi:10.1007/s10875-023-01639-9 · Cited by 8
Regulation of eosinophil recruitment and heterogeneity during allergic airway inflammation
Graf, L.-M., Radtke, D., & Voehringer, D. (2025) · Frontiers in Allergy · doi:10.3389/falgy.2025.1585142 · Cited by 7
Selected inborn errors of immunity associated with severe atopic phenotypes
Bellanti, J. A. (2025) · Annals of Allergy Asthma & Immunology · doi:10.1016/j.anai.2025.05.024 · Cited by 7
Cardinale, F., Taietti, I., Sgrulletti, M., Pacillo, L., Moschese, V., Cancrini, C., Badolato, R., del Giudice, M. M., Marseglia, G. L., Chiappini, E., et al. (2025) · Pediatric Allergy and Immunology · doi:10.1111/pai.70225 · Cited by 7
Self-citationKeeping up with recent developments in immunodeficiency
Tsoulis, M. W., & Williams, K. W. (2024) · Annals of Allergy Asthma & Immunology · doi:10.1016/j.anai.2024.12.016 · Cited by 8
Loss of tolerance to dietary proteins: From mouse models to human model diseases
Levescot, A., & Cerf–Bensussan, N. (2024) · Immunological Reviews · doi:10.1111/imr.13395 · Cited by 8
Svetina, M., Kunej, T., Korošec, P., & Rijavec, M. (2025) · Clinical Reviews in Allergy & Immunology · doi:10.1007/s12016-025-09069-8 · Cited by 7
Common variable immunodeficiency, cross currents, and prevailing winds
Romberg, N. D., & Coz, C. L. (2023) · Immunological Reviews · doi:10.1111/imr.13291 · Cited by 9
Rao, G., Mack, C. D., Nguyen, T., Wong, N. S. M., Payne, K. J., Worley, L., Gray, P. E., Wong, M., Hsu, P. S., Stormon, M., et al. (2024) · Journal of Allergy and Clinical Immunology · doi:10.1016/j.jaci.2024.11.031 · Cited by 6
Self-citationSTATs, promising targets for the treatment of autoimmune and inflammatory diseases
He, X., Liu, P., Luo, Y., Fu, X.-Y., & Yang, T. (2024) · European Journal of Medicinal Chemistry · doi:10.1016/j.ejmech.2024.116783 · Cited by 5
Tangye, S. G., Mackie, J., Pathmanandavel, K., & Ma, C. S. (2023) · Immunological Reviews · doi:10.1111/imr.13288 · Cited by 5
Precision care in the treatment of pediatric asthma
Mahmood, L. Z., Keskin, S., & Jefferson, A. A. (2024) · Current Opinion in Pediatrics · doi:10.1097/mop.0000000000001343 · Cited by 5
Samra, S., Cook, E., Wilson, J., Sharma, M., Golding, L., Yao, D. T., Marsh, R. A., & Turvey, S. E. (2025) · Journal of Allergy and Clinical Immunology Global · doi:10.1016/j.jacig.2025.100494 · Cited by 4
Self-citationSzczawińska-Popłonyk, A. (2025) · Immunologic Research · doi:10.1007/s12026-025-09708-4 · Cited by 4
Selective Targeting of STAT6: Recent Advances and Future Perspectives
Liu, H., Ma, F., Wang, Z., Li, Z. A., Bian, J., Yuan, Z., & Wu, T. (2026) · Medicinal Research Reviews · doi:10.1002/med.70069 · Cited by 4
NGS data analysis for molecular diagnosis of Inborn Errors of Immunity
Yang, X., Yang, W., & Lau, Y. (2024) · Seminars in Immunology · doi:10.1016/j.smim.2024.101901 · Cited by 4
Self-citationMa, C. S., & Tangye, S. G. (2023) · Clinical & Experimental Immunology · doi:10.1093/cei/uxad039 · Cited by 4
Learning while treating: Gain-of-function STAT6 variants in severe allergic disease
Smith, T., & Doherty, T. A. (2023) · Cell Reports Medicine · doi:10.1016/j.xcrm.2023.101040 · Cited by 4
STAT6 joins the gain-of-function club
Chen, K., Ochs, H. D., & Allenspach, E. J. (2023) · Journal of Allergy and Clinical Immunology · doi:10.1016/j.jaci.2023.05.003 · Cited by 4
Gut mucosal immune responses – Implications for celiac disease and food allergy
Abadie, V. (2025) · Seminars in Immunology · doi:10.1016/j.smim.2025.101984 · Cited by 4
Inborn errors of immunity with atopic phenotype: what we know so far
Taietti, I., Cenzato, F., Brambilla, I., Marseglia, G. L., Licari, A., & Castagnoli, R. (2025) · Expert Review of Clinical Immunology · doi:10.1080/1744666x.2025.2575361 · Cited by 3
Eosinophilic Esophagitis: Mechanisms of Disease and Approach to Treatment
Gautam, R., & Ruffner, M. A. (2026) · Current Allergy and Asthma Reports · doi:10.1007/s11882-026-01253-w · Cited by 5
Human germline biallelic loss-of-function OSMR variants cause severe allergic disease
Samra, S., Sharma, M., Körholz, J., Liu, Y., James, A. E., Michalski, C., Yousefi, P., Bel, K. L. D., Lu, H. Y., Sharma, A. A., et al. (2026) · Journal of Human Immunity · doi:10.70962/jhi.20260067 · Cited by 3
Self-citationNot just another klass (JAK) of inhibitors for allergies
Brooks, W. H., & Renaudineau, Y. (2024) · Journal of Allergy and Hypersensitivity Diseases · doi:10.1016/j.jahd.2024.100001 · Cited by 3
Advances in asthma and allergic disease genetics
Schoettler, N. (2024) · Current Opinion in Allergy and Clinical Immunology · doi:10.1097/aci.0000000000001056 · Cited by 4
Zhu, W. S., Litterman, A. J., Sekhon, H., Kageyama, R., Arce, M. M., Taylor, K. E., Zhao, W., Criswell, L. A., Zaitlen, N., Erle, D. J., et al. (2023) · Genome biology · doi:10.1186/s13059-023-03125-2 · Cited by 2
Vandermeulen, M. D., Khaiwal, S., Rubio, G., Liti, G., & Cullen, P. J. (2024) · iScience · doi:10.1016/j.isci.2024.110860 · Cited by 2
Inborn Errors of Immunity in Apoptosis
Makkoukdji, N., Satnarine, T., de Almeida, A. X., Wyke, M., Kim, I., Kleiner, G., & Gans, M. D. (2025) · Frontiers in Bioscience-Landmark · doi:10.31083/fbl27231 · Cited by 3
Demirkaya, D. B., Colak, B. C., Sefer, A. P., & Barış, S. (2025) · Expert Review of Clinical Immunology · doi:10.1080/1744666x.2025.2543475 · Cited by 3
Modulation of STAT6 signaling for hepatoprotection
Somm, E., Rahman, M., Szántó, I., Gariani, K., & Jornayvaz, F. R. (2025) · Frontiers in Pharmacology · doi:10.3389/fphar.2025.1659227 · Cited by 4
STAT wars: how STATopathies sabotage innate immunity
Bloomfield, M., Šabatková, K., & Paračková, Z. (2026) · Current Opinion in Allergy and Clinical Immunology · doi:10.1097/aci.0000000000001139 · Cited by 2
Andersen, S. H., Assing, K., Jensen, J. B., Rasmussen, L. D., Laursen, C. B., Dellgren, C., Hinke, D. M., Degn, S. E., & Mogensen, T. H. (2026) · Journal of Human Immunity · doi:10.70962/jhi.20250119 · Cited by 2
Clinical heterogeneity and endotype stratification in eosinophilic esophagitis
Shoda, T., & Ruffner, M. A. (2026) · Annals of Allergy Asthma & Immunology · doi:10.1016/j.anai.2026.04.019 · Cited by 2
Understanding the Type 2 Immunity: An Evolving View Beyond Allergic Diseases
Jiménez‐Saiz, R., Iborra, S., Blanco, C., González‐Pérez, R., Nuñez‐Borque, E., Zeyneloglu, C., Babayev, H., Göksel, Ö., Göksel, T., Khaitov, M. R., et al. (2026) · Allergy · doi:10.1111/all.70512 · Cited by 2
He, J., Zhang, S., Kang, Y., Zhang, Y., Zheng, Z., & Ruan, M. (2024) · Open Life Sciences · doi:10.1515/biol-2022-0853 · Cited by 2
Decoding Immunobiology Through Genetic Errors of Immunity
Bender, M. J., & Lucas, C. L. (2025) · Annual Review of Immunology · doi:10.1146/annurev-immunol-082323-124920 · Cited by 2
Pathological IgE Production in Inborn Errors of Immunity and Beyond
Ma, C. S., & Hsu, P. S. (2025) · Immunological Reviews · doi:10.1111/imr.70053 · Cited by 2
Vorsteveld, E. E., van der Made, C. I., Smeekens, S. P., Schuurs-Hoeijmakers, J. H. M., Astuti, G., Diepstra, H., Gilissen, C., Hoenselaar, E., Janssen, A., van Roozendaal, K. E. P., et al. (2024) · medRxiv · doi:10.1101/2024.06.14.24308832 · Cited by 2
Self-citationHuman germline biallelic loss-of-function OSMR variants cause severe allergic diseasePreprint
Sharma, M., Samra, S., Liu, Y., James, A. E., Michalski, C., Yousefi, P., Bel, K. L. D., Lu, H. Y., Sharma, A., Tarailo‐Graovac, M., et al. (2025) · medRxiv · doi:10.1101/2025.08.05.25332527 · Cited by 2
Self-citationHuman Immunodeficiencies Caused by Inborn Errors of B-Cell Development or Function
Tangye, S. G., Casanova, J., & Ma, C. S. (2024) · Elsevier eBooks · doi:10.1016/b978-0-323-95895-0.00013-1 · Cited by 1
Self-citationCytokine signaling defects in primary atopic diseases—an updated review
Thakur, V., Pilania, R. K., Sharma, A., Sharma, S., Mario, A. T., Goyal, T., Sharma, M., Vaitheeswaran, G. C., Vignesh, P., Singh, S., et al. (2025) · Frontiers in Allergy · doi:10.3389/falgy.2025.1617714 · Cited by 1
Self-citationRare germline JAK/STAT variants in a Korean cohort amplify innate immune responses to vaccination
Lee, H., Cho, G., Huh, J. W., Furth, P. A., Kim, J., & Hennighausen, L. G. (2025) · iScience · doi:10.1016/j.isci.2025.114110 · Cited by 2
CPA3 drives the development of asthma by promoting the activation of the JAK/STAT6 pathway
Wang, K., Wu, R. Y., Fan, M., Jia, R., Liu, Y., Li, Y., Li, P., Wang, Y., Jiang, T., & Cheng, Z. (2025) · Respiratory Research · doi:10.1186/s12931-025-03456-7 · Cited by 1
JAK-STAT signaling: molecular mechanism and targeted treatment in dento-maxillofacial abnormalities
Huang, Z., Cui, Y., Zhang, W., Shen, J., Dai, Q., Sun, S., & Jiang, L. (2026) · International Journal of Oral Science · doi:10.1038/s41368-025-00399-z · Cited by 1
Zhang, S., Xiong, S., Liu, X., Cao, J., Yue, N., & Wu, C. (2026) · Annals of Hematology · doi:10.1007/s00277-026-06932-2 · Cited by 1
Primary atopic disorders: Monogenic insights into immunity
Modi, B. P., McDonald, C., Golding, L., da Silva, L. B. R., Biggs, C. M., Körholz, J., James, E. L., & Turvey, S. E. (2026) · Journal of Human Immunity · doi:10.70962/jhi.20260006 · Cited by 3
Self-citationJanus Kinase Inhibitors in Treatment of Primary Immune Regulatory Disorders
Alsaati, N., & Satter, L. F. (2026) · The Journal of Allergy and Clinical Immunology In Practice · doi:10.1016/j.jaip.2026.05.019 · Cited by 1
Eczema in inborn errors of immunity with atopy: frequency, timing and phenotypic clustering
Aubert, H., Mahlaoui, N., Barbarot, S., Alligon, M., Pellier, I., Mallebranche, C., Bustamante, J. C., Rosain, J., Pïcard, C., Néel, A., et al. (2026) · British Journal of Dermatology · doi:10.1093/bjd/ljag308 · Cited by 1
An updated patent review of STAT6 inhibitors and modulators (2020 – present)
Khan, M. Z. I., Du, B.-Q., Xue, M., Yu, M.-Q., Li, S.-R., 王建设, Wang, C.-C., & Ye, X. (2026) · Expert Opinion on Therapeutic Patents · doi:10.1080/13543776.2026.2713551 · Cited by 1
Tang, R., Lyu, X., Sun, J., & Li, H. (2024) · Endocrine Metabolic & Immune Disorders - Drug Targets · doi:10.2174/0118715303285101240118062549 · Cited by 1
Targeting the common pathway: IL-4/IL-13 blockade across the spectrum of primary atopic disorders
van Konijnenburg, D. P. H., & Platt, C. D. (2025) · Journal of Allergy and Clinical Immunology · doi:10.1016/j.jaci.2025.08.019 · Cited by 1
Vaseghi‐Shanjani, M., Eigenmann, P., Riggioni, C., & Turvey, S. E. (2026) · Pediatric Allergy and Immunology · doi:10.1111/pai.70356 · Cited by 1
Self-citationKim, M.-J., Lee, S., & Kang, K.-S. (2026) · Experimental & Molecular Medicine · doi:10.1038/s12276-026-01840-x
Metadata
- Authors
- Sharma, M., Leung, D., Momenilandi, M., Jones, L. C. W., Pacillo, L., James, A. E., Murrell, J. R., Delafontaine, S., Maimaris, J., Vaseghi-Shanjani, M., Del Bel, K. L., Lu, H. Y., Chua, G. T., Di Cesare, S., Fornes, O., Liu, Z., Di Matteo, G., Fu, M. P., Amodio, D., Tam, I. Y. S., Chan, G. S. W., Sharma, A. A., Dalmann, J., van der Lee, R., Blanchard-Rohner, G., Lin, S., Philippot, Q., Richmond, P. A., Lee, J. J., Matthews, A., Seear, M., Turvey, A. K., Philips, R. L., Brown-Whitehorn, T. F., Gray, C. J., Izumi, K., Treat, J. R., Wood, K. H., Lack, J., Khleborodova, A., Niemela, J. E., Yang, X., Liang, R., Kui, L., Wong, C. S. M., Poon, G. W. K., Hoischen, A., van der Made, C. I., Yang, J., Chan, K. W., Rosa Duque, J. S. D., Lee, P. P. W., Ho, M. H. K., Chung, B. H. Y., Le, H. T. M., Yang, W., Rohani, P., Fouladvand, A., Rokni-Zadeh, H., Changi-Ashtiani, M., Miryounesi, M., Puel, A., Shahrooei, M., Finocchi, A., Rossi, P., Rivalta, B., Cifaldi, C., Novelli, A., Passarelli, C., Arasi, S., Bullens, D., Sauer, K., Claeys, T., Biggs, C. M., Morris, E. C., Rosenzweig, S. D., O’Shea, J. J., Wasserman, W. W., Bedford, H. M., van Karnebeek, C. D. M., Palma, P., Burns, S. O., Meyts, I., Casanova, J.-L., Lyons, J. J., Parvaneh, N., Nguyen, A. T. V., Cancrini, C., Heimall, J., Ahmed, H., McKinnon, M. L., Lau, Y. L., Béziat, V., & Turvey, S. E.
- Affiliations
- University of British Columbia (CA)
- University of Hong Kong (HK)
- Hôpital Necker-Enfants Malades (FR)
- University of Rome Tor Vergata (IT)
- National Institutes of Health (US)
- Children's Hospital of Philadelphia (US)
- Universitair Ziekenhuis Leuven (BE)
- Royal Free London NHS Foundation Trust (GB)
- Dept. of Pediatrics, BC Children’s Hospital, University of British Columbia 1 , Vancouver, Canada
- Broad Institute (US)
- Union Hospital (HK)
- Dept. of System Medicine, Pediatric Chair, University of Tor Vergata 5 , Rome, Italy
- Centre for Molecular Medicine and Therapeutics, BC Children’s Hospital Research Institute 18 , Vancouver, Canada
- Academic Dept. of Pediatrics (DPUO), 6 , Rome, Italy
- Bambino Gesù Children's Hospital (IT)
- Queen Mary Hospital (CN)
- Emory University (US)
- University of Toronto (CA)
- University of Pennsylvania (US)
- National Institutes of Health Clinical Center (US)
- University of California San Diego (US)
- Radboud University Medical Center (NL)
- Dept. of Paediatrics and Adolescent Medicine, School of Clinical Medicine, The University of Hong Kong 2 , Hong Kong, China
- Vinmec Times City International Hospital (VN)
- Children's Medical Center (IR)
- Lorestan University of Medical Sciences (IR)
- Dept. of Medical Biotechnology, School of Medicine, Zanjan University of Medical Sciences 41 , Zanjan, Iran
- School of Mathematics, Institute for Research in Fundamental Sciences 42 , Tehran, Iran
- Shahid Beheshti University (IR)
- KU Leuven (BE)
- AZ Sint-Jan (BE)
- BC Children's Hospital Research Institute (CA)
- Amsterdam University Medical Centers (NL)
- Vietnam National Children's Hospital (VN)
- McMaster University (CA)
- Corresponding author
- Sharma, Mehul
- Turvey, Stuart E.
- ORCID
- Sharma, Mehul
- Leung, Daniel
- Momenilandi, Mana
- Jones, Lauren C.W.
- Pacillo, Lucia
- James, Alyssa E.
- Murrell, Jill R.
- Delafontaine, Selket
- Maimaris, Jesmeen
- Vaseghi-Shanjani, Maryam
- Del Bel, Kate L.
- Lu, Henry Y.
- Chua, Gilbert T.
- Di Cesare, Silvia
- Fornes, Oriol
- Liu, Zhongyi
- Di Matteo, Gigliola
- Fu, Maggie P.
- Amodio, Donato
- Tam, Issan Yee San
- Chan, Gavin Shueng Wai
- Sharma, Ashish A.
- Dalmann, Joshua
- van der Lee, Robin
- Blanchard-Rohner, Géraldine
- Lin, Susan
- Philippot, Quentin
- Richmond, Phillip A.
- Lee, Jessica J.
- Matthews, Allison
- Seear, Michael
- Turvey, Alexandra K.
- Philips, Rachael L.
- Brown-Whitehorn, Terri F.
- Gray, Christopher J.
- Izumi, Kosuke
- Treat, James R.
- Wood, Kathleen H.
- Lack, Justin
- Khleborodova, Asya
- Niemela, Julie E.
- Yang, Xingtian
- Liang, Rui
- Kui, Lin
- Wong, Christina Sze Man
- Poon, Grace Wing Kit
- Hoischen, Alexander
- van der Made, Caspar I.
- Yang, Jing
- Chan, Koon Wing
- Rosa Duque, Jaime Sou Da
- Lee, Pamela Pui Wah
- Ho, Marco Hok Kung
- Chung, Brian Hon Yin
- Le, Huong Thi Minh
- Yang, Wanling
- Rohani, Pejman
- Fouladvand, Ali
- Rokni-Zadeh, Hassan
- Changi-Ashtiani, Majid
- Miryounesi, Mohammad
- Puel, Anne
- Shahrooei, Mohammad
- Finocchi, Andrea
- Rossi, Paolo
- Rivalta, Beatrice
- Cifaldi, Cristina
- Novelli, Antonio
- Passarelli, Chiara
- Arasi, Stefania
- Bullens, Dominique
- Sauer, Kate
- Claeys, Tania
- Biggs, Catherine M.
- Morris, Emma C.
- Rosenzweig, Sergio D.
- O’Shea, John J.
- Wasserman, Wyeth W.
- Bedford, H. Melanie
- van Karnebeek, Clara D.M.
- Palma, Paolo
- Burns, Siobhan O.
- Meyts, Isabelle
- Casanova, Jean-Laurent
- Lyons, Jonathan J.
- Parvaneh, Nima
- Nguyen, Anh Thi Van
- Cancrini, Caterina
- Heimall, Jennifer
- Ahmed, Hanan
- McKinnon, Margaret L.
- Lau, Yu Lung
- Béziat, Vivien
- Turvey, Stuart E.
- Venue
- Journal of Experimental Medicine
- Publisher
- Rockefeller University Press
- Published
- 2023-03-08
- Volume
- 220
- Issue
- 5
- ISSN
- 0022-1007 (ISSN-L)
- 1540-9538
- PMC
- PMC10037107
- OpenAlex
- W4323533826
- Cited by
- 125
- References
- 130
- Citations by year
- 2026: 31 · 2025: 33 · 2024: 33 · 2023: 26
- FWCI
- 14.14
- Type
- journal article
- Language
- en
- Open access
- hybrid
- doi.org
- Licence
- Locations
- The Journal of Experimental Medicine (publishedVersion, cc-by)
- medRxiv (acceptedVersion, cc-by-nc-nd)
- PubMed Central (publishedVersion, cc-by)
- PubMed (publishedVersion)
- HAL (submittedVersion, cc-by)
- Cineca Institutional Research Information System (Tor Vergata University) (submittedVersion, cc-by)
- UCL Discovery (University College London) (submittedVersion, cc-by)
- Lirias (KU Leuven) (submittedVersion, cc-by)
- Radboud Repository (Radboud University) (submittedVersion)
- Radboud Repository (Radboud University) (submittedVersion, other-oa)
- eScholarship (California Digital Library) (submittedVersion, cc-by)
- The HKU Scholars Hub (University of Hong Kong) (submittedVersion)
- Pure Amsterdam UMC (submittedVersion, cc-by)
- Archive ouverte UNIGE (University of Geneva) (submittedVersion, other-oa)
- Funders
- Canadian Institutes of Health Research (PJT 178054)
- Genome British Columbia (SIP007)
- BC Children’s Hospital Foundation
- Canada Research Chair
- CIHR Frederick Banting
- University of British Columbia
- Charles Best Canada Graduate Scholarships Doctoral Award
- BC Children’s Hospital Research Institute
- Vanier Canada
- Elizabeth Paige Lavin Endowed Chair
- National Institute of Allergy and Infectious Diseases
- National Institutes of Health
- Howard Hughes Medical Institute
- Rockefeller University
- St. Giles Foundation
- French National Research Agency (ANR-10-IAHU-01, ANR CARMIL2, ANR-21-CE15-0034)
- Integrative Biology of Emerging Infectious Diseases Laboratory of Excellence (ANR-10-LABX-62-IBEID)
- French Foundation for Medical Research (EQU201903007798)
- Square Foundation
- Institut National de la Santé et de la Recherche Médicale
- Paris University Cité
- Children’s Hospital Bambino Gesù
- Italian Ministry of Health (NET-2011-02350069)
- PENTA Foundation UK
- ViiV Healthcare UK
- Society for the Relief of Disabled Children
- Jeffrey Modell Foundation
- Chung Ko Lee and Cheung Yuen Kan Education and Research Fund
- Croucher Foundation
- Edward & Yolanda Wong Fund
- Instituts Thématiques Multiorganismes
- Institut National du Cancer
- Topics
- Life Sciences › Immunology and Microbiology › Immunology › Immunodeficiency and Autoimmune Disorders
- Health Sciences › Medicine › Pulmonary and Respiratory Medicine › Asthma and respiratory diseases
- Health Sciences › Medicine › Dermatology › Dermatology and Skin Diseases
- Keywords
- STAT6, gain-of-function mutations, germline mutations, allergic diseases, atopic dermatitis, hypereosinophilia, eosinophilic gastrointestinal disorders, asthma, IgE-mediated food allergy, anaphylaxis, Th2 polarization, dupilumab, autosomal dominant inheritance, STAT6 phosphorylation
- MeSH terms
- Gain of Function Mutation, Asthma, Food Hypersensitivity, Humans, Immunoglobulin E, STAT6 Transcription Factor
About these checks
Registry, retraction, Cites and statistics results are computed, not judged, with one exception: a printed reference that no index lists is read once by a model before it counts as a citation error. Claims are extracted by a model and kept only when their quote appears verbatim in the text; each cited source is then checked, with a model’s help, for whether it says what the claim relies on. Those verdicts can be wrong — read the claim’s quote and the cited source before relying on one.
Statistics and arithmetic are recomputed, not judged.
Confidence bands are shown only for fields calibrated on our annotated test set. None is calibrated yet, so no band is shown.
What counts as a claim ›How we measure confidence ›How we check this ›
Are you an author, or do you see a problem with this page? Request a review
