

Integrated photonic quantum walks
Open accessThe DOI matches its Crossref record; 166 of the 174 references it cites were found in a registry or an index; 24 of the 44 sources its claims cite were checked for support.
Abstract
Quantum walks (QWs) are one of the fundamental concepts in quantum information science, being an essential component for various new applications. Implementing QWs using integrated photonic waveguide lattices allows for realizing long evolution times, for exploring novel lattice geometries, and even for controllable coupling to the environment. This tutorial gives an introduction to the field of on-chip QWs of single photons and photon pairs featuring non-classical two-photon correlations.
Overview
CoChat Summary
TL;DR
This tutorial reviews integrated photonic quantum walks implemented in waveguide lattices, covering discrete- and continuous-time dynamics of single photons and photon pairs. It explains fabrication, photon-pair generation/detection, and nonclassical correlation phenomena including W-states, perfect state transfer, Anderson localization, Bloch oscillations, and non-Hermitian QWs.
Key findings
- Integrated photonic lattices allow long evolution times, 3D geometries, and controllable coupling; direct laser-written waveguides have refractive-index increase ~10^-3, straight-section losses 0.3–0.9 dB cm^-1, and cm-scale bending radii, while silica-on-silicon offers 0.1 dB cm^-1 but only 2D structures.
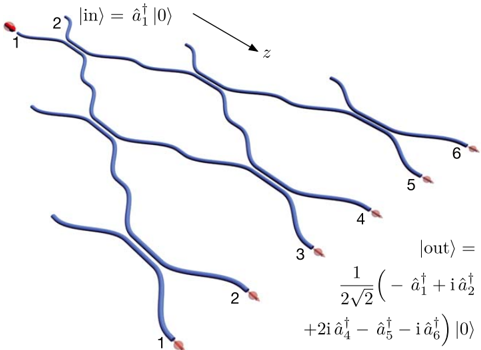
- In discrete-time single-photon QWs, a 31-step DC mesh shows quantum interference: after three steps the photon has vanishing probability in channel 3, and unlike the binomial Galton-board output, the walker most likely emerges opposite the input; adding random phases after each DC (uniform [0,π], averaged over 20,000 realizations) washes out ballistic lobes into a diffusive/binomial/Gaussian distribution.
- Two-photon QWs exhibit nonclassical correlations: a 50:50 DC produces HOM interference with measured visibility approximately 96.4%; separable indistinguishable photons show bunching, path-entangled input shows anti-bunching, and distinguishable photons show four characteristic correlation peaks.
- The tutorial reports on-chip W-state generation up to N=16, perfect state transfer in a 19-waveguide J_x lattice (input guide 1↔19, 2↔18), Anderson colocalization in 101-site disordered arrays with N=20 input, Bloch oscillations with revival success probability >92% in a 16-waveguide lattice, and non-Hermitian quasi-PT-symmetric lattices where transport becomes diffusive and row sums of the correlation function no longer equal average particle number.
Methods
- Design: tutorial/review with theoretical derivations and discussion of experiments; introduces discrete-time QWs via directional couplers and continuous-time QWs via evanescently coupled waveguide arrays; uses Heisenberg and quantum Langevin equations, unitary evolution operator, and correlation functions.
- Data/sample: no new primary dataset; draws on cited integrated-photonic experiments, including an AlGaAs 100-waveguide array, a 31-step DC mesh, a 5-waveguide W-state array, a 19-waveguide J_x lattice, 101-site disordered arrays, a 16-waveguide BO lattice, and non-Hermitian arrays. Photon pairs are generated by SPDC and detected by APDs, SNSPDs, or TESs.
- Main analysis: analytical/numerical modeling of photon number and two-photon correlation functions, compared with experimental coincidence/correlation maps; nonclassicality is assessed via Bell-like inequalities and a visibility threshold (above 50% ensures nonclassical quantum interference).
Limitations
- Stated in the paper: full on-chip integration of source, waveguide chip, and detection has not been realized; losses between source, chip, and detectors due to mode-size mismatch can be minimized with thermally enhanced core fibers and adiabatic inscription. Direct laser-written waveguides have moderate index increase (~10^-3), cm-scale bending radii, and 0.3–0.9 dB cm^-1 losses; silica-on-silicon is limited to 2D. Detection limitations include APDs cannot resolve multiple simultaneous photons and InGaAs telecom versions have enhanced noise/low efficiency; SNSPDs require <4 K; TESs require ~100 mK, have lower count rates, and photon-number discrimination degrades for higher N. The tutorial also states its generation/detection overview is brief and not essential to the principles.
- Evident from the text: the manuscript is a tutorial/review rather than a primary research report, so its quantitative “findings” are syntheses of cited experiments rather than a single new experimental dataset.
Model-written summary. Check it against the paper before relying on it.
Integrity signals
Registry
Cites
Statistics
Figures




Verification
Claims the paper makes
13 Valid · 4 Not valid · 15 Not checked · 44 Own results and interpretations
Some cited sources support this claim and some don’t — read each source’s verdict below.
In the paper
“An interesting fact is that such lattices do not feature ballistic evolution of the average photon number, but rather diffusion [24,76].”
§ Integrated photonic quantum walks > = å
What the sources say
- Partly supportedcites [24] Gräfe M, Heilmann R, Keil R, Eichelkraut T, Heinrich M, Nolte S and Szameit A 2013 Correlations of indistinguishable particles in non-Hermitian lattices New J. Phys. 15 033008 sourceExperimental — accuracy not yet measured
In §3, Numerical investigations (page not available), the paper reports diffusive wave evolution in quasi-PT-symmetric lattices: the wave-packet variance grows linearly with propagation. It does not establish that the average photon number itself evolves diffusively rather than ballistically; that is a different quantity. (LLM, conf=0.84)
- Disputedcites [76] Eichelkraut T, Heilmann R, Weimann S, Stützer S, Dreisow F, Christodoulides D N, Nolte S and Szameit A 2013 Mobility transition from ballistic to diffusive transport in non-Hermitian lattices Nat. Commun. 4 2533 sourceExperimental — accuracy not yet measured
The Figure 2 caption (Waveguide fabrication; page not provided) says the quasi-PT-symmetric system initially shows ballistic spreading and becomes diffusive only at larger propagation distances. The Theory section likewise describes a transition from initially ballistic to diffusive transport, rather than an absence of ballistic evolution. These passages concern wave-packet spreading, not average photon number. (LLM, conf=0.88)
Checked by a reasoning model — may be wrong.
plainstates a cause- Asserted: passes — The authors put it forward as true.
- Checkable: passes — It can be checked against evidence.
- Load-bearing: unclear — It is unclear whether the paper’s conclusions depend on it.
- Based: passes — The paper gives a reason why it holds.
- Partly supported
At least one cited source doesn’t support this claim or points to a different paper, and none confirmed it — see the verdicts below.
In the paper
“In contrast, this does not hold for the two-photon correlation functions.”
§ Integrated photonic quantum walks > 6.1. Disordered lattices and Anderson localization
What the sources say
- Disputedcites [116] Lahini Y, Bromberg Y, Christodoulides D N and Silberberg Y 2010 Quantum correlations in two-particle Anderson localization Phys. Rev. Lett. 105 163905 sourceExperimental — accuracy not yet measured
The paper says the two-particle correlation function has a localized component (Fig. 2, p. 2), and that at longer times localized particles exhibit correlations within the localization length (p. 1). It distinguishes the correlations’ spatial structure from the localized particle density; it does not say the correlations fail to localize. (LLM, conf=0.83)
Checked by a reasoning model — may be wrong.
plain- Asserted: passes — The authors put it forward as true.
- Checkable: passes — It can be checked against evidence.
- Load-bearing: passes — The paper’s conclusions depend on it.
- Based: passes — The paper gives a reason why it holds.
- Disputed
The cited sources support only part of this claim — read each source’s verdict below.
In the paper
“Inspired by spin chains [100-102] (see figure 12(a)), by tailoring the hopping rates between the waveguides of an array to match the matrix elements of the J x angular momentum operator, such a task becomes possible.”
§ Integrated photonic quantum walks > 5.3. Perfect state transfer in a J x lattice
What the sources say
- Partly supportedcites [100] Bose S 2003 Quantum communication through an unmodulated spin chain Phys. Rev. Lett. 91 207901 sourceExperimental — accuracy not yet measured
The paper reports perfect state transfer for certain short spin chains (p. 3), so it supports that limited outcome. But its open-chain model uses equal-strength nearest-neighbor interactions (p. 2); it does not describe waveguide hopping rates tailored to Jₓ matrix elements as the means of achieving transfer. (LLM, conf=0.83)
- Could not verifycites [101] Pazy E, Biolatti E, Calarco T, D'Amico I, Zanardi P, Rossi F and Zoller P 2003 Spin-based optical quantum computation via Pauli blocking in semiconductor quantum dots Europhys. Lett. 62 175 sourceExperimental — accuracy not yet measured
The indexed passages (labeled Abstract; page unavailable) describe laser-controlled gates in semiconductor quantum dots, not hopping between waveguides. Searches for J_x, waveguide hopping rates, and spin-chain state transfer found no passage addressing the claimed method of perfect state transfer. (LLM, conf=0.76)
- Partly supportedcites [102] Christandl M, Datta N, Ekert A and Landahl A J 2004 Perfect state transfer in quantum spin networks Phys. Rev. Lett. 92 187902 sourceExperimental — accuracy not yet measured
The paper shows that engineering inter-qubit couplings in a linear spin chain to match an angular-momentum operator yields perfect state transfer (p. 3). It does not study hopping rates between waveguides, so the waveguide-array application is not established by this source. (LLM, conf=0.86)
hedgedstates a cause- Asserted: passes — The authors put it forward as true.
- Checkable: passes — It can be checked against evidence.
- Load-bearing: passes — The paper’s conclusions depend on it.
- Based: passes — The paper gives a reason why it holds.
- Partly supported
The cited sources support only part of this claim — read each source’s verdict below.
In the paper
“In the case of a separable input state both photons tend to occupy the same channel localized around the excitation sites.”
§ Integrated photonic quantum walks > 6.1. Disordered lattices and Anderson localization
What the sources say
- Partly supportedcites [116] Lahini Y, Bromberg Y, Christodoulides D N and Silberberg Y 2010 Quantum correlations in two-particle Anderson localization Phys. Rev. Lett. 105 163905 sourceExperimental — accuracy not yet measured
The paper identifies its two-adjacent-site input as a separable state (p. 2), and Fig. 2 reports that bosons tend to appear at the same site. But the discussion of Fig. 2 (p. 2) attributes spatial bunching to the ballistic component and describes the localized component as having no spatial correlations. It therefore does not establish that the photons tend to share a channel specifically when localized around the excitation sites. (LLM, conf=0.85)
plainstates an association- Asserted: passes — The authors put it forward as true.
- Checkable: passes — It can be checked against evidence.
- Load-bearing: passes — The paper’s conclusions depend on it.
- Based: passes — The paper gives a reason why it holds.
- Partly supported
The cited sources support only part of this claim — read each source’s verdict below.
In the paper
“In their experimental study, Lebugle and co-workers achieved a revival with success probability greater than 92% depending on the specific input state [121].”
§ Integrated photonic quantum walks > 6.2. Quantum BOs
What the sources say
- Partly supportedcites [121] Lebugle M, Gräfe M, Heilmann R, Perez-Leija A, Nolte S and Szameit A 2015 Experimental observation of N00N state Bloch oscillations Nat. Commun. 6 8273 sourceExperimental — accuracy not yet measured
The Discussion reports a first-revival probability of 0.92±0.02 for symmetric input and 0.94±0.01 for antisymmetric input. Thus the measured probability exceeds 92% for the antisymmetric input, but the symmetric-input estimate is 92%, not greater than 92%. (LLM, conf=0.86)
plainstates an association- Asserted: passes — The authors put it forward as true.
- Checkable: passes — It can be checked against evidence.
- Load-bearing: unclear — It is unclear whether the paper’s conclusions depend on it.
- Based: passes — The paper gives a reason why it holds.
- Partly supported
33 more claims · 1 with their cited sources checked
Create a free account to see all 76 claims and every source verdict.
- Probably not a substantial claim. 19
- It may state two separate claims as one. 25
- The quote only partly states this claim. 2
Self-check
Percentages, sums and reported differences re-computed from the paper’s own numbers.
Each contradiction between two passages listed here was confirmed by an independent check.
Rated minor: it would not touch a result — a value no result rests on, a p-value that stays on the same side of the significance level, or a conflict that is clerical, resolved elsewhere in the paper, or outside its own findings.
In the paper
§ Integrated photonic quantum walks > 3. Direct laser-written waveguides
“The very first QW experiment was carried out in a silica-on-silicon waveguide array (see 5.1).”
§ Integrated photonic quantum walks > 5.1. Single photons in waveguide arrays
“Perets and co-workers were able to investigate single-photon QWs in a homogeneous array of 100 waveguides etched onto an AlGaAs substrate [69]”
Rated minor: it would not touch a result — a value no result rests on, a p-value that stays on the same side of the significance level, or a conflict that is clerical, resolved elsewhere in the paper, or outside its own findings.
In the paper
§ Integrated photonic quantum walks > 1. Introduction
“in the very same year, Einstein and Smoluchowski presented their seminal works on Brownian motion, which where modeled as random walks [2,3].”
§ Integrated photonic quantum walks > References
“3. von Smoluchowski M 1906 Zur kinetischen Theorie der Brownschen Molekularbewegung und der Suspensionen”
Rated minor: it would not touch a result — a value no result rests on, a p-value that stays on the same side of the significance level, or a conflict that is clerical, resolved elsewhere in the paper, or outside its own findings.
In the paper
§ Integrated photonic quantum walks > 2.3. QWs of two photons
“two indistinguishable photons, one launched into each input channel of a DC.”
§ Integrated photonic quantum walks > 2.3. QWs of two photons
“(two photons in each input port) yields G = G = 0 1,2 2,1”
Citations
Cites
Absence of Diffusion in Certain Random Lattices
Anderson, P. W. (1958) · Physical Review · doi:10.1103/physrev.109.1492 · Cited by 12,468 · cited 2×
“In contrast, the wave packet remains localized around the initial excitation site (Anderson localization) for discorded lattices [71].”
BackgroundQuantum Mechanics and Path Integrals
(1966) · Students Quarterly Journal · doi:10.1049/sqj.1966.0063 · Cited by 9,537
A fast quantum mechanical algorithm for database search
Grover, L. K. (1996) · Proceedings of the twenty-eighth annual ACM symposium on Theory of computing - STOC '96 · doi:10.1145/237814.237866 · Cited by 8,830 · cited 1×
“Since then, QWs have found applications as the fundamental concept behind Groverʼs search algorithm [9] or universal quantum computing [10, 11].”
BackgroundOptical Coherence and Quantum Optics
Mandel, L., & Wolf, E. (1995) · doi:10.1017/cbo9781139644105 · Cited by 8,356
Einstein, A. (1905) · Annalen der Physik · doi:10.1002/andp.19053220806 · Cited by 8,265
(1998) · doi:10.1103/physrevlett.80.5243 · Cited by 6,280 · cited 1×
“The peculiarity is that despite these systems generally not being Hermitian they can feature a completely real eigenvalue spectrum [124].”
BackgroundMeasurement of subpicosecond time intervals between two photons by interference
Hong, C. K., Ou, Z. Y., & Mandel, L. (1987) · Physical Review Letters · doi:10.1103/physrevlett.59.2044 · Cited by 4,369 · cited 1×
“The HOM effect was first observed in 1987 at a bulk beam splitter and was carried over to the integrated optical domain more than 20 years later [30, 31].”
Background�ber die Quantenmechanik der Elektronen in Kristallgittern
Bloch, F. (1929) · Zeitschrift f�r Physik · doi:10.1007/bf01339455 · Cited by 3,436
Three qubits can be entangled in two inequivalent ways
Dür, W., Vidal, G., & Cirac, J. I. (2000) · Physical Review A · doi:10.1103/physreva.62.062314 · Cited by 3,384 · cited 1×
“First introduced as coherent and balanced superposition of three qubit states [81] they can be readily generalized to N qubits.”
BackgroundSuperlattice and negative differential conductivity in semiconductors
Esaki, L., & Tsu, R. (1970) · IBM Journal of Research and Development · doi:10.1147/rd.141.0061 · Cited by 3,341 · cited 2×
“In addition, applyinga linear potential to an ordered latticethe wave packet will periodically spread andre-localize, which is denoted as Bloch oscillations [110, 111].”
BackgroundEvidence for wavelike energy transfer through quantum coherence in photosynthetic systems
Engel, G. S., Calhoun, T. R., Read, E. L., Ahn, T.-K., Mančal, T., Cheng, Y.-C., Blankenship, R. E., & Fleming, G. R. (2007) · Nature · doi:10.1038/nature05678 · Cited by 3,315
Observation ofPT-Symmetry Breaking in Complex Optical Potentials
Guo, A., Salamo, G. J., Duchesne, D., Morandotti, R., Volatier-Ravat, M., Aimez, V., Siviloglou, G. A., & Christodoulides, D. N. (2009) · Physical Review Letters · doi:10.1103/physrevlett.103.093902 · Cited by 2,748 · cited 1×
“which is then called quasi- -symmetric (see figure 18) [126].”
BackgroundWriting waveguides in glass with a femtosecond laser
Davis, K. M., Miura, K., Sugimoto, N., & Hirao, K. (1996) · Optics Letters · doi:10.1364/ol.21.001729 · Cited by 2,622 · cited 2×
“In this way, light guiding modification can be created [14, 15].”
BackgroundOptical Coherence and Quantum Optics
Mandel, L., Wolf, E., & Meystre, P. (1996) · American Journal of Physics · doi:10.1119/1.18450 · Cited by 2,414
O'Brien, J. L., Furusawa, A., & Vučković, J. (2009) · Nature Photonics · doi:10.1038/nphoton.2009.229 · Cited by 2,388 · cited 1×
“The refractive indices (especially for fused silica) match those of standard optical fibers [26, 33].”
BackgroundSingle-photon detectors for optical quantum information applications
Hadfield, R. H. (2009) · Nature Photonics · doi:10.1038/nphoton.2009.230 · Cited by 1,726
Discretizing light behaviour in linear and nonlinear waveguide lattices
Christodoulides, D. N., Lederer, F., & Silberberg, Y. (2003) · Nature · doi:10.1038/nature01936 · Cited by 1,692
Gerry, C., & Knight, P. (2004) · Cambridge University Press eBooks · doi:10.1017/cbo9780511791239 · Cited by 1,636
Aharonov, Y., Davidovich, L., & Zagury, N. (1993) · Physical Review A · doi:10.1103/physreva.48.1687 · Cited by 1,622
Transport and Anderson localization in disordered two-dimensional photonic lattices
Schwartz, T., Bartal, G., Fishman, S., & Segev, M. (2007) · Nature · doi:10.1038/nature05623 · Cited by 1,600
Zur kinetischen Theorie der Brownschen Molekularbewegung und der Suspensionen
von Smoluchowski, M. (1906) · Annalen der Physik · doi:10.1002/andp.19063261405 · Cited by 1,495
Quantum Communication through an Unmodulated Spin Chain
Bose, S. (2003) · Physical Review Letters · doi:10.1103/physrevlett.91.207901 · Cited by 1,407
Invited Review Article: Single-photon sources and detectors
Eisaman, M. D., Fan, J., Migdall, A., & Polyakov, S. V. (2011) · Review of Scientific Instruments · doi:10.1063/1.3610677 · Cited by 1,358
Theory of coupled optical PT-symmetric structures
El-Ganainy, R., Makris, K. G., Christodoulides, D. N., & Musslimani, Z. H. (2007) · Optics Letters · doi:10.1364/ol.32.002632 · Cited by 1,351 · cited 1×
“sites provides such a -symmetric system [125].”
BackgroundZur Theorie der Brownschen Bewegung
Einstein, A. (1906) · Annalen der Physik · doi:10.1002/andp.19063240208 · Cited by 1,288
Discrete Spatial Optical Solitons in Waveguide Arrays
Eisenberg, H. S., Silberberg, Y., Morandotti, R., Boyd, A. R., & Aitchison, J. S. (1998) · Physical Review Letters · doi:10.1103/physrevlett.81.3383 · Cited by 1,286 · cited 1×
“When injecting a single photon into site j the probability amplitude of finding it at site q at the output is analytically described by [21, 22, 27]”
BackgroundA fast quantum mechanical algorithm for database searchPreprint
Grover, L. K. (1996) · arXiv (Cornell University) · doi:10.48550/arxiv.quant-ph/9605043 · Cited by 1,227
Perfect State Transfer in Quantum Spin Networks
Christandl, M., Datta, N., Ekert, A., & Landahl, A. J. (2004) · Physical Review Letters · doi:10.1103/physrevlett.92.187902 · Cited by 1,179
Silica-on-silicon waveguide quantum circuits
Politi, A., Cryan, M. J., Rarity, J. G., Yu, S., & O'Brien, J. L. (2008) · Science · doi:10.1126/science.1155441 · Cited by 1,084
Universal Computation by Quantum Walk
Childs, A. M. (2009) · Physical Review Letters · doi:10.1103/physrevlett.102.180501 · Cited by 1,002 · cited 1×
“Since then, QWs have found applications as the fundamental concept behind Groverʼs search algorithm [9] or universal quantum computing [10, 11].”
BackgroundGerry, C. C., & Knight, P. L. (2023) · Cambridge University Press eBooks · doi:10.1017/9781139151207 · Cited by 1,001
Anderson Localization and Nonlinearity in One-Dimensional Disordered Photonic Lattices
Lahini, Y., Avidan, A., Pozzi, F., Sorel, M., Morandotti, R., Christodoulides, D. N., & Silberberg, Y. (2008) · Physical Review Letters · doi:10.1103/physrevlett.100.013906 · Cited by 978
The Problem of the Random Walk
PEARSON, K. (1905) · Nature · doi:10.1038/072294b0 · Cited by 960
Quantum Walks of Correlated Photons
Peruzzo, A., Lobino, M., Matthews, J. C. F., Matsuda, N., Politi, A., Poulios, K., Zhou, X.-Q., Lahini, Y., Ismail, N., Wörhoff, K., et al. (2010) · Science · doi:10.1126/science.1193515 · Cited by 929
Lounis, B., & Orrit, M. (2005) · Reports on Progress in Physics · doi:10.1088/0034-4885/68/5/r04 · Cited by 908
Dynamic localization of a charged particle moving under the influence of an electric field
Dunlap, D. H., & Kenkre, V. M. (1986) · Physical Review B · doi:10.1103/physrevb.34.3625 · Cited by 896
Atom-chip-based generation of entanglement for quantum metrology
Riedel, M. F., Böhi, P., Li, Y., Hänsch, T. W., Sinatra, A., & Treutlein, P. (2010) · Nature · doi:10.1038/nature08988 · Cited by 874
Boson Sampling on a Photonic Chip
Spring, J. B., Metcalf, B. J., Humphreys, P. C., Kolthammer, W. S., Jin, X.-M., Barbieri, M., Datta, A., Thomas-Peter, N., Langford, N. K., Kundys, D., et al. (2013) · Science · doi:10.1126/science.1231692 · Cited by 837
Anderson localization of light
Segev, M., Silberberg, Y., & Christodoulides, D. N. (2013) · Nature Photonics · doi:10.1038/nphoton.2013.30 · Cited by 813
Counting near-infrared single-photons with 95% efficiency
Lita, A. E., Miller, A. J., & Nam, S. W. (2008) · Optics Express · doi:10.1364/oe.16.003032 · Cited by 734 · cited 1×
“In contrast to APDs, superconducting transition edge sensors (TESs) [64, 65] are capable of photon number resolution [66, 67].”
BackgroundTillmann, M., Dakić, B., Heilmann, R., Nolte, S., Szameit, A., & Walther, P. (2013) · Nature Photonics · doi:10.1038/nphoton.2013.102 · Cited by 709
Self-citationQuantum entanglement in photosynthetic light-harvesting complexes
Sarovar, M., Ishizaki, A., Fleming, G. R., & Whaley, K. B. (2010) · Nature Physics · doi:10.1038/nphys1652 · Cited by 644
Quantum-mechanical lossless beam splitter: SU(2) symmetry and photon statistics
Campos, R. A., Saleh, B. E. A., & Teich, M. C. (1989) · Physical Review A · doi:10.1103/physreva.40.1371 · Cited by 633
Experimental Observation of Linear and Nonlinear Optical Bloch Oscillations
Morandotti, R., Peschel, U., Aitchison, J. S., Eisenberg, H. S., & Silberberg, Y. (1999) · Physical Review Letters · doi:10.1103/physrevlett.83.4756 · Cited by 626 · cited 1×
“Therefore, photonic BOs of single-particle dynamics have been extensively studied in the past [108, 112, 119].”
BackgroundDiscrete optics in femtosecond-laser-written photonic structures
Szameit, A., & Nolte, S. (2010) · Journal of Physics B: Atomic, Molecular and Optical Physics · doi:10.1088/0953-4075/43/16/163001 · Cited by 610 · cited 2×
“Thus, it directly corresponds to the classical intensity distribution when injecting coherent laser light into guide m, as visualized in figure 4, and also in [26].”
BackgroundSelf-citationHigh-NOON States by Mixing Quantum and Classical Light
Afek, I., Ambar, O., & Silberberg, Y. (2010) · Science · doi:10.1126/science.1188172 · Cited by 588
Photons Walking the Line: A Quantum Walk with Adjustable Coin Operations
Schreiber, A., Cassemiro, K. N., Potoček, V., Gábris, A., Mosley, P. J., Andersson, E., Jex, I., & Silberhorn, C. (2010) · Physical Review Letters · doi:10.1103/physrevlett.104.050502 · Cited by 588 · cited 1×
“This can be realized by fiber loops [70].”
BackgroundOptical Bloch Oscillations in Temperature Tuned Waveguide Arrays
Pertsch, T., Dannberg, P., Elflein, W., Bräuer, A., & Lederer, F. (1999) · Physical Review Letters · doi:10.1103/physrevlett.83.4752 · Cited by 587 · cited 2×
“Therefore, photonic BOs of single-particle dynamics have been extensively studied in the past [108, 112, 119].”
BackgroundOptimal universal and state-dependent quantum cloning
Bruß, D., DiVincenzo, D. P., Ekert, A., Fuchs, C. A., Macchiavello, C., & Smolin, J. A. (1998) · Physical Review A · doi:10.1103/physreva.57.2368 · Cited by 554
Realization of Quantum Walks with Negligible Decoherence in Waveguide Lattices
Perets, H. B., Lahini, Y., Pozzi, F., Sorel, M., Morandotti, R., & Silberberg, Y. (2008) · Physical Review Letters · doi:10.1103/physrevlett.100.170506 · Cited by 526 · cited 2×
“Reprinted figure with permission from [68], Copyright 2008 by the American Physical Society.”
MethodObservation of photonic anomalous Floquet topological insulators
Maczewsky, L. J., Zeuner, J. M., Nolte, S., & Szameit, A. (2017) · Nature Communications · doi:10.1038/ncomms13756 · Cited by 512
Self-citationAnderson localization of entangled photons in an integrated quantum walk
Crespi, A., Osellame, R., Ramponi, R., Giovannetti, V., Fazio, R., Sansoni, L., De Nicola, F., Sciarrino, F., & Mataloni, P. (2013) · Nature Photonics · doi:10.1038/nphoton.2013.26 · Cited by 474 · cited 2×
“Reprinted by permission from Springer Nature Customer Service Centre GmbH: Springer Nature, Nature Photonics [118] 2013.”
BackgroundMethodUniversal Computation by Multiparticle Quantum Walk
Childs, A. M., Gosset, D., & Webb, Z. (2013) · Science · doi:10.1126/science.1229957 · Cited by 456 · cited 1×
“Since then, QWs have found applications as the fundamental concept behind Groverʼs search algorithm [9] or universal quantum computing [10, 11].”
BackgroundAnderson Localization of Light
Sektion, M.-N., & Physik, F. (2006) · Cited by 391
Photonic topological insulator in synthetic dimensions
Lustig, E., Weimann, S., Plotnik, Y., Lumer, Y., Bandres, M. A., Szameit, A., & Segev, M. (2019) · Nature · doi:10.1038/s41586-019-0943-7 · Cited by 381
Self-citationExperimental Realization of a Three-Qubit EntangledWState
Eibl, M., Kiesel, N., Bourennane, M., Kurtsiefer, C., & Weinfurter, H. (2004) · Physical Review Letters · doi:10.1103/physrevlett.92.077901 · Cited by 364
Photonic topological Anderson insulators
Stützer, S., Plotnik, Y., Lumer, Y., Titum, P., Lindner, N. H., Segev, M., Rechtsman, M. C., & Szameit, A. (2018) · Nature · doi:10.1038/s41586-018-0418-2 · Cited by 359
Self-citationCabrera, B., Clarke, R. M., Colling, P., Miller, A. J., Nam, S., & Romani, R. W. (1998) · Applied Physics Letters · doi:10.1063/1.121984 · Cited by 352 · cited 1×
“In contrast to APDs, superconducting transition edge sensors (TESs) [64, 65] are capable of photon number resolution [66, 67].”
BackgroundTesting Quantum Nonlocality in Phase Space
Banaszek, K., & Wódkiewicz, K. (1999) · Physical Review Letters · doi:10.1103/physrevlett.82.2009 · Cited by 338
Evolution and prospects for single-photon avalanche diodes and quenching circuits
Cova, S., Ghioni, M., Lotito, A., Rech, I., & Zappa, F. (2004) · Journal of Modern Optics · doi:10.1080/09500340408235272 · Cited by 322
Quantum and Classical Correlations in Waveguide Lattices
Bromberg, Y., Lahini, Y., Morandotti, R., & Silberberg, Y. (2009) · Physical Review Letters · doi:10.1103/physrevlett.102.253904 · Cited by 318 · cited 3×
“the case of phase-averaged coherent laser light [21, 25]:”
BackgroundTopological Creation and Destruction of Edge States in Photonic Graphene
Rechtsman, M. C., Plotnik, Y., Zeuner, J. M., Song, D., Chen, Z., Szameit, A., & Segev, M. (2013) · Physical Review Letters · doi:10.1103/physrevlett.111.103901 · Cited by 302
Self-citationFukuda, D., Fujii, G., Numata, T., Amemiya, K., Yoshizawa, A., Tsuchida, H., Fujino, H., Ishii, H., Itatani, T., Inoue, S., et al. (2011) · Optics Express · doi:10.1364/oe.19.000870 · Cited by 271 · cited 1×
“In contrast to APDs, superconducting transition edge sensors (TESs) [64, 65] are capable of photon number resolution [66, 67].”
BackgroundQuantum teleportation via a W state
Joo, J., Park, Y.-J., Oh, S., & Kim, J. (2003) · New Journal of Physics · doi:10.1088/1367-2630/5/1/136 · Cited by 257
Entangled biphoton source—property and preparation
Shih, Y. (2003) · Reports on Progress in Physics · doi:10.1088/0034-4885/66/6/203 · Cited by 252 · cited 3×
“Due to the generally broad SPDC spectrum, the use of narrow band pass filters is highly recommended for on-chip QW applications (the coupling strength between adjacent waveguides is frequencydependent).”
BackgroundInfluentialCoupling of Optical Fibers and Scattering in Fibers*
Jones, A. L. (1965) · Journal of the Optical Society of America · doi:10.1364/josa.55.000261 · Cited by 243 · cited 2×
“When injecting a single photon into site j the probability amplitude of finding it at site q at the output is analytically described by [21, 22, 27]”
BackgroundLaser written circuits for quantum photonics
Meany, T., Gräfe, M., Heilmann, R., Perez‐Leija, A., Gross, S., Steel, M. J., Withford, M. J., & Szameit, A. (2015) · Laser & Photonics Reviews · doi:10.1002/lpor.201500061 · Cited by 230
Self-citationTeleportation of an unknown state by W state
Shi, B.-S., & Tomita, A. (2002) · Physics Letters A · doi:10.1016/s0375-9601(02)00257-8 · Cited by 227
On the experimental verification of quantum complexity in linear optics
Carolan, J., Meinecke, J. D. A., Shadbolt, P. J., Russell, N. J., Ismail, N., Wörhoff, K., Rudolph, T., Thompson, M. G., O'Brien, J. L., Matthews, J. C. F., et al. (2014) · Nature Photonics · doi:10.1038/nphoton.2014.152 · Cited by 221 · cited 2×
“However, a description of mutli-photon QWs and their nonclassical correlations can be found in [16, 29].”
BackgroundBloch-Zener Oscillations in Binary Superlattices
Dreisow, F., Szameit, A., Heinrich, M., Pertsch, T., Nolte, S., Tünnermann, A., & Longhi, S. (2009) · Physical Review Letters · doi:10.1103/physrevlett.102.076802 · Cited by 213 · cited 1×
“Therefore, photonic BOs of single-particle dynamics have been extensively studied in the past [108, 112, 119].”
BackgroundSelf-citationBloch Oscillations in an Array of Curved Optical Waveguides
Lenz, G., Talanina, I., & de Sterke, C. M. (1999) · Physical Review Letters · doi:10.1103/physrevlett.83.963 · Cited by 213 · cited 1×
“The BO itself takes place in a curved waveguide array, where the curvature provides the potential ramp [123].”
BackgroundAnderson localization in optical waveguide arrays with off-diagonal coupling disorder
Martin, L., Di Giuseppe, G., Perez-Leija, A., Keil, R., Dreisow, F., Heinrich, M., Nolte, S., Szameit, A., Abouraddy, A. F., Christodoulides, D. N., et al. (2011) · Optics Express · doi:10.1364/oe.19.013636 · Cited by 204
Self-citationEfficient Single Photon Detection from 500 nm to 5 μm Wavelength
Marsili, F., Bellei, F., Najafi, F., Dane, A. E., Dauler, E. A., Molnar, R. J., & Berggren, K. K. (2012) · Nano Letters · doi:10.1021/nl302245n · Cited by 197
Spontaneous parametric down-conversion in periodically poled KTP waveguides and bulk crystals
Fiorentino, M., Spillane, S. M., Beausoleil, R. G., Roberts, T. D., Battle, P., & Munro, M. W. (2007) · Optics Express · doi:10.1364/oe.15.007479 · Cited by 195 · cited 1×
“Furthermore, it is possible to have a greater variety in degrees of freedom for source engineering by applying a quasi-phase matching condition in periodically poled crystals [41, 45, 52].”
BackgroundQuantum teleportation on a photonic chip
Metcalf, B. J., Spring, J. B., Humphreys, P. C., Thomas-Peter, N., Barbieri, M., Kolthammer, W. S., Jin, X.-M., Langford, N. K., Kundys, D., Gates, J. C., et al. (2014) · Nature Photonics · doi:10.1038/nphoton.2014.217 · Cited by 188
Coherent quantum transport in photonic lattices
Perez-Leija, A., Keil, R., Kay, A., Moya-Cessa, H., Nolte, S., Kwek, L.-C., Rodríguez-Lara, B. M., Szameit, A., & Christodoulides, D. N. (2013) · Physical Review A · doi:10.1103/physreva.87.012309 · Cited by 182 · cited 2×
“Perez-Leija and co-workers investigated such configurations experimentally in a lattice of 19 waveguides [104].”
BackgroundMethodSelf-citationSingle-photon imager based on a superconducting nanowire delay line
Zhao, Q.-Y., Zhu, D., Calandri, N., Dane, A. E., McCaughan, A. N., Bellei, F., Wang, H.-Z., Santavicca, D. F., & Berggren, K. K. (2017) · Nature Photonics · doi:10.1038/nphoton.2017.35 · Cited by 182 · cited 1×
“Recent research results promise a photon number resolution [59, 60], a two-dimensional spatial resolution [61], and the arangement as one-dimensional detection array [62, 63].”
BackgroundQuantum Correlations in Two-Particle Anderson Localization
Lahini, Y., Bromberg, Y., Christodoulides, D. N., & Silberberg, Y. (2010) · Physical Review Letters · doi:10.1103/physrevlett.105.163905 · Cited by 176 · cited 3×
“Due to the quantum parallelism of the input state it becomes unnecessary to perform statistical averaging over many samples as is normally required (due to the finite propagation length) [116].”
BackgroundMethodInfluentialSuperconducting Nanowires for Single‐Photon Detection: Progress, Challenges, and Opportunities
Holzman, I., & Ivry, Y. (2019) · Advanced Quantum Technologies · doi:10.1002/qute.201800058 · Cited by 172
Observation of PT-symmetric quantum interference
Klauck, F., Teuber, L., Ornigotti, M., Heinrich, M., Scheel, S., & Szameit, A. (2019) · Nature Photonics · doi:10.1038/s41566-019-0517-0 · Cited by 168
Self-citationEntanglement Polytopes: Multiparticle Entanglement from Single-Particle Information
Walter, M., Doran, B., Gross, D., & Christandl, M. (2013) · Science · doi:10.1126/science.1232957 · Cited by 166
Direct UV writing of buried singlemode channelwaveguides in Ge-doped silica films
Svalgaard, M., Poulsen, C. V., Bjarklev, A., & Poulsen, O. (1994) · Electronics Letters · doi:10.1049/el:19940935 · Cited by 159 · cited 1×
“For the sake of completeness, it is worth mentioning that waveguide structures can also be fabricated by UV radiation in photo-refractive crystals [34, 35] and by direct laserinscription in polymers [36].”
BackgroundPolychromatic dynamic localization in curved photonic lattices
Szameit, A., Garanovich, I. L., Heinrich, M., Sukhorukov, A. A., Dreisow, F., Pertsch, T., Nolte, S., Tünnermann, A., & Kivshar, Y. S. (2009) · Nature Physics · doi:10.1038/nphys1221 · Cited by 159
Self-citationPhotonic topological insulator in synthetic dimensions
Lustig, E., Weimann, S., Plotnik, Y., Lumer, Y., Bandres, M. A., Szameit, A., & Segev, M. (2019) · RePEc: Research Papers in Economics · Cited by 157
Self-citationMobility transition from ballistic to diffusive transport in non-Hermitian lattices
Eichelkraut, T., Heilmann, R., Weimann, S., Stützer, S., Dreisow, F., Christodoulides, D. N., Nolte, S., & Szameit, A. (2013) · Nature Communications · doi:10.1038/ncomms3533 · Cited by 153
Self-citationOn-chip generation of high-order single-photon W-states
Gräfe, M., Heilmann, R., Perez-Leija, A., Keil, R., Dreisow, F., Heinrich, M., Moya-Cessa, H., Nolte, S., Christodoulides, D. N., & Szameit, A. (2014) · Nature Photonics · doi:10.1038/nphoton.2014.204 · Cited by 148
Self-citationQuantum Walks of Correlated Photon Pairs in Two-Dimensional Waveguide Arrays
Poulios, K., Keil, R., Fry, D., Meinecke, J. D. A., Matthews, J. C. F., Politi, A., Lobino, M., Gräfe, M., Heinrich, M., Nolte, S., et al. (2014) · Physical Review Letters · doi:10.1103/physrevlett.112.143604 · Cited by 148 · cited 1×
“Special attention is paid to direct laser-written waveguides since they offer the possibility of implementing complex lattice geometries including the third spatial dimension [129, 130], and consequently of utilization for investigating systems beyond the standard model [131], in quantum biophysics [132–134], and in q…”
BackgroundSelf-citationActive temporal multiplexing of indistinguishable heralded single photons
Xiong, C., Zhang, X., Liu, Z., Collins, M. J., Mahendra, A., Helt, L. G., Steel, M. J., Choi, D. Y., Chae, C. J., Leong, P. H. W., et al. (2016) · Nature Communications · doi:10.1038/ncomms10853 · Cited by 145
Entanglement of spin waves among four quantum memories
Choi, K. S., Goban, A., Papp, S. B., van Enk, S. J., & Kimble, H. J. (2010) · Nature · doi:10.1038/nature09568 · Cited by 144
Hyper-transport of light and stochastic acceleration by evolving disorder
Levi, L., Lev, Y. B., Fishman, S., & Segev, M. (2012) · Nature Physics · doi:10.1038/nphys2463 · Cited by 142
Allman, M. S., Verma, V. B., Stevens, M., Gerrits, T., Horansky, R. D., Lita, A. E., Marsili, F., Beyer, A., Shaw, M. D., Kumor, D., et al. (2015) · Applied Physics Letters · doi:10.1063/1.4921318 · Cited by 141
On the nature of population extremes
Ariño, A. H., & Pimm, S. L. (1995) · Evolutionary Ecology · doi:10.1007/bf01237765 · Cited by 139 · cited 1×
“Nowadays, random walks are utilized to describe many kinds of processes, for instance estimating the size of the world wide web [4], modeling species population statistics [5], and describing the circulation of dollar bills throughout the United States of America [6].”
BackgroundPhase-controlled integrated photonic quantum circuits
Smith, B. J., Kundys, D., Thomas-Peter, N., Smith, P. G. R., & Walmsley, I. A. (2009) · Optics Express · doi:10.1364/oe.17.013516 · Cited by 139
Two-photon quantum walks in an elliptical direct-write waveguide array
Owens, J. O., Broome, M. A., Biggerstaff, D. N., Goggin, M. E., Fedrizzi, A., Linjordet, T., Ams, M., Marshall, G. D., Twamley, J., Withford, M. J., et al. (2011) · New Journal of Physics · doi:10.1088/1367-2630/13/7/075003 · Cited by 135 · cited 1×
“Special attention is paid to direct laser-written waveguides since they offer the possibility of implementing complex lattice geometries including the third spatial dimension [129, 130], and consequently of utilization for investigating systems beyond the standard model [131], in quantum biophysics [132–134], and in q…”
BackgroundGeneralized Multiphoton Quantum Interference
Tillmann, M., Tan, S.-H., Stoeckl, S. E., Sanders, B. C., de Guise, H., Heilmann, R., Nolte, S., Szameit, A., & Walther, P. (2015) · Physical Review X · doi:10.1103/physrevx.5.041015 · Cited by 127
Self-citationCharacterization of Multipartite Entanglement for One Photon Shared Among Four Optical Modes
Papp, S. B., Choi, K. S., Deng, H., Lougovski, P., van Enk, S. J., & Kimble, H. J. (2009) · Science · doi:10.1126/science.1172260 · Cited by 126
High quantum-efficiency photon-number-resolving detector for photonic on-chip information processing
Calkins, B., Mennea, P. L., Lita, A. E., Metcalf, B. J., Kolthammer, W. S., Lamas-Linares, A., Spring, J. B., Humphreys, P. C., Mirin, R. P., Gates, J. C., et al. (2013) · Optics Express · doi:10.1364/oe.21.022657 · Cited by 119 · cited 1×
“In contrast to APDs, superconducting transition edge sensors (TESs) [64, 65] are capable of photon number resolution [66, 67].”
BackgroundEnhancing coherent transport in a photonic network using controllable decoherence
Biggerstaff, D. N., Heilmann, R., Zecevik, A. A., Gräfe, M., Broome, M. A., Fedrizzi, A., Nolte, S., Szameit, A., White, A. G., & Kassal, I. (2016) · Nature Communications · doi:10.1038/ncomms11282 · Cited by 117
Self-citationEntangled Photons: Generation, Observation, and Characterization
Edamatsu, K. (2007) · Japanese Journal of Applied Physics · doi:10.1143/jjap.46.7175 · Cited by 117
Spin-based optical quantum computation via Pauli blocking in semiconductor quantum dots
Pazy, E., Biolatti, E., Calarco, T., D'Amico, I., Zanardi, P., Rossi, F., & Zoller, P. (2003) · Europhysics Letters (EPL) · doi:10.1209/epl/i2003-00343-4 · Cited by 114
Random sampling from a search engine's index
Bar-Yossef, Z., & Gurevich, M. (2008) · Journal of the ACM · doi:10.1145/1411509.1411514 · Cited by 113
Topological protection of photonic path entanglement
Rechtsman, M. C., Lumer, Y., Plotnik, Y., Perez-Leija, A., Szameit, A., & Segev, M. (2016) · Optica · doi:10.1364/optica.3.000925 · Cited by 111
Self-citationNonlocality of a Single Particle
Dunningham, J., & Vedral, V. (2007) · Physical Review Letters · doi:10.1103/physrevlett.99.180404 · Cited by 110
Quasi-incoherent propagation in waveguide arrays
Szameit, A., Dreisow, F., Hartung, H., Nolte, S., Tünnermann, A., & Lederer, F. (2007) · Applied Physics Letters · doi:10.1063/1.2735953 · Cited by 101
Self-citationSpectral resolved dynamic localization in curved fs laser written waveguide arrays
Dreisow, F., Heinrich, M., Szameit, A., Doering, S., Nolte, S., Tuennermann, A., Fahr, S., & Lederer, F. (2008) · Optics Express · doi:10.1364/oe.16.003474 · Cited by 100
Self-citationObserving fermionic statistics with photons in arbitrary processes
Matthews, J. C. F., Poulios, K., Meinecke, J. D. A., Politi, A., Peruzzo, A., Ismail, N., Wörhoff, K., Thompson, M. G., & O'Brien, J. L. (2013) · Scientific Reports · doi:10.1038/srep01539 · Cited by 98
Heilmann, R., Gräfe, M., Nolte, S., & Szameit, A. (2015) · 中国科学通报:英文版 · doi:10.1007/s11434-014-0688-5 · Cited by 98
Self-citationNonclassical fields in a linear directional coupler
Lai, W. K., Buek, V., & Knight, P. L. (1991) · Physical Review A · doi:10.1103/physreva.43.6323 · Cited by 95
Gyöngy, I., Calder, N. J., Davies, A., et al. (2017) · IEEE Transactions on Electron Devices · doi:10.1109/ted.2017.2779790 · Cited by 92
Wave localization at the boundary of disordered photonic lattices
Szameit, A., Kartashov, Y. �., Zeil, P., Dreisow, F., Heinrich, M., Keil, R., Nolte, S., Tünnermann, A., Vysloukh, V. �., & Torner, L. (2010) · Optics Letters · doi:10.1364/ol.35.001172 · Cited by 91
Self-citationFaithful communication Hamiltonian in photonic lattices
Bellec, M., Nikolopoulos, G. M., & Tzortzakis, S. (2012) · Optics Letters · doi:10.1364/ol.37.004504 · Cited by 89
Steinlechner, F., Gilaberte, M., Jofre, M., Scheidl, T., Torres, J. P., Pruneri, V., & Ursin, R. (2014) · Journal of the Optical Society of America B · doi:10.1364/josab.31.002068 · Cited by 88 · cited 1×
“In doing so, type-0 phase matching becomes possible, where pump, signal, and idler have identical polarization allowing very bright photon pair sources [53, 54].”
BackgroundDirect Generation of Polarization-Entangled Photon Pairs in a Poled Fiber
Zhu, E. Y., Tang, Z., Qian, L., Helt, L. G., Liscidini, M., Sipe, J. E., Corbari, C., Canagasabey, A., Ibsen, M., & Kazansky, P. G. (2012) · Physical Review Letters · doi:10.1103/physrevlett.108.213902 · Cited by 85
Faithful communication hamiltonian in photonic latticesPreprint
Bellec, M., Nikolopoulos, G. M., & Tzortzakis, S. (2016) · Cited by 85
Einstein–Podolsky–Rosen spatial entanglement in ordered and Anderson photonic lattices
Di Giuseppe, G., Martin, L., Perez-Leija, A., Keil, R., Dreisow, F., Nolte, S., Szameit, A., Abouraddy, A. F., Christodoulides, D. N., & Saleh, B. E. A. (2013) · Physical Review Letters · doi:10.1103/physrevlett.110.150503 · Cited by 82
Self-citationQuantum Artificial Life in an IBM Quantum Computer
Alvarez-Rodriguez, U., Sanz, M., Lamata, L., & Solano, E. (2018) · Scientific Reports · doi:10.1038/s41598-018-33125-3 · Cited by 82 · cited 1×
“Special attention is paid to direct laser-written waveguides since they offer the possibility of implementing complex lattice geometries including the third spatial dimension [129, 130], and consequently of utilization for investigating systems beyond the standard model [131], in quantum biophysics [132–134], and in q…”
BackgroundWave localization at the boundary of disordered photonic lattices
Szameit, A., Kartashov, Y. V., Zeil, P., Dreisow, F., Heinrich, M., Keil, R., Nolte, S., Tünnermann, A., Vysloukh, V. A., & Torner, L. (n.d.) · RECERCAT (Consorci de Serveis Universitaris de Catalunya) · Cited by 82
Self-citationPerfect transfer of path-entangled photons inJxphotonic lattices
Perez-Leija, A., Keil, R., Moya-Cessa, H., Szameit, A., & Christodoulides, D. N. (2013) · Physical Review A · doi:10.1103/physreva.87.022303 · Cited by 80 · cited 1×
“For example, as shown in [105], the approach of using integrated photonic Jx lattices for perfect state transfer can Figure 11.”
MethodSelf-citationQuantum Simulation of the Majorana Equation and Unphysical Operations
Casanova, J., Sabín, C., León, J., Egusquiza, I. L., Gerritsma, R., Roos, C. F., García-Ripoll, J. J., & Solano, E. (2011) · Physical Review X · doi:10.1103/physrevx.1.021018 · Cited by 77 · cited 1×
“Special attention is paid to direct laser-written waveguides since they offer the possibility of implementing complex lattice geometries including the third spatial dimension [129, 130], and consequently of utilization for investigating systems beyond the standard model [131], in quantum biophysics [132–134], and in q…”
BackgroundGeneration of correlated photon pairs in type-II parametric down conversion--revisited
Kurtsiefer, C., Oberparleiter, M., & Weinfurter, H. (2001) · Journal of Modern Optics · doi:10.1080/09500340108240902 · Cited by 76
Chen, L., Schwarzer, D., Verma, V. B., Stevens, M. J., Marsili, F., Mirin, R. P., Nam, S. W., & Wodtke, A. M. (2017) · Accounts of Chemical Research · doi:10.1021/acs.accounts.7b00071 · Cited by 72
Witnessing Trustworthy Single-Photon Entanglement with Local Homodyne Measurements
Morin, O., Bancal, J.-D., Ho, M., Sekatski, P., D’Auria, V., Gisin, N., Laurat, J., & Sangouard, N. (2013) · Physical Review Letters · doi:10.1103/physrevlett.110.130401 · Cited by 72
Bloch oscillations of path-entangled photons
Bromberg, Y., Lahini, Y., & Silberberg, Y. (2010) · Physical Review Letters · doi:10.1103/physrevlett.105.263604 · Cited by 71
Direct Observation of Sub-Binomial Light
Bartley, T. J., Donati, G., Jin, X., Datta, A., Barbieri, M., & Walmsley, I. A. (2013) · Physical Review Letters · doi:10.1103/physrevlett.110.173602 · Cited by 70
Integrated photonic quantum walks
Gräfe, M., Heilmann, R., Lebugle, M., Guzman-Silva, D., Perez-Leija, A., & Szameit, A. (2016) · Journal of Optics · doi:10.1088/2040-8978/18/10/103002 · Cited by 70
Self-citationFermionic time-reversal symmetry in a photonic topological insulator
Maczewsky, L. J., Höckendorf, B., Kremer, M., Biesenthal, T., Heinrich, M., Alvermann, A., Fehske, H., & Szameit, A. (2020) · Nature Materials · doi:10.1038/s41563-020-0641-8 · Cited by 65
Self-citationMatthews, J. C. F., Poulios, K., Meinecke, J. D. A., Politi, A., Peruzzo, A., Ismail, N., Wörhoff, K., Thompson, M. G., & O’Brien, J. L. (2011) · arXiv (Cornell University) · doi:10.48550/arxiv.1106.1166 · Cited by 62
Experimental observation of N00N state Bloch oscillations
Lebugle, M., Gräfe, M., Heilmann, R., Perez-Leija, A., Nolte, S., & Szameit, A. (2015) · Nature Communications · doi:10.1038/ncomms9273 · Cited by 60
Self-citationTopologically robust transport of entangled photons in a 2D photonic system
Mittal, S., Orre, V. V., & Hafezi, M. (2016) · Optics Express · doi:10.1364/oe.24.015631 · Cited by 60
Design of bright, fiber-coupled and fully factorable photon pair sources
Vicent, L. E., U’Ren, A. B., Rangarajan, R., Osorio, C. I., Torres, J. P., Zhang, L., & Walmsley, I. A. (2010) · New Journal of Physics · doi:10.1088/1367-2630/12/9/093027 · Cited by 59
Generating photon-encoded W states in multiport waveguide-array systems
Pérez-Leija, A., Hernández-Herrejón, J. C., Moya-Cessa, H. M., Szameit, A., & Christodoulides, D. N. (2013) · Physical Review A · doi:10.1103/physreva.87.013842 · Cited by 59 · cited 1×
“In the former configuration a continuously coupled waveguide array is utilized to generate odd orders of N [98].”
MethodSelf-citationPhase-stable source of polarization-entangled photons in a linear double-pass configuration
Steinlechner, F., Ramelow, S., Jofre, M., Gilaberte, M., Jennewein, T., Torres, J. P., Mitchell, M. W., & Pruneri, V. (2013) · Optics Express · doi:10.1364/oe.21.011943 · Cited by 58 · cited 1×
“In doing so, type-0 phase matching becomes possible, where pump, signal, and idler have identical polarization allowing very bright photon pair sources [53, 54].”
BackgroundNonlocal aspects of a quantum wave
Aharonov, Y., & Vaidman, L. (2000) · Physical Review A · doi:10.1103/physreva.61.052108 · Cited by 56
Superconducting-nanowire single-photon-detector linear array
Zhao, Q., McCaughan, A., Bellei, F., Najafi, F., De Fazio, D., Dane, A., Ivry, Y., & Berggren, K. K. (2013) · Applied Physics Letters · doi:10.1063/1.4823542 · Cited by 50
Carteret, H. A., Linden, N., Popescu, S., & Sudbery, A. (1999) · Foundations of Physics · doi:10.1023/a:1018808108183 · Cited by 48
Quantum Mechanics and Path Integrals
Feynman, R. P., Hibbs, A. R., & Weiss, G. H. (1966) · Physics Today · doi:10.1063/1.3048320 · Cited by 48
Haase, B., Kutas, M., Riexinger, F., Bickert, P., Keil, A., Molter, D., Bortz, M., & von Freymann, G. (2019) · Optics Express · doi:10.1364/oe.27.007458 · Cited by 46 · cited 1×
“Furthermore, it is possible to have a greater variety in degrees of freedom for source engineering by applying a quasi-phase matching condition in periodically poled crystals [41, 45, 52].”
BackgroundA quantum of natural selection
Lloyd, S. (2009) · Nature Physics · doi:10.1038/nphys1208 · Cited by 43 · cited 1×
“The highly efficient energy transfer in light-harvesting molecules during photosynthesis is described by discrete QW dynamics [12, 13].”
BackgroundHarnessing click detectors for the genuine characterization of light states
Heilmann, R., Sperling, J., Pérez-Leija, A., Gräfe, M., Heinrich, M., Nolte, S., Vogel, W., & Szameit, A. (2016) · Scientific Reports · doi:10.1038/srep19489 · Cited by 42
Self-citationTesting nonlocality of a single photon without a shared reference frame
Brask, J. B., Chaves, R., & Brunner, N. (2013) · Physical Review A · doi:10.1103/physreva.88.012111 · Cited by 37
Nonlinear waveguide arrays in AlGaAs
Millar, P., Aitchison, J. S., Kang, J. U., Stegeman, G. I., Villeneuve, A., Kennedy, G. T., & Sibbett, W. (1997) · Journal of the Optical Society of America B · doi:10.1364/josab.14.003224 · Cited by 35 · cited 1×
“This way, Perets and co-workers were able to investigate single-photon QWs in a homogeneous array of 100 waveguides etched onto an AlGaAs substrate [69] (see figure 9(a)).”
BackgroundTapering of femtosecond laser-written waveguides
Heilmann, R., Greganti, C., Gräfe, M., Nolte, S., Walther, P., & Szameit, A. (2018) · Applied Optics · doi:10.1364/ao.57.000377 · Cited by 33
Self-citationPossibility of coherent phenomena such as Bloch oscillations with single photons viaWstates
Rai, A., & Agarwal, G. S. (2009) · Physical Review A · doi:10.1103/physreva.79.053849 · Cited by 32 · cited 1×
“In photonics this can describe the situation where a single photon is coherently shared among N optical modes [82, 83]:”
BackgroundScholes, G. D. (2010) · Nature Physics · doi:10.1038/nphys1693 · Cited by 31
Cabrera, B., Clarke, R. M., Miller, A., Nam, S. W., Romani, R. W., Saab, T., & Young, B. (2000) · Physica B Condensed Matter · doi:10.1016/s0921-4526(99)01849-9 · Cited by 29
Direct laser written polymer waveguides with out of plane couplers for optical chips
Landowski, A., Zepp, D., Wingerter, S., von Freymann, G., & Widera, A. (2017) · APL Photonics · doi:10.1063/1.4994806 · Cited by 29
Artificial Life in Quantum Technologies
Alvarez-Rodriguez, U., Sanz, M., Lamata, L., & Solano, E. (2016) · Scientific Reports · doi:10.1038/srep20956 · Cited by 29 · cited 1×
“Special attention is paid to direct laser-written waveguides since they offer the possibility of implementing complex lattice geometries including the third spatial dimension [129, 130], and consequently of utilization for investigating systems beyond the standard model [131], in quantum biophysics [132–134], and in q…”
BackgroundReview Article: Quasi-phase-matching engineering of entangled photons
Xu, P., & Zhu, S. N. (2012) · AIP Advances · doi:10.1063/1.4773457 · Cited by 26 · cited 1×
“Furthermore, it is possible to have a greater variety in degrees of freedom for source engineering by applying a quasi-phase matching condition in periodically poled crystals [41, 45, 52].”
BackgroundLusardi, N., Los, J. W. N., Gourgues, R. B. M., Bulgarini, G., & Geraci, A. (2017) · Review of Scientific Instruments · doi:10.1063/1.4977594 · Cited by 25
Reading boundless error-free bits using a single photon
Guha, S., & Shapiro, J. H. (2013) · Physical Review A · doi:10.1103/physreva.87.062306 · Cited by 24
Phase-stable source of polarization-entangled photons in a linear double-pass configuration
Steinlechner, F., Ramelow, S., Jofre, M., Basset, M. G., Jennewein, T. D., Pérez Torres, J., Mitchell, M. W., & Pruneri, V. (2013) · LA Referencia (Red Federada de Repositorios Institucionales de Publicaciones Científicas) · Cited by 24
Radiation-loss management in modulated waveguides
Eichelkraut, T., Weimann, S., Stützer, S., Nolte, S., & Szameit, A. (2014) · Optics Letters · doi:10.1364/ol.39.006831 · Cited by 23
Self-citationCorrelations of indistinguishable particles in non-Hermitian lattices
Gräfe, M., Heilmann, R., Keil, R., Eichelkraut, T., Heinrich, M., Nolte, S., & Szameit, A. (2013) · New Journal of Physics · doi:10.1088/1367-2630/15/3/033008 · Cited by 23
Self-citationEngineering an ideal indistinguishable photon-pair source for optical quantum information processing
Rangarajan, R., Vicent, L. E., U’Ren, A. B., & Kwiat, P. G. (2010) · Journal of Modern Optics · doi:10.1080/09500340.2010.529515 · Cited by 21
Superballistic growth of the variance of optical wave packets
Stützer, S., Kottos, T., Tünnermann, A., Nolte, S., Christodoulides, D. N., & Szameit, A. (2013) · Optics Letters · doi:10.1364/ol.38.004675 · Cited by 18
Self-citationRobust and scalable scheme to generate large-scale entanglement webs
Fujii, K., Maeda, H., & Yamamoto, K. (2011) · Physical Review A · doi:10.1103/physreva.83.050303 · Cited by 17 · cited 2×
“The inherent spatial quantum ‘parallelism’ could be potentially exploited for a number of applications ranging from quantum key distribution and communication schemes to quantum networks [83].”
BackgroundOn Multi‐Particle Entanglement
Linden, N., & Popescu, S. (1999) · Wiley eBooks · doi:10.1002/3527603093.ch14 · Cited by 16
Shlesinger, M. F. (2006) · Nature Physics · doi:10.1038/nphys221 · Cited by 13 · cited 1×
“Nowadays, random walks are utilized to describe many kinds of processes, for instance estimating the size of the world wide web [4], modeling species population statistics [5], and describing the circulation of dollar bills throughout the United States of America [6].”
BackgroundDETERMINISTIC SECURE QUANTUM COMMUNICATION WITH FOUR-QUBIT W STATES
YUAN, H., SONG, J., LIU, X.-Y., CHENG, S., HOU, K., & HAN, L.-F. (2011) · International Journal of Quantum Information · doi:10.1142/s0219749911006879 · Cited by 10
Two-particle quantum correlations at graphene edges
Gräfe, M., & Szameit, A. (2015) · 2D Materials · doi:10.1088/2053-1583/2/3/034005 · Cited by 9
Self-citationOn-chip generation of Einstein-Podolsky-Rosen states with arbitrary symmetry
Gräfe, M., Heilmann, R., Nolte, S., & Szameit, A. (2015) · Applied Physics Letters · doi:10.1063/1.4920934 · Cited by 8
Self-citationZur Theorie der Brownschen Bewegung
Steubing, W. (1908) · Zeitschrift für Chemie und Industrie der Kolloide · doi:10.1007/bf01504388 · Cited by 3
Quantum random walks in waveguide lattices
Keil, R. R. N. (2014) · Publikationsdatenbank der Fraunhofer-Gesellschaft (Fraunhofer-Gesellschaft) · Cited by 2
Cabrera, B. (2002) · Springer eBooks · doi:10.1007/978-1-4615-0737-6_15 · Cited by 1
Cahall, C., Nicolich, K. L., Islam, N. T., Lafyatis, G. P., Miller, A., Gauthier, D. J., & Kim, J. (2018) · Conference on Lasers and Electro-Optics · doi:10.1364/cleo_qels.2018.fw3f.2 · Cited by 1 · cited 1×
“Recent research results promise a photon number resolution [59, 60], a two-dimensional spatial resolution [61], and the arangement as one-dimensional detection array [62, 63].”
BackgroundFermionic time-reversal symmetry in a photonic topological insulator
Maczewsky, L. J., Höckendorf, B., Kremer, M., et al. (2018) · arXiv · doi:10.48550/arxiv.1812.07930
Research works printed but not linked: 1
- Yariv A 1989 Quantum Electronics (New York: Wiley)
Cited by
Tan, D., Wang, Z., Xu, B., & Qiu, J. (2021) · Advanced Photonics · doi:10.1117/1.ap.3.2.024002 · Cited by 185
Quantum state processing through controllable synthetic temporal photonic lattices
Monika, M., Nosrati, F., George, A., Sciara, S., Fazili, R., Muniz, A. L. M., Bisianov, A., Franco, R. L., Munro, W. J., Chemnitz, M., et al. (2024) · Nature Photonics · doi:10.1038/s41566-024-01546-4 · Cited by 47
Comparison of quantum-walk implementations on noisy intermediate-scale quantum computers
Γεωργόπουλος, Κ., Emary, C., & Zuliani, P. (2021) · Physical Review A · doi:10.1103/physreva.103.022408 · Cited by 28
Higher-order topological biphoton corner states in two-dimensional photonic lattices
Li, C., Li, M., Yan, L., Ye, S., Hu, X., Gong, Q., & Li, Y. (2022) · Physical Review Research · doi:10.1103/physrevresearch.4.023049 · Cited by 20
Quantum simulations with multiphoton Fock states
Sturges, T. J., McDermott, T. C., Buraczewski, A., Clements, W. R., Renema, J. J., Nam, S. W., Gerrits, T., Lita, A., Kolthammer, W. S., Eckstein, A., et al. (2021) · npj Quantum Information · doi:10.1038/s41534-021-00427-w · Cited by 34
Metadata
- Authors
- Gräfe, M., & Szameit, A.
- Affiliations
- Fraunhofer Institute for Applied Optics and Precision Engineering (DE)
- University of Rostock (DE)
- Corresponding author
- Gräfe, Markus
- Venue
- Journal of Physics B: Atomic, Molecular and Optical Physics
- Publisher
- IOP Publishing
- Published
- 2020-03-10
- Volume
- 53
- Issue
- 7
- Pages
- 073001
- ISSN
- 0953-4075 (ISSN-L)
- 1361-6455
- OpenAlex
- W2999198815
- Semantic Scholar
- 91be1f1c160bb3a3e2a9efacd7d82e23b333e579
- Cited by
- 28
- References
- 174
- Citations by year
- 2025: 5 · 2024: 5 · 2023: 5 · 2022: 4 · 2021: 9
- FWCI
- 1.74
- Type
- journal article
- Language
- en
- Open access
- hybrid
- doi.org
- Licence
- cc-by
- publishingsupport.iopscience.iop.org/iop-standard/v1 (vor)
- iopscience.iop.org/info/page/text-and-data-mining (tdm)
- Locations
- Journal of Physics B Atomic Molecular and Optical Physics (publishedVersion, cc-by)
- Publikationsdatenbank der Fraunhofer-Gesellschaft (Fraunhofer-Gesellschaft) (submittedVersion)
- Fraunhofer-Publica (Fraunhofer-Gesellschaft) (submittedVersion)
- Funders
- Deutsche Forschungsgemeinschaft (SZ 276/12-11)
- Fraunhofer-Gesellschaft (QUILT)
- Topics
- Physical Sciences › Computer Science › Artificial Intelligence › Quantum Computing Algorithms and Architecture
- Physical Sciences › Physics and Astronomy › Atomic and Molecular Physics, and Optics › Quantum Information and Cryptography
- Physical Sciences › Physics and Astronomy › Atomic and Molecular Physics, and Optics › Quantum optics and atomic interactions
- Keywords
- quantum walks, integrated photonics, single photons, photon pairs, two-photon correlations, nonclassical correlations
About these checks
Registry, retraction, Cites and statistics results are computed, not judged, with one exception: a printed reference that no index lists is read once by a model before it counts as a citation error. Claims are extracted by a model and kept only when their quote appears verbatim in the text; each cited source is then checked, with a model’s help, for whether it says what the claim relies on. Those verdicts can be wrong — read the claim’s quote and the cited source before relying on one.
The claim verdicts this report counts are experimental: their accuracy is not yet measured.
A language model drew the claims from the paper on 2026-10-07, under version 3 of the claim definition (model deepseek-v4.1-flash, prompt extract-v3).
A second model labelled each claim on 2026-10-07 (model jev-1.13-20260917, definition revision gold-guideline-v0.2).
Cited sources are checked with a language model’s help (gpt-6-sol).
Statistics and arithmetic are recomputed, not judged.
Confidence bands are shown only for fields calibrated on our annotated test set. None is calibrated yet, so no band is shown.
What counts as a claim ›How we measure confidence ›How we check this ›
Are you an author, or do you see a problem with this page? Request a review
Data sources
Bibliographic data: Semantic Scholar, OpenAlex, Crossref.
Contains information from the Semantic Scholar Academic Graph Datasets, made available under the ODC Attribution License (ODC-BY 1.0).
Semantic Scholar’s data is described in: Kinney, R., et al. (2023). The Semantic Scholar Open Data Platform. arXiv:2301.10140.
