

The DOI matches its Crossref record; 9 of the 9 references it cites were found in a registry or an index.
Manipulation of edge states in microwave artificial graphene
Overview
The claims and statistics of this paper haven’t been checked yet.
Run the check — free, no account needed. It reads the open-access text and checks the sources it cites.
Integrity signals
Registry
Cites
Statistics
Figures
Verification
Claims the paper makes
The claims and statistics of this paper haven’t been checked yet.
Run the check — free, no account needed. It reads the open-access text and checks the sources it cites.
Claims other papers make about this one
Each is checked against this paper’s own text: does it say what the citing paper says it does?
The source backs part of the claim, not all of it — or backs it for a different population, condition or comparison.
In the citing paper
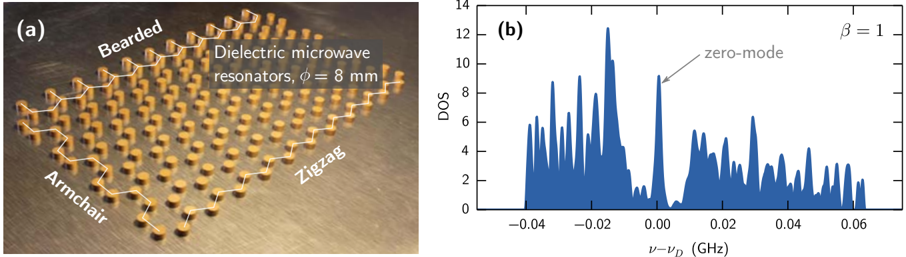
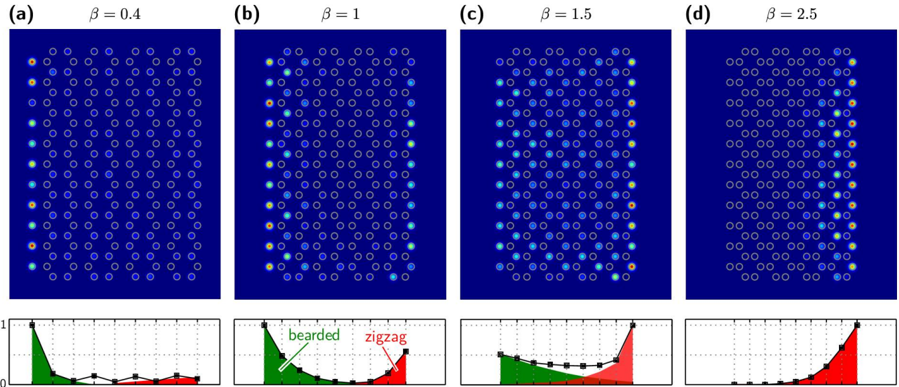
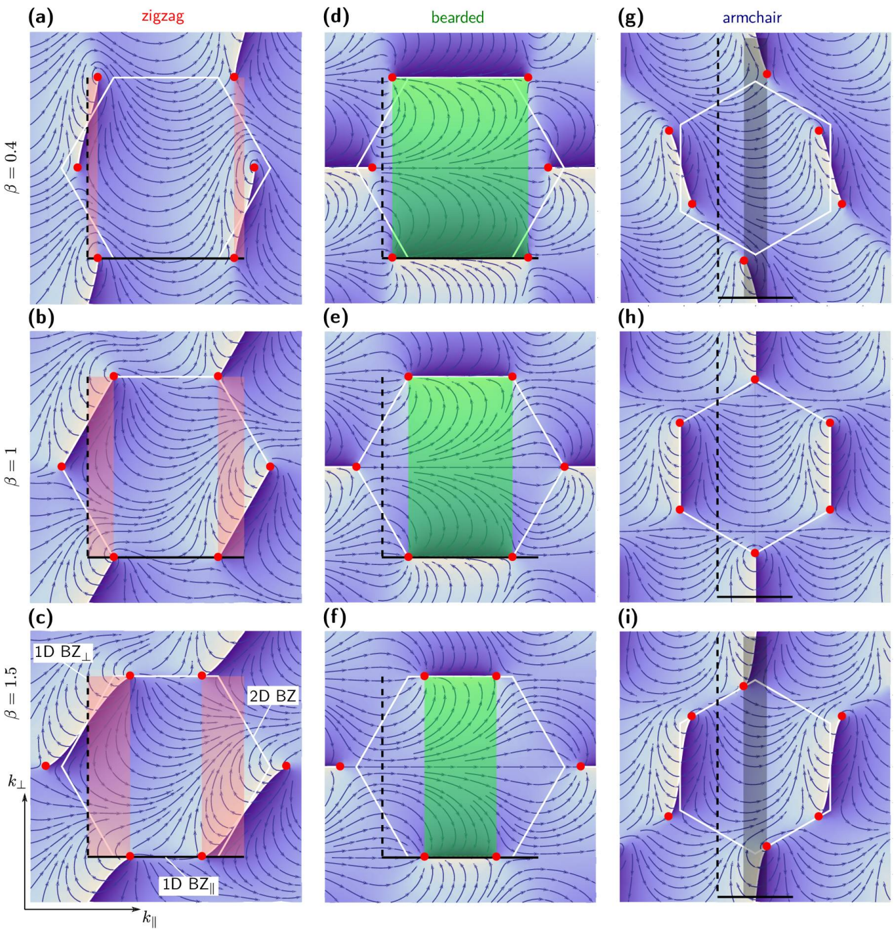
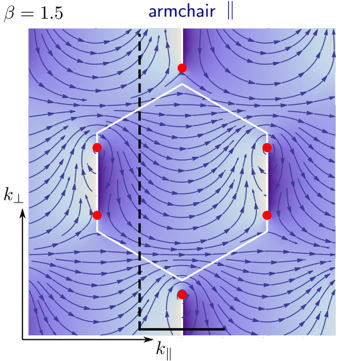
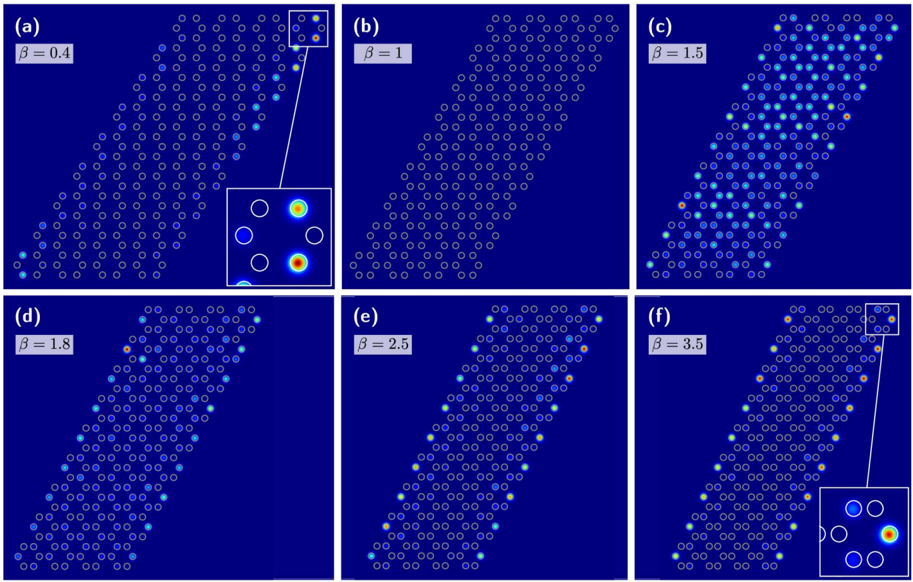
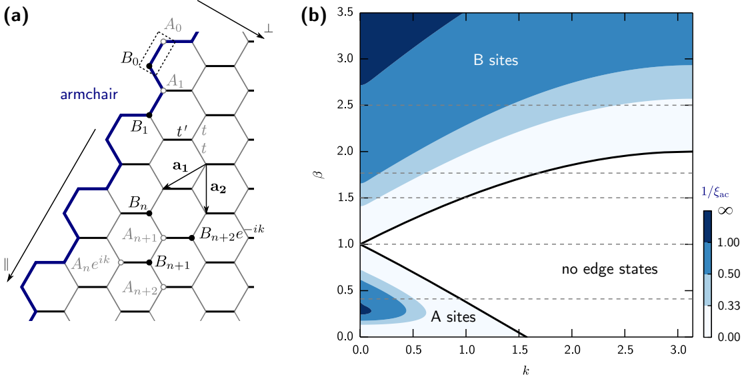
“Their existence has been evidenced experimentally in lattices of coupled waveguides (Plotnik et al., 2014), microwave resonators (Bittner et al., 2012;Bellec et al., 2014), and polaritons (Milićević et al., 2015), showing that edge states for zigzag and bearded terminations connect Dirac cones in complementary regions in momentum space [Figs. 25(b) and 25(e)], while armchair terminations do not”
From Topological photonics (2019) · cites this paper as Bellec et al., 2014
Experimental — accuracy not yet measuredThe cited source says what the claim attributes to it.
In the citing paper
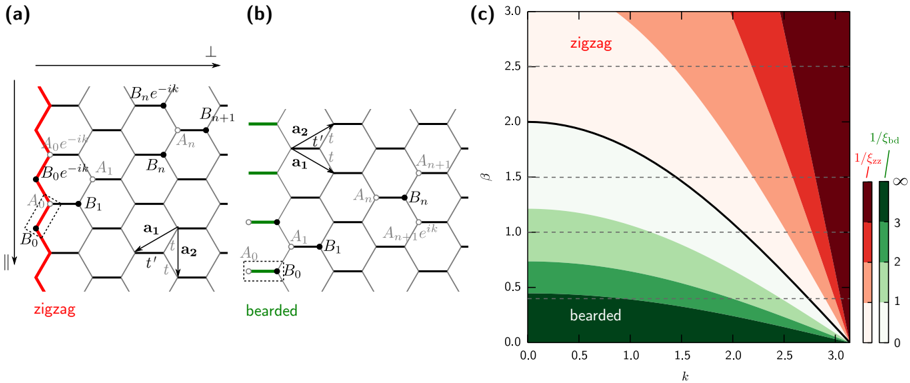
“Experiments in lattices of microwave resonators and coupled waveguides (Rechtsman, Plotnik et al., 2013;Bellec et al., 2014) have shown that above the transition point (t 1 > 2t 2 ), ribbons with zigzag terminations contain a flat energy band of edge states covering the whole momentum space, while for bearded boundaries, edge states disappear.”
From Topological photonics (2019) · cites this paper as Bellec et al., 2014
Self-check
Percentages, sums and reported differences re-computed from the paper’s own numbers.
The self-check needs the paper’s full text.
Citations
Cites
Energy gaps and a zero-field quantum Hall effect in graphene by strain engineering
Guinea, F., Katsnelson, M. I., & Geim, A. K. (2010) · Nature Physics · doi:10.1038/nphys1420 · Cited by 1,913
Creating, moving and merging Dirac points with a Fermi gas in a tunable honeycomb lattice
Tarruell, L., Greif, D., Uehlinger, T., Jotzu, G., & Esslinger, T. (2012) · Nature · doi:10.1038/nature10871 · Cited by 972
Designer Dirac fermions and topological phases in molecular graphene
Gomes, K. K., Mar, W., Ko, W., Guinea, F., & Manoharan, H. C. (2012) · Nature · doi:10.1038/nature10941 · Cited by 741
Zak phase and the existence of edge states in graphene
Delplace, P., Ullmo, D., & Montambaux, G. (2011) · Physical Review B · doi:10.1103/physrevb.84.195452 · Cited by 541
Self-citationDirect Observation of Dirac Cones and a Flatband in a Honeycomb Lattice for Polaritons
Jacqmin, T., Carusotto, I., Sagnes, I., Abbarchi, M., Solnyshkov, D. D., Malpuech, G., Galopin, E., Lemaître, A., Bloch, J., & Amo, A. (2014) · Physical Review Letters · doi:10.1103/physrevlett.112.116402 · Cited by 509
Strain-induced pseudomagnetic field and photonic Landau levels in dielectric structures
Rechtsman, M. C., Zeuner, J. M., Tünnermann, A., Nolte, S., Segev, M., & Szameit, A. (2013) · Nature Photonics · doi:10.1038/nphoton.2012.302 · Cited by 453
Observation of unconventional edge states in ‘photonic graphene’
Plotnik, Y., Rechtsman, M. C., Song, D., Heinrich, M., Zeuner, J. M., Nolte, S., Lumer, Y., Malkova, N., Xu, J., Szameit, A., et al. (2014) · Nature Materials · doi:10.1038/nmat3783 · Cited by 389
Topological Creation and Destruction of Edge States in Photonic Graphene
Rechtsman, M. C., Plotnik, Y., Zeuner, J. M., Song, D., Chen, Z., Szameit, A., & Segev, M. (2013) · Physical Review Letters · doi:10.1103/physrevlett.111.103901 · Cited by 302
Topological Transition of Dirac Points in a Microwave Experiment
Bellec, M., Kuhl, U., Montambaux, G., & Mortessagne, F. (2013) · Physical Review Letters · doi:10.1103/physrevlett.110.033902 · Cited by 189
Self-citation
Research works printed but not linked: 26
- 10.1103/PhysRevLett.95.226801 · DOI · Paper page
- 10.1126/science.1133734 · DOI · Paper page
- 10.1103/PhysRevLett.96.106802 · DOI · Paper page
- 10.1103/PhysRevLett.61.2015 · DOI · Paper page
- 10.1103/RevModPhys.82.3045 · DOI · Paper page
- 10.1103/PhysRevB.54.17954 · DOI · Paper page
- 10.1103/PhysRevB.73.235411 · DOI
- 10.1103/PhysRevB.76.205402 · DOI · Paper page
- 10.1103/PhysRevB.71.193406 · DOI
- 10.1103/PhysRevB.73.085421 · DOI
- 10.1103/PhysRevLett.89.077002 · DOI · Paper page
- 10.1126/science.1204333 · DOI
- 10.1103/PhysRevB.82.014301 · DOI · Paper page
- 10.1103/PhysRevB.82.094308 · DOI
- 10.1038/nnano.2013.161 · DOI · Paper page
- 10.1038/nphys2063 · DOI · Paper page
- 10.1038/nphoton.2012.236 · DOI · Paper page
- 10.1016/j.ssc.2012.04.019 · DOI
- Wunsch B, 2008, New J. Phys., 10, 10.1088/1367-2630/10/10/103027 · DOI
- 10.1103/PhysRevB.80.153412 · DOI · Paper page
- 10.1103/PhysRevB.80.045401 · DOI · Paper page
- 10.1103/PhysRevB.88.115437 · DOI · Paper page
- 10.1103/PhysRevLett.62.2747 · DOI · Paper page
- 10.1140/epjb/e2009-00383-0 · DOI
- 10.1103/RevModPhys.81.109 · DOI · Paper page
- 10.1103/PhysRevB.87.245413 · DOI
Cited by
Sorted by citations
Ozawa, T., Price, H. M., Amo, A., Goldman, N., Hafezi, M., Lu, L., Rechtsman, M. C., Schuster, D., Simon, J., Zilberberg, O., et al. (2019) · Reviews of Modern Physics · doi:10.1103/revmodphys.91.015006 · Cited by 3,722
Lu, L., Joannopoulos, J. D., & Soljačić, M. (2014) · Nature Photonics · doi:10.1038/nphoton.2014.248 · Cited by 3,655
Metadata
- Authors
- Bellec, M., Kuhl, U., Montambaux, G., & Mortessagne, F.
- Venue
- New Journal of Physics
- Publisher
- IOP Publishing
- Published
- 2014-11-11
- Volume
- 16
- Issue
- 11
- Pages
- 113023
- ISSN
- 1367-2630
- Cited by
- 65
- References
- 9
About these checks
Registry, retraction, Cites and statistics results are computed, not judged, with one exception: a printed reference that no index lists is read once by a model before it counts as a citation error. Claims are extracted by a model and kept only when their quote appears verbatim in the text; each cited source is then checked, with a model’s help, for whether it says what the claim relies on. Those verdicts can be wrong — read the claim’s quote and the cited source before relying on one.
Statistics and arithmetic are recomputed, not judged.
Confidence bands are shown only for fields calibrated on our annotated test set. None is calibrated yet, so no band is shown.
What counts as a claim ›How we measure confidence ›How we check this ›
Are you an author, or do you see a problem with this page? Request a review
