

The DOI matches its Crossref record; 5 of the 5 references it cites were found in a registry or an index.
Global premature mortality due to anthropogenic outdoor air pollution and the contribution of past climate change
Overview
The claims and statistics of this paper haven’t been checked yet.
Run the check — free, no account needed. It reads the open-access text and checks the sources it cites.
Integrity signals
Registry
Cites
Statistics
Figures
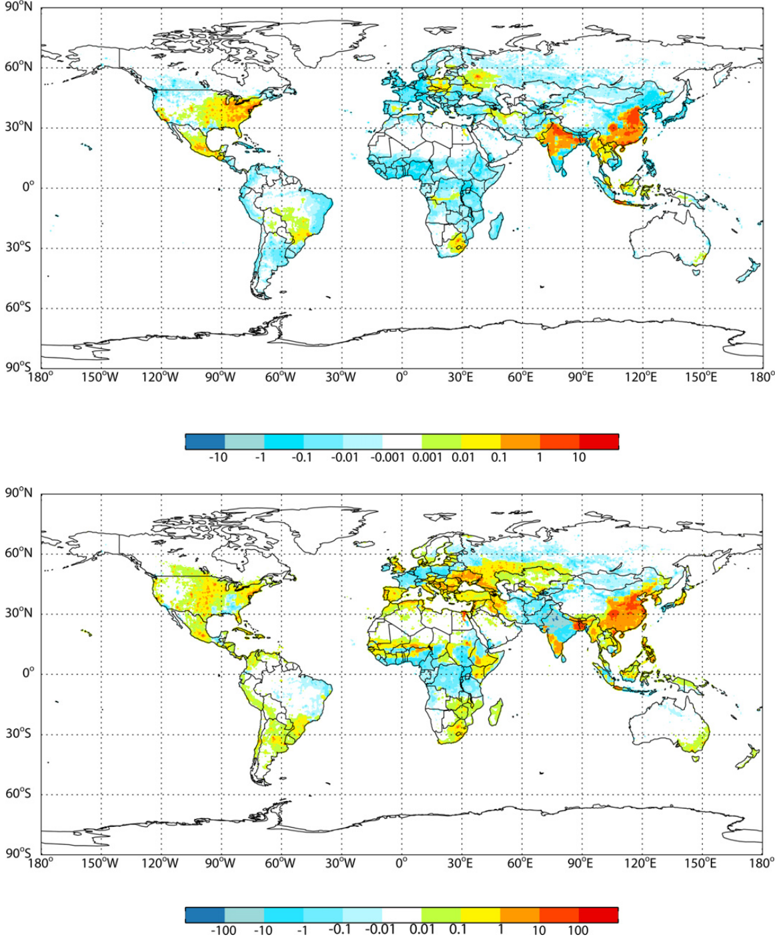
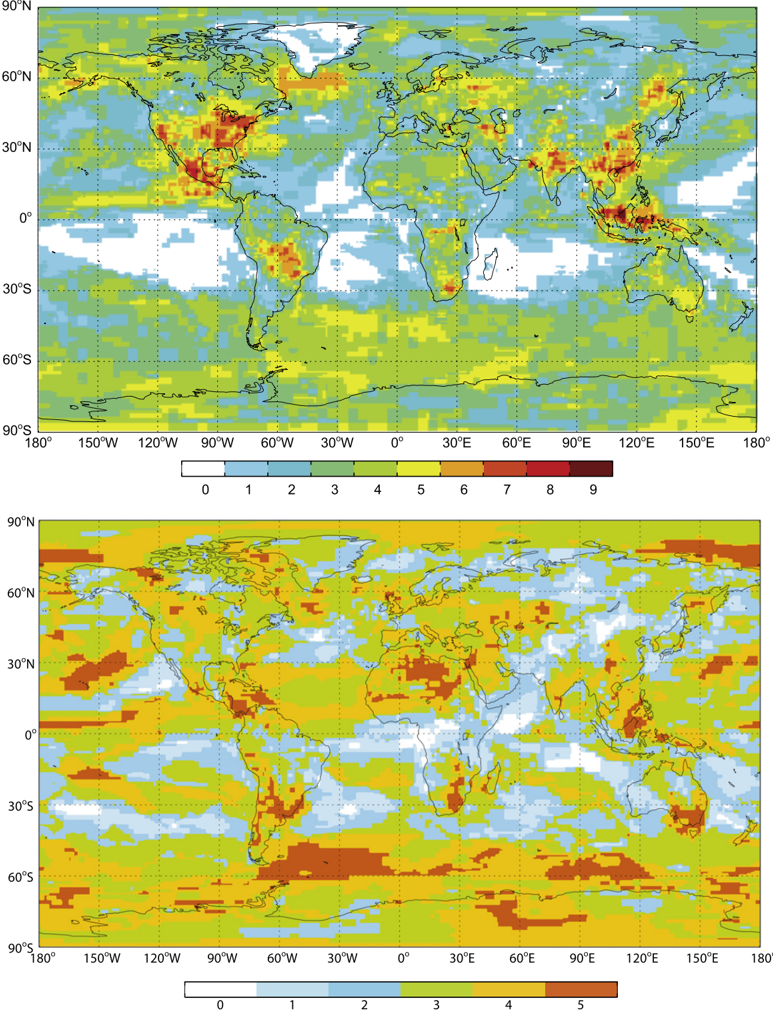
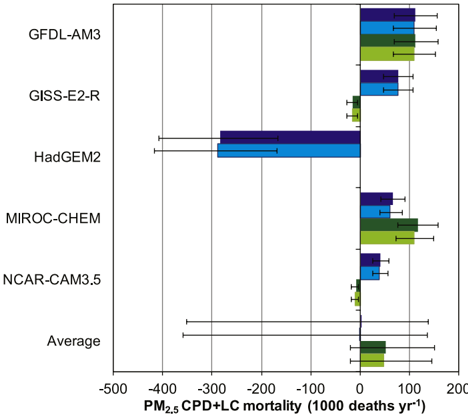
Verification
Claims the paper makes
The claims and statistics of this paper haven’t been checked yet.
Run the check — free, no account needed. It reads the open-access text and checks the sources it cites.
Claims other papers make about this one
Each is checked against this paper’s own text: does it say what the citing paper says it does?
In the citing paper
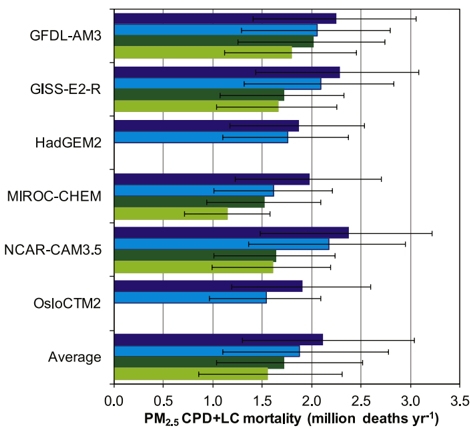
“the annual mortality attributed to PM2.5 is around 2.1 million deaths, but past climate change may account for approximately 2,200 annual deaths from PM2.5 [239].”
From Particle toxicology and health - where are we? (2019) · cites this paper as [239]
Self-check
Percentages, sums and reported differences re-computed from the paper’s own numbers.
The self-check needs the paper’s full text.
Citations
Cites
Lamarque, J.-F., Bond, T. C., Eyring, V., Granier, C., Heil, A., Klimont, Z., Lee, D., Liousse, C., Mieville, A., Owen, B., et al. (2010) · Atmospheric Chemistry and Physics · doi:10.5194/acp-10-7017-2010 · Cited by 2,105
Self-citationLong-term ozone exposure and mortality
Jerrett, M., Burnett, R. T., Pope, C. A., Ito, K., Thurston, G., Krewski, D., Shi, Y., Calle, E., & Thun, M. (2009) · New England Journal of Medicine · doi:10.1056/nejmoa0803894 · Cited by 1,602
Anenberg, S. C., Horowitz, L. W., Tong, D. Q., & West, J. J. (2010) · Environmental Health Perspectives · doi:10.1289/ehp.0901220 · Cited by 747
Self-citationClimate change, ambient ozone, and health in 50 US cities
Bell, M. L., Goldberg, R., Hogrefe, C., Kinney, P. L., Knowlton, K., Lynn, B., Rosenthal, J., Rosenzweig, C., & Patz, J. A. (2007) · Climatic Change · doi:10.1007/s10584-006-9166-7 · Cited by 346
Analysis of present-day and future OH and methane lifetime in the ACCMIP simulations
Voulgarakis, A., Naik, V., Lamarque, J.-F., Shindell, D. T., Young, P. J., Prather, M. J., Wild, O., Field, R. D., Bergmann, D., Cameron-Smith, P., et al. (2013) · Atmospheric chemistry and physics · doi:10.5194/acp-13-2563-2013 · Cited by 324
Research works printed but not linked: 29
- 10.1001/jama.292.19.2372 · DOI · Paper page
- 10.1021/es2025752 · DOI
- Cohen A J, 2004, Comparative Quantification of Health Risks: Global and Regional Burden of Disease Attributable to Selected Major Risk Factors, 2, 1353
- Dobson J E, 2000, Photogramm. Eng. Remote Sens., 66, 849
- 10.5194/acp-13-1377-2013 · DOI
- 10.1039/c2cs35095e · DOI
- 2004, Health Effects of Outdoor Air Pollution in Developing Countries of Asia: A Literature Review (HEI Special Report 15)
- 2010, Public Health and Air Pollution in Asia (PAPA): Coordinated Studies of Short-Term Exposure to Air Pollution and Daily Mortality in Four Cities (HEI Research Report 154)
- 10.1016/S0140-6736(02)11280-3 · DOI
- 10.1016/j.atmosenv.2008.09.051 · DOI · Paper page
- 10.1289/ehp.7163 · DOI
- Krewski D, 2009, Extended Follow-Up and Spatial Analysis of the American Cancer Society Study Linking Particulate Air Pollution and Mortality (HEI Research Report 140)
- 10.5194/gmd-6-179-2013 · DOI
- 10.1289/ehp.1104660 · DOI · Paper page
- 10.1016/S0140-6736(12)61766-8 · DOI · Paper page
- 10.1183/09031936.00210411 · DOI
- 10.5194/acp-12-11485-2012 · DOI
- 10.1289/ehp.1103639 · DOI
- 10.1289/ehp.1104271 · DOI
- Punger E M, 2013, Air Qual. Atmos. Health
- 10.5194/acp-6-5225-2006 · DOI
- Selin N E, 2009, Environ. Res. Lett., 4, 10.1088/1748-9326/4/4/044014 · DOI
- 10.1016/j.amepre.2011.04.017 · DOI
- 10.5194/acp-13-2939-2013 · DOI
- 10.5194/acp-13-3063-2013 · DOI
- 10.1021/es803650w · DOI
- 10.1175/2009BAMS2568.1 · DOI
- 10.1016/j.crte.2007.08.005 · DOI
- 10.5194/acp-13-2063-2013 · DOI
Cited by
Sorted by citations
The contribution of outdoor air pollution sources to premature mortality on a global scale
Lelieveld, J., Evans, J. S., Fnais, M., Giannadaki, D., & Pozzer, A. (2015) · Nature · doi:10.1038/nature15371 · Cited by 5,977
Interactions of climate change, air pollution, and human health.
Kinney, P. L. (2018) · Current Environmental Health Reports · doi:10.1007/s40572-018-0188-x · Cited by 317
Malley, C. S., Henze, D. K., Kuylenstierna, J. C. I., Vallack, H. W., Davila, Y., Anenberg, S. C., Turner, M. C., & Ashmore, M. R. (2017) · Environmental Health Perspectives · doi:10.1289/ehp1390 · Cited by 305
“…the ln-HR for a 10-ppb increase in O 3 concentration (6mDM1h metric) from the two-pollutant model adjusted for PM 2 : 5 (HR = 1 : 040; 95% CI: 1.013, 1.067), which has been applied in several previous analyses (Anenberg et al. 2010; Fann et al. 2012; Silva et al. 2013, 2016a; West et al. 2013).”
InfluentialFuture global mortality from changes in air pollution attributable to climate change
Silva, R. A., West, J. J., Lamarque, J.-F., Shindell, D. T., Collins, W. J., Faluvegi, G., Folberth, G. A., Horowitz, L. W., Nagashima, T., Naik, V., et al. (2017) · Nature Climate Change · doi:10.1038/nclimate3354 · Cited by 277
Self-citationParticle toxicology and health - where are we?
Riediker, M., Zink, D., Kreyling, W., Oberdörster, G., Elder, A., Graham, U., Lynch, I., Duschl, A., Ichihara, G., Ichihara, S., et al. (2019) · Particle and Fibre Toxicology · doi:10.1186/s12989-019-0302-8 · Cited by 237
Semple, S., Apsley, A., Azmina Ibrahim, T., Turner, S. W., & Cherrie, J. W. (2015) · Tobacco Control · doi:10.1136/tobaccocontrol-2014-051635 · Cited by 80
Chen, K., Zhou, L., Chen, X., Bi, J., & Kinney, P. L. (2017) · Environmental Research · doi:10.1016/j.envres.2017.02.009 · Cited by 75
Towards a comprehensive climate impacts assessment of solar geoengineering
Irvine, P. J., Kravitz, B., Lawrence, M. G., Gerten, D., Caminade, C., Gosling, S. N., Hendy, E. J., Kassie, B. T., Kissling, W. D., Muri, H., et al. (2017) · Earth s Future · doi:10.1002/2016ef000389 · Cited by 70
Chowdhury, S., Pozzer, A., Dey, S., Klingmueller, K., & Lelieveld, J. (2020) · Environmental Research Letters · doi:10.1088/1748-9326/ab8334 · Cited by 64
Metadata
- Authors
- Silva, R. A., West, J. J., Zhang, Y., Anenberg, S. C., Lamarque, J.-F., Shindell, D. T., Collins, W. J., Dalsoren, S., Faluvegi, G., Folberth, G., Horowitz, L. W., Nagashima, T., Naik, V., Rumbold, S., Skeie, R., Sudo, K., Takemura, T., Bergmann, D., Cameron-Smith, P., Cionni, I., Doherty, R. M., Eyring, V., Josse, B., MacKenzie, I. A., Plummer, D., Righi, M., Stevenson, D. S., Strode, S., Szopa, S., & Zeng, G.
- Venue
- Environmental Research Letters
- Publisher
- IOP Publishing
- Published
- 2013-07-11
- Volume
- 8
- Issue
- 3
- Pages
- 034005
- ISSN
- 1748-9326
- Cited by
- 391
- References
- 5
About these checks
Registry, retraction, Cites and statistics results are computed, not judged, with one exception: a printed reference that no index lists is read once by a model before it counts as a citation error. Claims are extracted by a model and kept only when their quote appears verbatim in the text; each cited source is then checked, with a model’s help, for whether it says what the claim relies on. Those verdicts can be wrong — read the claim’s quote and the cited source before relying on one.
Statistics and arithmetic are recomputed, not judged.
Confidence bands are shown only for fields calibrated on our annotated test set. None is calibrated yet, so no band is shown.
What counts as a claim ›How we measure confidence ›How we check this ›
Are you an author, or do you see a problem with this page? Request a review
