

The DOI matches its Crossref record; 10 of the 10 references it cites were found in a registry or an index.
Phosphatidylinositol-(4,5)-bisphosphate regulates clathrin-coated pit initiation, stabilization, and size
Abstract
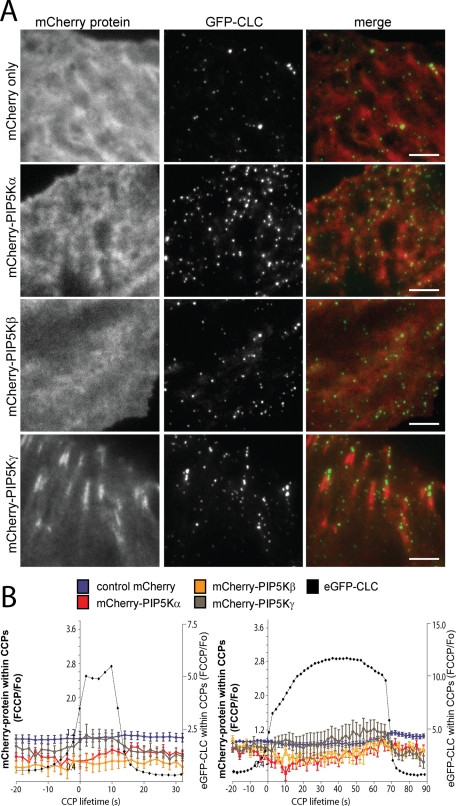
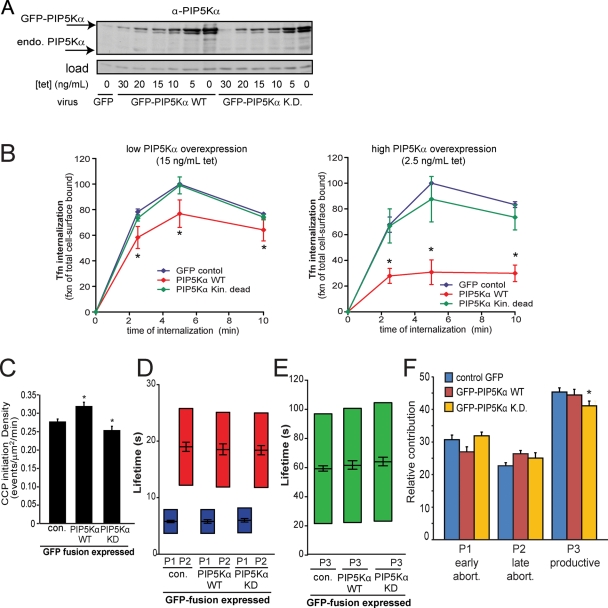
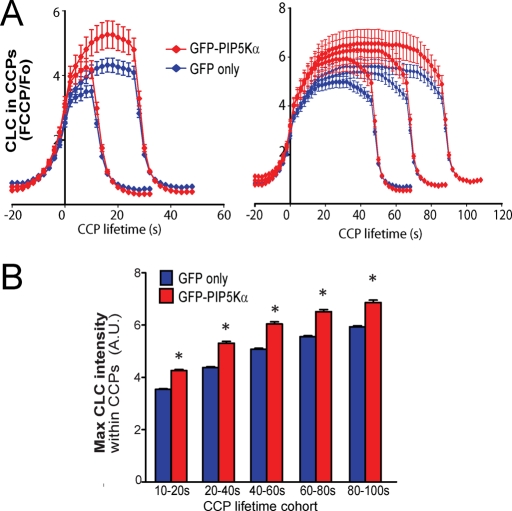
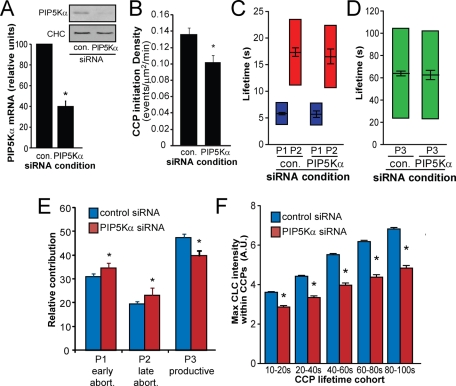
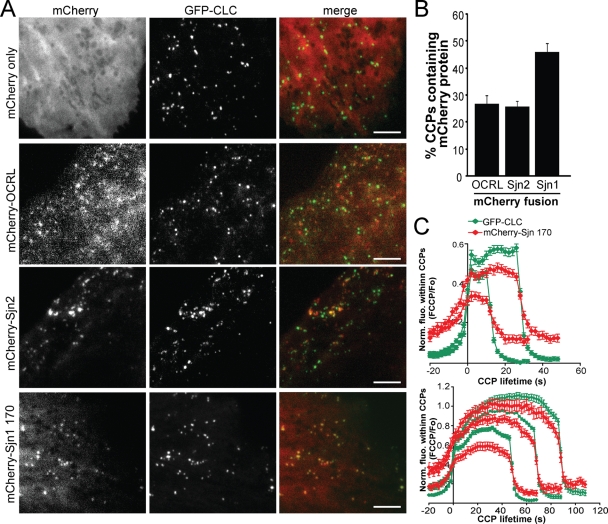
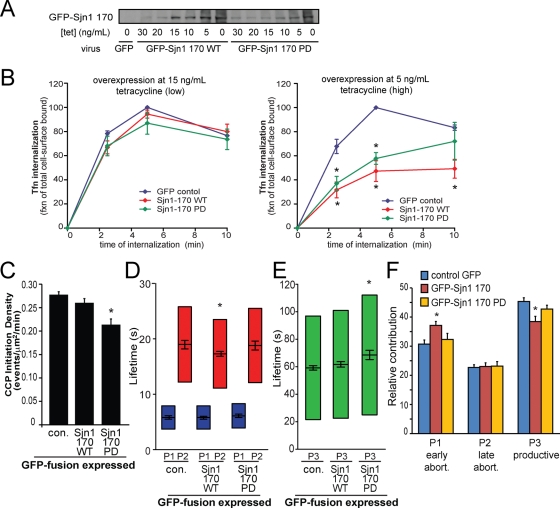
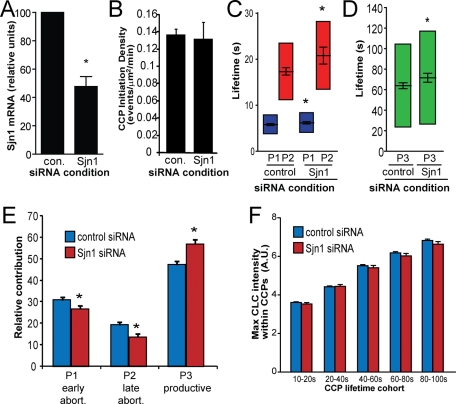
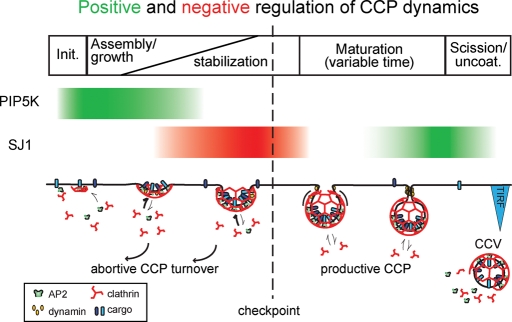
Clathrin-mediated endocytosis (CME) is the major mechanism for internalization in mammalian cells. CME initiates by recruitment of adaptors and clathrin to form clathrin-coated pits (CCPs). Nearly half of nascent CCPs abort, whereas others are stabilized by unknown mechanisms and undergo further maturation before pinching off to form clathrin-coated vesicles (CCVs). Phosphatidylinositol-(4,5)-bisphosphate (PIP 2 ), the main lipid binding partner of endocytic proteins, is required for CCP assembly, but little is currently known about its contribution(s) to later events in CCV formation. Using small interfering RNA (siRNA) knockdown and overexpression, we have analyzed the effects of manipulating PIP 2 synthesis and turnover on CME by quantitative total internal reflection fluorescence microscopy and computational analysis. Phosphatidylinositol-4-phosphate-5-kinase cannot be detected within CCPs but functions in initiation and controls the rate and extent of CCP growth. In contrast, the 5′-inositol phosphatase synaptojanin 1 localizes to CCPs and controls early stabilization and maturation efficiency. Together these results suggest that the balance of PIP 2 synthesis in the bulk plasma membrane and its local turnover within CCPs control multiple stages of CCV formation.
Overview
The claims and statistics of this paper haven’t been checked yet.
Run the check — free, no account needed. It reads the open-access text and checks the sources it cites.
Integrity signals
Registry
Cites
Statistics
Figures
Verification
Claims the paper makes
The claims and statistics of this paper haven’t been checked yet.
Run the check — free, no account needed. It reads the open-access text and checks the sources it cites.
Claims other papers make about this one
Each is checked against this paper’s own text: does it say what the citing paper says it does?
In the citing paper
“It has been well established that PIP2, the predominant PI formed at the plasma membrane, is required for clathrin-mediated endocytosis, with roles in clathrin-coated pit initiation, stabilization, and maturation14-17.”
From Transmembrane Protein 55B Is a Novel Regulator of Cellular Cholesterol Metabolism (2014) · cites this paper as [16]
Self-check
Percentages, sums and reported differences re-computed from the paper’s own numbers.
The self-check needs the paper’s full text.
Citations
Cites
PIP2and Proteins: Interactions, Organization, and Information Flow
McLaughlin, S., Wang, J., Gambhir, A., & Murray, D. (2002) · Annual Review of Biophysics and Biomolecular Structure · doi:10.1146/annurev.biophys.31.082901.134259 · Cited by 837
A High Precision Survey of the Molecular Dynamics of Mammalian Clathrin-Mediated Endocytosis
Taylor, M. J., Perrais, D., & Merrifield, C. J. (2011) · PLoS Biology · doi:10.1371/journal.pbio.1000604 · Cited by 754
Localized Biphasic Changes in Phosphatidylinositol-4,5-Bisphosphate at Sites of Phagocytosis
Botelho, R. J., Teruel, M., Dierckman, R., Anderson, R., Wells, A., York, J. D., Meyer, T., & Grinstein, S. (2000) · The Journal of Cell Biology · doi:10.1083/jcb.151.7.1353 · Cited by 539 · cited 2×
“This approach has been used to reveal PIP2 enrichment in larger structures such as sites of phagocytosis (Botelho et al., 2000) and the cleavage furrows of dividing Drosophila spermatocytes (Wong et al., 2005).”
MethodMerrifield, C. J., Perrais, D., & Zenisek, D. (2005) · Cell · doi:10.1016/j.cell.2005.03.015 · Cited by 476 · cited 1×
“…we and others have begun to establish a temporal hierarchy of functional requirements of EAPs in CCP initiation, stabilization, and maturation (Merrifield et al., 2005; Rappoport et al., 2006; Saffarian and Kirchhausen, 2008; Mettlen et al., 2009; Loerke et al., 2011; Taylor et al., 2011).”
BackgroundRole of the ENTH Domain in Phosphatidylinositol-4,5-Bisphosphate Binding and Endocytosis
Itoh, T., Koshiba, S., Kigawa, T., Kikuchi, A., Yokoyama, S., & Takenawa, T. (2001) · Science · doi:10.1126/science.291.5506.1047 · Cited by 469
Di Paolo, G., Pellegrini, L., Letinic, K., Cestra, G., Zoncu, R., Voronov, S., Chang, S., Guo, J., Wenk, M. R., & De Camilli, P. (2002) · Nature · doi:10.1038/nature01147 · Cited by 441
The Mechanochemistry of Endocytosis
Liu, J., Sun, Y., Drubin, D. G., & Oster, G. F. (2009) · PLoS Biology · doi:10.1371/journal.pbio.1000204 · Cited by 222
Cargo- and adaptor-specific mechanisms regulate clathrin-mediated endocytosis
Mettlen, M., Loerke, D., Yarar, D., Danuser, G., & Schmid, S. L. (2010) · Journal of Cell Biology · doi:10.1083/jcb.200908078 · Cited by 177
Self-citationPhosphoinositide regulation of clathrin-mediated endocytosis
Haucke, V. (2005) · Biochemical Society Transactions · doi:10.1042/bst0331285 · Cited by 140
Kim, W. T., Chang, S., Daniell, L., Cremona, O., Di Paolo, G., & De Camilli, P. (2002) · Proceedings of the National Academy of Sciences · doi:10.1073/pnas.222657399 · Cited by 123
Research works printed but not linked: 51
- Abe N, 2008, J Cell Sci, 121, 1488, 10.1242/jcs.020792 · DOI · Paper page
- 10.1091/mbc.e10-05-0421 · DOI
- Bairstow SF, 2006, J Biol Chem, 281, 20632, 10.1074/jbc.M601465200 · DOI
- Barbieri MA, 2001, J Biol Chem, 276, 47212, 10.1074/jbc.C100490200 · DOI
- Carlton JG, 2005, Trends Cell Biol, 15, 540, 10.1016/j.tcb.2005.08.005 · DOI
- Catimel B, 2008, J Proteome Res, 7, 5295, 10.1021/pr800540h · DOI
- Chang-Ileto B, 2011, Dev Cell, 20, 206, 10.1016/j.devcel.2010.12.008 · DOI
- Choudhury R, 2009, J Biol Chem, 284, 9965, 10.1074/jbc.M807442200 · DOI
- Conner SD, 2003, Nature, 422, 37, 10.1038/nature01451 · DOI · Paper page
- Cremona O, 1999, Cell, 99, 179, 10.1016/S0092-8674(00)81649-9 · DOI · Paper page
- Doughman RL, 2003, J Membr Biol, 194, 77, 10.1007/s00232-003-2027-7 · DOI · Paper page
- Ehrlich M, 2004, Cell, 118, 591, 10.1016/j.cell.2004.08.017 · DOI · Paper page
- Ford MG, 2001, Science, 291, 1051, 10.1126/science.291.5506.1051 · DOI · Paper page
- Fujita A, 2009, Proc Natl Acad Sci USA, 106, 9256, 10.1073/pnas.0900216106 · DOI
- Gaidarov I, 1999, J Cell Biol, 146, 755, 10.1083/jcb.146.4.755 · DOI · Paper page
- Harris TW, 2000, J Cell Biol, 150, 589, 10.1083/jcb.150.3.589 · DOI · Paper page
- Henne WM, 2010, Science, 328, 1281, 10.1126/science.1188462 · DOI · Paper page
- Jackson LP, 2010, Cell, 141, 1220, 10.1016/j.cell.2010.05.006 · DOI · Paper page
- Jaqaman K, 2008, Nat Methods, 5, 695, 10.1038/nmeth.1237 · DOI · Paper page
- Jost M, 1998, Curr Biol, 8, 1399, 10.1016/S0960-9822(98)00022-0 · DOI · Paper page
- Kahlfeldt N, 2010, J Biol Chem, 285, 2734, 10.1074/jbc.M109.074906 · DOI
- Krauss M, 2006, Proc Natl Acad Sci USA, 103, 11934, 10.1073/pnas.0510306103 · DOI · Paper page
- Liu AP, 2010, J Cell Biol, 191, 1381, 10.1083/jcb.201008117 · DOI
- Loerke D, 2011, Traffic, 12, 815, 10.1111/j.1600-0854.2011.01197.x · DOI
- Loerke D, 2009, PLoS Biol, 7, e57, 10.1371/journal.pbio.1000057 · DOI · Paper page
- Malecz N, 2000, Curr Biol, 10, 1383, 10.1016/S0960-9822(00)00778-8 · DOI
- Mao Y, 2009, EMBO J, 28, 1831, 10.1038/emboj.2009.155 · DOI
- 10.1091/mbc.e09-03-0256 · DOI · Paper page
- Nakano-Kobayashi A, 2007, EMBO J, 26, 1105, 10.1038/sj.emboj.7601573 · DOI
- Nakatsu F, 2010, J Cell Biol, 190, 307, 10.1083/jcb.201005018 · DOI
- Padron D, 2003, J Cell Biol, 162, 693, 10.1083/jcb.200302051 · DOI
- Perera RM, 2006, Proc Natl Acad Sci USA, 103, 19332, 10.1073/pnas.0609795104 · DOI
- Praefcke GJK, 2004, EMBO J, 23, 4371, 10.1038/sj.emboj.7600445 · DOI · Paper page
- Rappoport JZ, 2006, Am J Physiol Cell Phys, 291, C1072, 10.1152/ajpcell.00160.2006 · DOI
- Rozen S, 2000, Methods Mol Biol, 132, 365
- Rusk N, 2003, Curr Biol, 13, 659, 10.1016/S0960-9822(03)00241-0 · DOI
- Saffarian S, 2008, Biophys J, 94, 2333, 10.1529/biophysj.107.117234 · DOI · Paper page
- Schmid EM, 2006, PLoS Biol, 4, e262, 10.1371/journal.pbio.0040262 · DOI · Paper page
- Schmid EM, 2007, Nature, 448, 883, 10.1038/nature06031 · DOI · Paper page
- Sigismund S, 2008, Dev Cell, 15, 209, 10.1016/j.devcel.2008.06.012 · DOI · Paper page
- Slepnev VI, 2000, Nat Rev Neurosci, 1, 161, 10.1038/35044540 · DOI · Paper page
- Sun Y, 2007, J Cell Biol, 177, 355, 10.1083/jcb.200611011 · DOI
- Thieman JR, 2009, J Biol Chem, 284, 13924, 10.1074/jbc.M901017200 · DOI
- Traub LM, 2003, J Cell Biol, 163, 203, 10.1083/jcb.200309175 · DOI
- Vallis Y, 1999, Curr Biol, 9, 257, 10.1016/S0960-9822(99)80114-6 · DOI · Paper page
- Wenk MR, 2001, Neuron, 32, 79, 10.1016/S0896-6273(01)00456-1 · DOI
- Wong R, 2005, Curr Biol, 15, 1401, 10.1016/j.cub.2005.06.060 · DOI
- Yarar D, 2008, Traffic, 9, 133, 10.1111/j.1600-0854.2007.00675.x · DOI
- Yarar D, 2007, Dev Cell, 13, 43, 10.1016/j.devcel.2007.04.014 · DOI
- Yun M, 2003, J Biol Chem, 278, 36572, 10.1074/jbc.M304384200 · DOI
- Zoncu R, 2007, Proc Natl Acad Sci USA, 104, 3793, 10.1073/pnas.0611733104 · DOI · Paper page
Cited by
Mechanisms of clathrin-mediated endocytosis
Kaksonen, M., & Roux, A. (2018) · Nature Reviews Molecular Cell Biology · doi:10.1038/nrm.2017.132 · Cited by 1,698
Phosphoinositides: Tiny Lipids With Giant Impact on Cell Regulation
Balla, T. (2013) · Physiological Reviews · doi:10.1152/physrev.00028.2012 · Cited by 1,638
Regulation of Clathrin-Mediated Endocytosis
Mettlen, M., Chen, P.-H., Srinivasan, S., Danuser, G., & Schmid, S. L. (2018) · Annual Review of Biochemistry · doi:10.1146/annurev-biochem-062917-012644 · Cited by 614
Self-citationThe First Five Seconds in the Life of a Clathrin-Coated Pit
Cocucci, E., Aguet, F., Boulant, S., & Kirchhausen, T. (2012) · Cell · doi:10.1016/j.cell.2012.05.047 · Cited by 391
Self-citationCavin family proteins and the assembly of caveolae
Kovtun, O., Tillu, V. A., Ariotti, N., Parton, R. G., & Collins, B. M. (2015) · Journal of Cell Science · doi:10.1242/jcs.167866 · Cited by 230
Phosphoinositide conversion in endocytosis and the endolysosomal system
Wallroth, A., & Haucke, V. (2018) · Journal of Biological Chemistry · doi:10.1074/jbc.r117.000629 · Cited by 195
Transient Fcho1/2⋅Eps15/R⋅AP-2 Nanoclusters Prime the AP-2 Clathrin Adaptor for Cargo Binding
Ma, L., Umasankar, P. K., Wrobel, A. G., Lymar, A., McCoy, A. J., Holkar, S. S., Jha, A., Pradhan-Sundd, T., Watkins, S. C., Owen, D. J., et al. (2016) · Developmental Cell · doi:10.1016/j.devcel.2016.05.003 · Cited by 115
Dahhan, D. A., Reynolds, G. D., Cárdenas, J. J., Eeckhout, D., Johnson, A., Yperman, K., Kaufmann, W. A., Vang, N., Yan, X., Hwang, I., et al. (2022) · The Plant Cell · doi:10.1093/plcell/koac071 · Cited by 54
Ernest James Phillips, T., & Maguire, E. (2021) · Frontiers in Cellular Neuroscience · doi:10.3389/fncel.2021.652593 · Cited by 33
Transmembrane Protein 55B Is a Novel Regulator of Cellular Cholesterol Metabolism
Medina, M. W., Bauzon, F., Naidoo, D., Theusch, E., Stevens, K., Schilde, J., Schubert, C., Mangravite, L. M., Rudel, L. L., Temel, R. E., et al. (2014) · Arteriosclerosis, Thrombosis and Vascular Biology · doi:10.1161/atvbaha.113.302806 · Cited by 24
Potential Roles of SNX17, Rab11, and Rab5 in LDLR Recycling
Zhao, X., Long, S., Zhu, M., Hao, H., Liao, Y., Zhang, C., & Liu, Z. (2025) · Arteriosclerosis, Thrombosis, and Vascular Biology · doi:10.1161/atvbaha.125.322498 · Cited by 8
Metadata
- Authors
- Antonescu, C. N., Aguet, F., Danuser, G., & Schmid, S. L.
- Affiliations
- Department of Cell Biology, The Scripps Research Institute, La Jolla, CA 92037
- Department of Cell Biology, Harvard Medical School, Boston, MA 02115
- Venue
- Molecular Biology of the Cell
- Published
- 2011-07-15
- Volume
- 22
- Issue
- 14
- Pages
- 2588-2600
- ISSN
- 1059-1524
- 1939-4586
- PMC
- PMC3135483
- Cited by
- 153
- References
- 10
- Language
- en
About these checks
Registry, retraction, Cites and statistics results are computed, not judged, with one exception: a printed reference that no index lists is read once by a model before it counts as a citation error. Claims are extracted by a model and kept only when their quote appears verbatim in the text; each cited source is then checked, with a model’s help, for whether it says what the claim relies on. Those verdicts can be wrong — read the claim’s quote and the cited source before relying on one.
Statistics and arithmetic are recomputed, not judged.
Confidence bands are shown only for fields calibrated on our annotated test set. None is calibrated yet, so no band is shown.
What counts as a claim ›How we measure confidence ›How we check this ›
Are you an author, or do you see a problem with this page? Request a review
Data sources
Bibliographic data: Semantic Scholar, OpenAlex, Crossref.
Contains information from the Semantic Scholar Academic Graph Datasets, made available under the ODC Attribution License (ODC-BY 1.0).
Semantic Scholar’s data is described in: Kinney, R., et al. (2023). The Semantic Scholar Open Data Platform. arXiv:2301.10140.
