

arrayQualityMetrics—a bioconductor package for quality assessment of microarray data
Open accessThe DOI matches its Crossref record; 12 of the 12 references it cites were found in a registry or an index.
Abstract
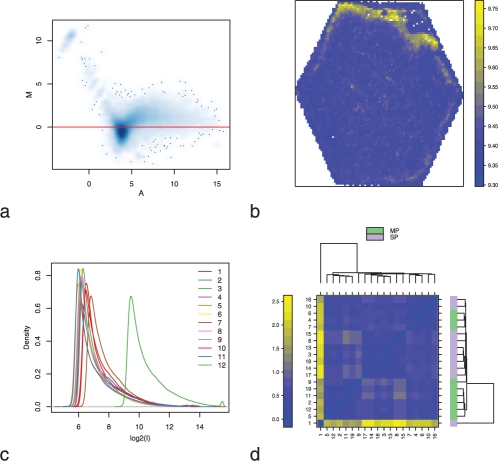
Summary:: The assessment of data quality is a major concern in microarray analysis. arrayQualityMetrics is a Bioconductor package that provides a report with diagnostic plots for one or two colour microarray data. The quality metrics assess reproducibility, identify apparent outlier arrays and compute measures of signal-to-noise ratio. The tool handles most current microarray technologies and is amenable to use in automated analysis pipelines or for automatic report generation, as well as for use by individuals. The diagnosis of quality remains, in principle, a context-dependent judgement, but our tool provides powerful, automated, objective and comprehensive instruments on which to base a decision. Availability:: arrayQualityMetrics is a free and open source package, under LGPL license, available from the Bioconductor project at www.bioconductor.org. A users guide and examples are provided with the package. Some examples of HTML reports generated by arrayQualityMetrics can be found at http://www.microarray-quality.org Contact:: audrey@ebi.ac.uk Supplementary information:: Supplementary data are available at Bioinformatics online.
Overview
The claims and statistics of this paper haven’t been checked yet.
Free: it reads the open-access text and checks the first 5 claims that cite a source we can check. Create a free account to check every claim.
Integrity signals
Registry
Cites
Statistics
Figures
Verification
Claims the paper makes
The claims and statistics of this paper haven’t been checked yet.
Free: it reads the open-access text and checks the first 5 claims that cite a source we can check. Create a free account to check every claim.
Claims other papers make about this one
Each is checked against this paper’s own text: does it say what the citing paper says it does?
In the citing paper
“Three RNA deep sequencing quality control measurements were performed to detect outliers and batch effects associated with the dataset: (a) L 1 distance between samples, (b) PCAs, and (c) similarity of density estimates of abundance values (53).”
From Development of an in vitro human liver system for interrogating nonalcoholic steatohepatitis (2016) · cites this paper as [53]
Self-check
Percentages, sums and reported differences re-computed from the paper’s own numbers.
The self-check needs the paper’s full text.
Citations
Cites
Bioconductor: open software development for computational biology and bioinformatics
Gentleman, R. C., Carey, V. J., Bates, D. M., Bolstad, B., Dettling, M., Dudoit, S., Ellis, B., Gautier, L., Ge, Y., Gentry, J., et al. (2004) · Genome Biology · doi:10.1186/gb-2004-5-10-r80 · Cited by 12,172 · cited 1×
“Availability: arrayQualityMetrics is a free and open source package, under LGPL license, available from the Bioconductor project at www.bioconductor.org.”
Self-citationaffy—analysis of Affymetrix GeneChip data at the probe level
Gautier, L., Cope, L., Bolstad, B. M., & Irizarry, R. A. (2004) · Bioinformatics · doi:10.1093/bioinformatics/btg405 · Cited by 5,218 · cited 2×
“The RNA degradation plot from the affy package (Gautier et al., 2004), the relative log expression (RLE) boxplots and the normalized unscaled standard error (NUSE) boxplots from the affyPLM package (Brettschneider et al., 2007) and the QC stat plot from the simpleaffy package (Wilson and Miller,…”
Dudoit, S., Yang, J. Y. H., Callow, M. J., & Speed, T. P. (2002) · UC Berkeley · Cited by 1,576
beadarray: R classes and methods for Illumina bead-based data
Dunning, M. J., Smith, M. L., Ritchie, M. E., & Tavaré, S. (2007) · Bioinformatics · doi:10.1093/bioinformatics/btm311 · Cited by 469
Simpleaffy: a BioConductor package for Affymetrix Quality Control and data analysis
Wilson, C. L., & Miller, C. J. (2005) · Bioinformatics · doi:10.1093/bioinformatics/bti605 · Cited by 445 · cited 2×
“In the case of one colour arrays, the M-value is computed by dividing the intensity by the median intensity of the same probe across all arrays.”
Normalization strategies for cDNA microarrays
Schuchhardt, J. (2000) · Nucleic Acids Research · doi:10.1093/nar/28.10.e47 · Cited by 331 · cited 1×
“Summary: The assessment of data quality is a major concern in microarray analysis. arrayQualityMetrics is a Bioconductor package that provides a report with diagnostic plots for one or two colour microarray data.”
Donuts, scratches and blanks: robust model-based segmentation of microarray images
Li, Q., Fraley, C., Bumgarner, R. E., Yeung, K. Y., & Raftery, A. E. (2005) · Computer applications in the biosciences · doi:10.1093/bioinformatics/bti447 · Cited by 127
arrayMagic: two-colour cDNA microarray quality control and preprocessing
Buneß, A., Huber, W. K., Steiner, K., Sültmann, H., & Poustka, A. (2004) · Bioinformatics · doi:10.1093/bioinformatics/bti052 · Cited by 55 · cited 2×
“, 2007), two-colour cDNA arrays (Buness et al., 2005).”
Self-citationMDQC: a new quality assessment method for microarrays based on quality control reports
Freue, G. V. C., Hollander, Z., Shen, E., Zamar, R. H., Balshaw, R. F., Scherer, A., McManus, B. M., Keown, P. A., McMaster, W. R., & Ng, R. T. (2007) · Bioinformatics · doi:10.1093/bioinformatics/btm487 · Cited by 42 · cited 2×
“Some tools perform outlier detection from quality metrics done before (Freue et al., 2007), or propose interactive quality plots (Lee et al.”
Array-A-Lizer: A serial DNA microarray quality analyzer
Petri, A., Fleckner, J., & Matthiessen, M. W. (2004) · BMC Bioinformatics · doi:10.1186/1471-2105-5-12 · Cited by 12
Research works printed but not linked: 2
- Brettschneider, 2007, Quality assessment for short oligonucleotide arrays
- Parman, 2005, affyQCReport: QC Report Generation for affyBatch objects.
Cited by
Items 901–951 of 951
Choi, J., Topouza, D. G., Tarnouskaya, A., Nesdoly, S., Koti, M., & Duan, Q. L. (2020) · Figshare · doi:10.6084/m9.figshare.12299864
Fonseca, A. S., Ramão, A., Bürger, M. C., de Souza, J. E. S., Zanette, D. L., de Molfetta, G. A., de Araújo, L. F., de Barros e Lima Bueno, R., Aguiar, G. M., Plaça, J. R., et al. (2021) · Figshare · doi:10.6084/m9.figshare.14140257
Fonseca, A. S., Ramão, A., Bürger, M. C., de Souza, J. E. S., Zanette, D. L., de Molfetta, G. A., de Araújo, L. F., de Barros e Lima Bueno, R., Aguiar, G. M., Plaça, J. R., et al. (2021) · Figshare · doi:10.6084/m9.figshare.14140260
Leach, W. B., & Reitzel, A. M. (2020) · Figshare · doi:10.6084/m9.figshare.12307796
Fonseca, A. S., Ramão, A., Bürger, M. C., de Souza, J. E. S., Zanette, D. L., de Molfetta, G. A., de Araújo, L. F., de Barros e Lima Bueno, R., Aguiar, G. M., Plaça, J. R., et al. (2021) · Figshare · doi:10.6084/m9.figshare.14140263
Chhatriya, B., Mukherjee, M., Ray, S., Saha, B., Lahiri, S., Halder, S., Ghosh, I., Khamrui, S., Das, K., Bhattacharjee, S., et al. (2020) · Figshare · doi:10.6084/m9.figshare.13204727
Ramiro, L., Faura, J., Simats, A., García‐Rodríguez, P., Ma, F., Martín, L., Canals, F., Rosell, A., & Montaner, J. (2024) · Figshare · doi:10.6084/m9.figshare.26564607
Choi, J., Topouza, D. G., Tarnouskaya, A., Nesdoly, S., Koti, M., & Duan, Q. L. (2020) · Figshare · doi:10.6084/m9.figshare.12299840
Tripp, J. A., Berrío, A., McGraw, L. A., Matz, M. V., Davis, J. K., Inoue, K., Thomas, J. W., Young, L. J., & Phelps, S. M. (2021) · Figshare · doi:10.6084/m9.figshare.14707895
Duran, I., Banerjee, A., Flaherty, P., Que, Y.-A., Ryan, C. M., Rahme, L. G., & Tsurumi, A. (2024) · Figshare · doi:10.6084/m9.figshare.26943894
Islam, A. B. M. M. K., Khan, M. A.-A.-K., Ahmed, R., Hossain, M. S., Kabir, S. M. T., Islam, M. S., & Siddiki, A. M. A. M. Z. (2021) · Figshare · doi:10.6084/m9.figshare.13544983
Yin, S., Li, X., Xiong, Z., Xie, M., Jin, L., Chen, H., Mao, C., Zhang, F., & Lian, L. (2022) · Figshare · doi:10.6084/m9.figshare.19606750
Choi, J., Topouza, D. G., Tarnouskaya, A., Nesdoly, S., Koti, M., & Duan, Q. L. (2020) · Figshare · doi:10.6084/m9.figshare.12299834
Integrative Analysis of Gene Co-expression Networks and Biclustering for Cancer Biomarker Discovery
Cadenas, M. R., López, A. L., Segura-Carmona, I., Ortega, J. G., & Gómez-Vela, F. (2026) · Lecture notes in computer science · doi:10.1007/978-3-032-10661-2_37
Cristella, C., Raadsen, M. P., van Willigen, H. D. G., de Haan, K., van Leeuwen, S., Toliat, M. R., Dalibor, N., Mersha, D. G. A., van den Akker, J. P. C., Endeman, H., et al. (2026) · Blood Vessels Thrombosis & Hemostasis · doi:10.1016/j.bvth.2026.100137
“32 Within-group outliers were manually assessed by principal component analysis and removed if needed.”
Chen, H., Kaneko, N., Ohyama, Y., & Moriyama, M. (2026) · Journal of Autoimmunity · doi:10.1016/j.jaut.2025.103521 · Cited by 2
Soul, J., & Young, D. A. (2026) · Osteoarthritis and Cartilage · doi:10.1016/j.joca.2026.01.002 · Cited by 1
Xuan, J., Xiao, C., Luo, R., Luo, Y., He, Q., & Liu, W.-T. (2026) · International Journal of Molecular Sciences · doi:10.3390/ijms27031169
“56.0)” [48] was used to perform quality control and outlier removal.”
InfluentialComputational Discovery of Colorectal Cancer Biomarkers through Multi-Platform Gene Expression Data
Nisar, H., Alwahaishi, S. S., & Rahman, A. U. (2025) · IEEE International Conference on Bioinformatics and Biomedicine (BIBM) · doi:10.1109/bibm66473.2025.11356523
“count matrix files were processed with quality control using arrayQualityMetrics [3]; exclusion of outlier and duplicate samples; and platform-specific normalizations, including RMA[4] for microarray data and CQN/NOISeq[5, 6] for RNA-Seq data.”
Silveira, D. A., Gupta, S., Brunetto, A. T., Mombach, J. C. M., & Sinigaglia, M. (2026) · Network Modeling Analysis in Health Informatics and Bioinformatics · doi:10.1007/s13721-026-00746-y
“The raw microarray data were normalized using the Robust Multichip Average (RMA) method (Carvalho and Irizarry 2010), and quality control was performed using the arrayQualityMetrics R package (Kauffmann et al. 2009).”
Nisar, H., Islam, A., Arshad, A., Zahra, F. T., Alwahaishi, S. S., Qazi, R., Yousaf, I., & Tariq, Q. U. A. (2026) · Biomarkers in Medicine · doi:10.1080/17520363.2026.2631632 · Cited by 1
Symbiotic state affects microbiome recovery in a facultatively symbiotic cnidarian
Valadez-Ingersoll, M., Bodnar, C. A., Feng, E. X., Wong, A., Gilmore, T. D., & Davies, S. W. (2026) · Scientific Reports · doi:10.1038/s41598-026-38684-4 · Cited by 1
“ArrayQualityMetrics (v.3.62.0) 70 tested for outliers, identifying one aposymbiotic R2 individual as an outlier, which was subsequently removed.”
InfluentialNisar, H., Sahibzada, K. I., Khan, A., Alwahaishi, S. S., & Agouni, A. (2026) · Journal of Molecular Graphics and Modelling · doi:10.1016/j.jmgm.2026.109357 · Cited by 1
Molecular and physiological characterization of grapevine rootstock adaptation to drought
Peccoux, A. (2011) · theses.fr (ABES) · doi:10.70675/ab4b4e5dzb19ez45d7z9b84zb37423122088 · Cited by 4
“Microarray quality controls were performed using the arrayQualityMetrics package (Kauffmann et al., 2009).”
MethodEffects of water stress and rootstock genotype on grape berry composition
Berdeja, M. (2013) · theses.fr (ABES) · doi:10.70675/7cf4a5aezfb61z439bz851fz73172f8b22f1
Identification de marqueurs de susceptibilité dans les formes chroniques de la maladie de Chagas
Laugier, L. (2017) · theses.fr (ABES) · doi:10.70675/2d7f9c97z09c9z4593z8a61z974cc7d5a1c0
Analysis of the dystrophin interactome
Thorley, M. (2016) · theses.fr (ABES) · doi:10.70675/f6582854zdd32z4484zae7fz22c8ecd45969 · Cited by 2
Dédifférenciation de la cellule bêta pancréatique humaine
Diedisheim, M. (2017) · theses.fr (ABES) · doi:10.70675/9c2e56d4za035z4fa3zafa6z7786e388a812
Gentili, M. (2017) · theses.fr (ABES) · doi:10.70675/93617cb4za4e9z4fdez831az0bf2b31aea90
Ronchi, J., Rigolio, R., Trevisan, D. M., Papagna, A., Stabilini, A., Gallinaro, M., Fusco, M. L., Cogo, M. G., Cavaletti, G., Malerba, G., et al. (2026) · MedComm · doi:10.1002/mco2.70647
“Then, expression data were transformed in log 2 scale and advanced quality control was performed through the arrayQualityMetrics [ 92 ] package.”
Rapid Remodeling of Human White Adipose Tissue Following Bariatric SurgeryPreprint
Loureiro, Z. Y., Westcott, G. P., Gulko, A., Essene, A. L., Zhou, Z., Liang, W., Jacobs, C. L., Nagesh, S., Bozadjieva-Kramer, N., Seeley, R. J., et al. (2026) · bioRxiv (Cold Spring Harbor Laboratory) · doi:10.64898/2026.04.09.717542 · Cited by 1
Kamal, M. J., Xhuti, D., Joanisse, S., Nederveen, J. P., Tarnopolsky, M. A., & Parise, G. (2026) · Aging · doi:10.18632/aging.206379
DeMerlis, A., Foord, C., Hesley, D., Karp, R. F., Isma, L. M., Andrade-Rodriguez, N., Wong, K. H., Studivan, M. S., Jankulak, M., Baker, A. C., et al. (2026) · Frontiers in Marine Science · doi:10.3389/fmars.2026.1796814
Kawsar, M., Shareen, D., Dip, S. A., Sarker, R. P., Paul, B. K., & Bhuiyan, T. (2025) · IEEE International Women in Engineering (WIE) Conference on Electrical and Computer Engineering (WIECON-ECE) · doi:10.1109/wiecon-ece69386.2025.11526543
“Statistical significance of hub gene centrality was assessed against random network distributions (p 0.001 for all measures).”
InfluentialSong, G., Mi, D., Jiang, Y., 耿彩平, Yuan, J., Zhao, T., Zhou, H., Zhang, X., Hu, Y., & Wu, X. (2026) · Clinical and Experimental Obstetrics & Gynecology · doi:10.31083/ceog48214
Human neutrophilic cells express anti-inflammatory EBI3 in response to Neisseria meningitidis
Dunphy, A. M., Krueger, Q. A., Johnson, M. B., & Marriott, I. (2026) · Journal of Neuroimmunology · doi:10.1016/j.jneuroim.2026.578995
“Differential expression and outlier analyses were performed using DESeq2 (Love et al., 2014) and ArrayQualityMetrics (Kauffmann et al., 2009), respectively.”
Cai, Q., Bogan, S. N., Tanner, R. L., Kelley, J. L., & Dowd, W. W. (2026) · Molecular Ecology · doi:10.1111/mec.70418 · Cited by 1
Kissner, M. S., Rosin, A., Sprenger, H., Gonnella, G., Neuhaus, K., Abbas, A., Chang, H., Tralau, T., Krause, J. L., Höper, T., et al. (2026) · Microorganisms · doi:10.3390/microorganisms14081722 · Cited by 2
“The R package arrayQualityMetrics v.3.60.0 was used to perform quality control of all microarray files [63].”
InfluentialRasool, U., Reyer, H., Oster, M., Trakooljul, N., Starke, I., Krischek, C., Ponsuksili, S., & Wimmers, K. (2026) · Scientific Reports · doi:10.1038/s41598-026-67770-w
“56.0) to check sample-to-sample distances, distributions of counts, and differences between the log2 counts of a gene in one sample and the corresponding log2 average across all samples 58 .”
InfluentialSales, M. V. B., Nakaya, H. I., Cunha, F. D. Q., & Oliveira, A. E. R. (2026) · Bioinformatics and Biology Insights · doi:10.1177/11779322261447645
“Outlier detection was conducted using arrayQualityMet-rics, 18 excluding samples flagged by at least 2 criteria.”
Immune Signatures Data Resource
Thakar, J., Diray-Arce, J., & Kleinstein, S. H. (2025) · ImmPort · doi:10.21430/dh2k-xr58
Adriaens, M. E. (2012) · Research Publications (Maastricht University) · doi:10.26481/dis.20120621mm
Recurso Web para el aprendizaje de aplicaciones bioinformáticas: Análisis de microarrays
Cuadros, M., Cano, C., & Morón, A. B. (2010) · Dialnet (Universidad de la Rioja)
Molecular investigations of age-related macular degeneration
Whitmore, S. S., Anderson, M. G., Sohn, E. H., Scheetz, T. E., Tan, K., & Mullins, R. F. (2015) · doi:10.17077/etd.7xzjf8nh
“Following normalization in AltAnalyze (Figure 4), samples CTRL3 and CTRL9 were flagged as potential outliers by arrayQualityMetrics analysis [179] based on their sum of distances to other arrays (Figure 5A,C).”
Method
Metadata
- Authors
- Kauffmann, A., Gentleman, R., & Huber, W.
- Affiliations
- European Bioinformatics Institute (GB)
- Corresponding author
- Kauffmann, Audrey
- Venue
- Bioinformatics
- Publisher
- Oxford University Press (OUP)
- Published
- 2008-12-23
- Volume
- 25
- Issue
- 3
- Pages
- 415-416
- ISSN
- 1367-4803 (ISSN-L)
- 1367-4811
- PMC
- PMC2639074
- OpenAlex
- W2159096710
- Cited by
- 946
- References
- 11
- Citations by year
- 2026: 25 · 2025: 43 · 2024: 37 · 2023: 53 · 2022: 50 · 2021: 80 · 2020: 82 · 2019: 72 · 2018: 69 · 2017: 74 · 2016: 75 · 2015: 63 · 2014: 69 · 2013: 50 · 2012: 47
- FWCI
- 7.81
- Type
- journal article
- Language
- en
- Open access
- hybrid
- doi.org
- Licence
- Locations
- Bioinformatics (publishedVersion, cc-by-nc)
- PubMed Central (publishedVersion, cc-by-nc)
- PubMed (publishedVersion)
- Funders
- National Computational Infrastructure
- Australian Government
- Cancer Australia
- South Australian Research and Development Institute
- National Human Genome Research Institute (P41HG004059)
- Topics
- Life Sciences › Biochemistry, Genetics and Molecular Biology › Molecular Biology › Gene expression and cancer classification
- Life Sciences › Biochemistry, Genetics and Molecular Biology › Molecular Biology › Genomics and Phylogenetic Studies
- Life Sciences › Biochemistry, Genetics and Molecular Biology › Molecular Biology › Bioinformatics and Genomic Networks
- Keywords
- Bioconductor package, two-color microarrays, signal-to-noise ratio, reproducibility, automated reporting, diagnostic plots
- MeSH terms
- Algorithms, Data Interpretation, Statistical, Quality Control, Software, Computational Biology, Internet, Oligonucleotide Array Sequence Analysis
About these checks
Registry, retraction, Cites and statistics results are computed, not judged, with one exception: a printed reference that no index lists is read once by a model before it counts as a citation error. Claims are extracted by a model and kept only when their quote appears verbatim in the text; each cited source is then checked, with a model’s help, for whether it says what the claim relies on. Those verdicts can be wrong — read the claim’s quote and the cited source before relying on one.
Statistics and arithmetic are recomputed, not judged.
Confidence bands are shown only for fields calibrated on our annotated test set. None is calibrated yet, so no band is shown.
What counts as a claim ›How we measure confidence ›How we check this ›
Are you an author, or do you see a problem with this page? Request a review
Data sources
Bibliographic data: Semantic Scholar, OpenAlex, Crossref.
Contains information from the Semantic Scholar Academic Graph Datasets, made available under the ODC Attribution License (ODC-BY 1.0).
Semantic Scholar’s data is described in: Kinney, R., et al. (2023). The Semantic Scholar Open Data Platform. arXiv:2301.10140.
