

arrayQualityMetrics—a bioconductor package for quality assessment of microarray data
Open accessThe DOI matches its Crossref record; 12 of the 12 references it cites were found in a registry or an index.
Abstract
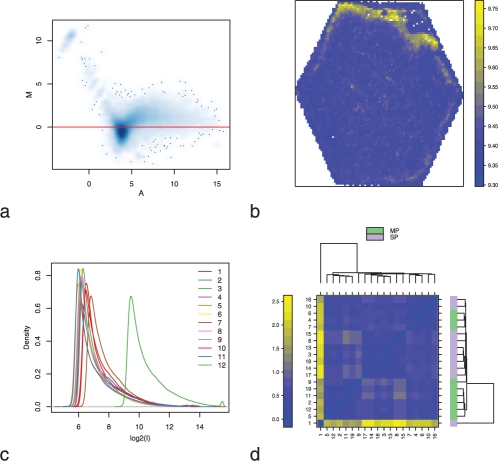
Summary:: The assessment of data quality is a major concern in microarray analysis. arrayQualityMetrics is a Bioconductor package that provides a report with diagnostic plots for one or two colour microarray data. The quality metrics assess reproducibility, identify apparent outlier arrays and compute measures of signal-to-noise ratio. The tool handles most current microarray technologies and is amenable to use in automated analysis pipelines or for automatic report generation, as well as for use by individuals. The diagnosis of quality remains, in principle, a context-dependent judgement, but our tool provides powerful, automated, objective and comprehensive instruments on which to base a decision. Availability:: arrayQualityMetrics is a free and open source package, under LGPL license, available from the Bioconductor project at www.bioconductor.org. A users guide and examples are provided with the package. Some examples of HTML reports generated by arrayQualityMetrics can be found at http://www.microarray-quality.org Contact:: audrey@ebi.ac.uk Supplementary information:: Supplementary data are available at Bioinformatics online.
Overview
The claims and statistics of this paper haven’t been checked yet.
Free: it reads the open-access text and checks the first 5 claims that cite a source we can check. Create a free account to check every claim.
Integrity signals
Registry
Cites
Statistics
Figures
Verification
Claims the paper makes
The claims and statistics of this paper haven’t been checked yet.
Free: it reads the open-access text and checks the first 5 claims that cite a source we can check. Create a free account to check every claim.
Claims other papers make about this one
Each is checked against this paper’s own text: does it say what the citing paper says it does?
In the citing paper
“Three RNA deep sequencing quality control measurements were performed to detect outliers and batch effects associated with the dataset: (a) L 1 distance between samples, (b) PCAs, and (c) similarity of density estimates of abundance values (53).”
From Development of an in vitro human liver system for interrogating nonalcoholic steatohepatitis (2016) · cites this paper as [53]
Self-check
Percentages, sums and reported differences re-computed from the paper’s own numbers.
The self-check needs the paper’s full text.
Citations
Cites
Bioconductor: open software development for computational biology and bioinformatics
Gentleman, R. C., Carey, V. J., Bates, D. M., Bolstad, B., Dettling, M., Dudoit, S., Ellis, B., Gautier, L., Ge, Y., Gentry, J., et al. (2004) · Genome Biology · doi:10.1186/gb-2004-5-10-r80 · Cited by 12,172 · cited 1×
“Availability: arrayQualityMetrics is a free and open source package, under LGPL license, available from the Bioconductor project at www.bioconductor.org.”
Self-citationaffy—analysis of Affymetrix GeneChip data at the probe level
Gautier, L., Cope, L., Bolstad, B. M., & Irizarry, R. A. (2004) · Bioinformatics · doi:10.1093/bioinformatics/btg405 · Cited by 5,218 · cited 2×
“The RNA degradation plot from the affy package (Gautier et al., 2004), the relative log expression (RLE) boxplots and the normalized unscaled standard error (NUSE) boxplots from the affyPLM package (Brettschneider et al., 2007) and the QC stat plot from the simpleaffy package (Wilson and Miller,…”
Dudoit, S., Yang, J. Y. H., Callow, M. J., & Speed, T. P. (2002) · UC Berkeley · Cited by 1,576
beadarray: R classes and methods for Illumina bead-based data
Dunning, M. J., Smith, M. L., Ritchie, M. E., & Tavaré, S. (2007) · Bioinformatics · doi:10.1093/bioinformatics/btm311 · Cited by 469
Simpleaffy: a BioConductor package for Affymetrix Quality Control and data analysis
Wilson, C. L., & Miller, C. J. (2005) · Bioinformatics · doi:10.1093/bioinformatics/bti605 · Cited by 445 · cited 2×
“In the case of one colour arrays, the M-value is computed by dividing the intensity by the median intensity of the same probe across all arrays.”
Normalization strategies for cDNA microarrays
Schuchhardt, J. (2000) · Nucleic Acids Research · doi:10.1093/nar/28.10.e47 · Cited by 331 · cited 1×
“Summary: The assessment of data quality is a major concern in microarray analysis. arrayQualityMetrics is a Bioconductor package that provides a report with diagnostic plots for one or two colour microarray data.”
Donuts, scratches and blanks: robust model-based segmentation of microarray images
Li, Q., Fraley, C., Bumgarner, R. E., Yeung, K. Y., & Raftery, A. E. (2005) · Computer applications in the biosciences · doi:10.1093/bioinformatics/bti447 · Cited by 127
arrayMagic: two-colour cDNA microarray quality control and preprocessing
Buneß, A., Huber, W. K., Steiner, K., Sültmann, H., & Poustka, A. (2004) · Bioinformatics · doi:10.1093/bioinformatics/bti052 · Cited by 55 · cited 2×
“, 2007), two-colour cDNA arrays (Buness et al., 2005).”
Self-citationMDQC: a new quality assessment method for microarrays based on quality control reports
Freue, G. V. C., Hollander, Z., Shen, E., Zamar, R. H., Balshaw, R. F., Scherer, A., McManus, B. M., Keown, P. A., McMaster, W. R., & Ng, R. T. (2007) · Bioinformatics · doi:10.1093/bioinformatics/btm487 · Cited by 42 · cited 2×
“Some tools perform outlier detection from quality metrics done before (Freue et al., 2007), or propose interactive quality plots (Lee et al.”
Array-A-Lizer: A serial DNA microarray quality analyzer
Petri, A., Fleckner, J., & Matthiessen, M. W. (2004) · BMC Bioinformatics · doi:10.1186/1471-2105-5-12 · Cited by 12
Research works printed but not linked: 2
- Brettschneider, 2007, Quality assessment for short oligonucleotide arrays
- Parman, 2005, affyQCReport: QC Report Generation for affyBatch objects.
Cited by
Items 601–700 of 951
Meta-Analysis of Gene Expression Profiles in Acute Promyelocytic Leukemia Reveals Involved Pathways.
Jalili, M., Salehzadeh‐Yazdi, A., Mohammadi, S., Yaghmaie, M., Ghavamzadeh, A., & Alimoghaddam, K. (2017) · PubMed Central · Cited by 7
Balogh, A., Reiniger, L., Hetey, S., Király, P., Toth, E., Karászi, K., Juhász, K., Gelencsér, Z., Zvara, Á., Szilágyi, A., et al. (2020) · International Journal of Molecular Sciences · doi:10.3390/ijms21165762 · Cited by 7
“Following quality control performed by arrayQualityMetrics [60], expression data were background corrected with the normexp method and quantile normalized.”
MethodPfeffer, B. A., Xu, L., & Fliesler, S. J. (2021) · International Journal of Molecular Sciences · doi:10.3390/ijms22052339 · Cited by 9
Ramiro, L., Faura, J., Simats, A., García‐Rodríguez, P., Ma, F., Martín, L., Canals, F., Rosell, A., & Montaner, J. (2023) · BMC Neuroscience · doi:10.1186/s12868-023-00775-7 · Cited by 8
McGonigle, T. A., Dwyer, A. R., Greenland, E. L., Scott, N. M., Carter, K. W., Keane, K. N., Newsholme, P., Goodridge, H. S., Pixley, F. J., & Hart, P. H. (2017) · The Journal of Immunology · doi:10.4049/jimmunol.1700760 · Cited by 8
“Quality control of the arrays was performed using the arrayQualityMetrics package (29).”
MethodCattle infection response network and its functional modules
Beiki, H., Pakdel, A., Javaremi, A. N., Masoudi‐Nejad, A., & Reecy, J. M. (2018) · BMC Immunology · doi:10.1186/s12865-017-0238-4 · Cited by 7
“Quality tests were performed on the normalized array data using the Bioconductor arrayQualityMetrics package [50].”
MethodStatistical Analysis of Microarray Data
Gonzalo, R., & Sánchez‐Pla, Á. (2019) · Methods in molecular biology · doi:10.1007/978-1-4939-9442-7_5 · Cited by 10
Ben‐Elazar, S., Aure, M. R. R., Jónsdóttir, K., Leivonen, S., Kristensen, V. N., Janssen, E. A. M., Sahlberg, K. K., Lingjærde, O. C., & Yakhini, Z. (2021) · PLoS Computational Biology · doi:10.1371/journal.pcbi.1008608 · Cited by 8
“Next, we apply arrayQualityMetrics [63] (resulting Quality Control reports are available compressed in S2 and S3 Data) and filter out samples that are marked as outliers by all three outlier detection criteria (L1-Distance between arrays, Boxplot, MA plot).”
MethodTindall, C. A., Erkner, E., Stichel, J., Beck‐Sickinger, A. G., Hoffmann, A., Weiner, J., & Heiker, J. T. (2021) · Adipocyte · doi:10.1080/21623945.2021.1910154 · Cited by 7
Zhang, M., Dai, R., Zhao, Q., Zhou, L., An, Y., Tang, X., & Zhao, X. (2021) · Frontiers in Molecular Biosciences · doi:10.3389/fmolb.2021.681526 · Cited by 8
Feng, J., & He, H. (2021) · Obstetrics & Gynecology Science · doi:10.5468/ogs.21237 · Cited by 7
“0; COMPANY, CITY, STATE, COUNTRY) package [8].”
Liu, A., Han, N., Munoz-Muriedas, J., & Bender, A. (2022) · PLoS Computational Biology · doi:10.1371/journal.pcbi.1010148 · Cited by 8
“Quality control was then 533 performed using the ArrayQualityMetrics package [63] and detected outliers with high distance to 534 other experiments or unusual signal distribution were removed (List of removed outliers summarised 535 in S1 File).”
MethodMuñoz‐Marín, M. D. C., Duhamel, S., Björkman, K. M., Magasin, J. D., Díez, J., Karl, D. M., & Garcı́a-Fernández, J. M. (2022) · Microbiology Spectrum · doi:10.1128/spectrum.02466-22 · Cited by 7
Detection and correction of probe-level artefacts on microarrays
Petri, T., Berchtold, E., Zimmer, R., & Friedel, C. C. (2012) · BMC Bioinformatics · doi:10.1186/1471-2105-13-114 · Cited by 7
“Although many methods and software tools have been developed for quality assessment of microarrays [12-15], detection of spatial artefacts is not yet routinely applied.”
Expression of Signaling Components in Embryonic Eyelid Epithelium
Meng, Q., Jin, C., Chen, Y., Chen, J., Medvedovic, M., & Xia, Y. (2014) · PLoS ONE · doi:10.1371/journal.pone.0087038 · Cited by 7
“Array quality was assessed using the Array Quality Metrics package of Bioconductor [44].”
MethodWang, Y., Zhou, X., Jiang, Y., Jiang, L., Gao, L., Liu, X., Wang, X., Sun, C., & Wu, Y. (2025) · Renal Failure · doi:10.1080/0886022x.2025.2525467 · Cited by 9
Quantitative transcriptomic and epigenomic data analysis: a primer
Coussement, L., Criekinge, W. V., & Meyer, T. D. (2024) · Bioinformatics Advances · doi:10.1093/bioadv/vbae019 · Cited by 6
“For microarray data, there are more commonly used approaches, however some interesting all-in-one packages exist that combine most relevant QC plots, e.g. arrayQualiltyMetrics (Kauffmann et al. 2009) (also including QC plots from QC2, see below).”
Duran, I., Banerjee, A., Flaherty, P., Que, Y., Ryan, C. M., Rahme, L. G., & Tsurumi, A. (2024) · Annals of Intensive Care · doi:10.1186/s13613-024-01364-5 · Cited by 6
Liu, D., Cao, F., Liu, D., Li, H. R., Tao, L., & Zhu, Y. (2024) · Bone and Joint Research · doi:10.1302/2046-3758.1310.bjr-2023-0366.r1 · Cited by 7
“15,16 Data quality was assessed using the arrayQuali-tyMetrics package, 17 and normalization was performed using gcrma and lumiExpresso functions.”
MethodChan, R. J., Walker, A. K., Vardy, J. L., Chan, A., Oppegaard, K. R., Conley, Y. P., Paul, S. M., Kober, K. M., Harris, C., Shin, J., et al. (2025) · Supportive Care in Cancer · doi:10.1007/s00520-025-09317-9 · Cited by 17
Combining Hadoop and GPU to preprocess large Affymetrix microarray data
Niu, S., Yang, G., Sarma, N., Xuan, P., Smith, M. C., Srimani, P. K., & Luo, F. (2014) · IEEE International Conference on Big Data (BigData) · doi:10.1109/bigdata.2014.7004293 · Cited by 6
Molecular mechanisms of resistance to bovine mastitis
Sharifi, S., Pakdel, A., Jahanbakhsh, J., Aryan, Y., Mahdavi, A. H., & Ebrahimie, E. (2020) · Livestock Science · doi:10.1016/j.livsci.2020.104068 · Cited by 8
Cerboni, S., Marques-Ladeira, S., & Manel, N. (2021) · Journal of Molecular Biology · doi:10.1016/j.jmb.2021.167389 · Cited by 6
Topouza, D. G., Choi, J., Nesdoly, S., Tarnouskaya, A., Nicol, C. J. B., & Duan, Q. (2022) · International Journal of Molecular Sciences · doi:10.3390/ijms23094875 · Cited by 5
“Outliers were identified using the arrayQualityMetrics R package [97], leaving 224 patients from the AOCS cohort and 107 patients from the MITO cohort for further analysis.”
MethodIskandar, A. R. (2016) · ALTEX · doi:10.14573/altex.1605041s · Cited by 7
Shi, D., Mu, S., Pu, F., Zhong, B., Hu, B., Muhtar, M., Tong, W., Shao, Z., Zhang, Z., & Liu, J. (2022) · Cellular and Molecular Life Sciences · doi:10.1007/s00018-022-04462-4 · Cited by 8
“The arrayQualityMetrics [29] R package (version 3.”
Nemati, M., Zare, N., Hedayat‐Evrigh, N., & Zakaria, R. A. (2022) · Molecular Biotechnology · doi:10.1007/s12033-022-00541-w · Cited by 7
Locatelli, G., Ferreira, F. M., Katsoulas, A., Kalaitzaki, V., Krueger, M., Ingold‐Heppner, B., Walthert, S., Sankowski, R., da Costa, O. P., Dolga, A. M., et al. (2022) · Glia · doi:10.1002/glia.24299 · Cited by 6
Vychytilova‐Faltejskova, P., Vilmanova, S., Pifková, L., Ivković, T. C., Mᶏdrzyk, M., Jugas, R., Macháčková, T., Kotouček, J., Šachlová, M., Bohovicová, L., et al. (2023) · Clinical Chemistry and Laboratory Medicine (CCLM) · doi:10.1515/cclm-2023-0610 · Cited by 7
Circadian-disruption-induced gene expression changes in rodent mammary tissues
Kochan, D. Z., Ilnytskyy, Y., Golubov, A., Deibel, S. H., McDonald, R. J., & Kovalchuk, O. (2016) · Oncoscience · doi:10.18632/oncoscience.292 · Cited by 8
“Normalized and variance stabilized data was loaded into arrayQualityMetrics package for further exploratory analysis and outlier detection [45].”
MethodMcGuire, A. L., Mulroney, K. T., Carson, C. F., Ram, R., Morahan, G., & Chakera, A. (2017) · PLoS ONE · doi:10.1371/journal.pone.0178151 · Cited by 6
Effect of abiotic and biotic stress factors analysis using machine learning methods in zebrafish
Gutha, R. R., Yarrappagaari, S., Thopireddy, L., Reddy, K. S., & Saddala, R. R. (2017) · Comparative Biochemistry and Physiology Part D Genomics and Proteomics · doi:10.1016/j.cbd.2017.10.005 · Cited by 10
Cáceres, M., Quesada, R., Iglesias, M., Real, F. X., Villamonte, M., de Villarreal, J. M., Pérez, M., Andaluz, A., Moll, X., BERJANO, E. J., et al. (2020) · Scientific Reports · doi:10.1038/s41598-020-74947-4 · Cited by 6
Liu, X., Shang, H., Li, B., Zhao, L., Hua, Y., Wu, K., Hu, M., & Fan, T. (2021) · BMC Cardiovascular Disorders · doi:10.1186/s12872-021-02108-0 · Cited by 6
Hofmann, H. H., Heusler, K., Roth, K., Pröll-Cornelissen, M. J., Große‐Brinkhaus, C., Schellander, K., & Neuhoff, C. (2021) · Journal of Animal Physiology and Animal Nutrition · doi:10.1111/jpn.13639 · Cited by 9
Combined Identification of Novel Markers for Diagnosis and Prognostic of Classic Hodgkin Lymphoma
Kuang, Z., Tu, J., & Li, X. (2021) · International Journal of General Medicine · doi:10.2147/ijgm.s341557 · Cited by 6
Tanaka, P. P., de Oliveira, E. H. D., Vieira-Machado, M. C., Duarte, M. J., Assis, A. F., Bombonato‐Prado, K. F., & Passos, G. A. S. (2022) · BMC Genomics · doi:10.1186/s12864-022-08631-4 · Cited by 8
The Immune Signatures Data Resource: A compendium of systems vaccinology datasetsPreprint
Diray‐Arce, J., Miller, H. E. R., Henrich, E., Gerritsen, B., Mulè, M. P., Fourati, S., Gygi, J. P., Hagan, T., Tomalin, L. E., Rychkov, D., et al. (2021) · bioRxiv (Cold Spring Harbor Laboratory) · doi:10.1101/2021.11.05.465336 · Cited by 6
The transcriptomic fingerprint of cancer response to Tumor Treating Fields (TTFields)
Wainer-Katsir, K., Haber, A., Fishman, H., Ding, L., Story, M. D., Du, R., Kahlert, U. D., Mannarino, L., Mirimao, F., Lupi, M., et al. (2025) · Cell Death Discovery · doi:10.1038/s41420-025-02615-5 · Cited by 10
“In all datasets, outliers were screened using arrayQualityMetrics [58], and samples that failed 2/3 tests were excluded as outliers.”
Biswas, D., Halder, A., Barpanda, A., Ghosh, S., Chauhan, A., Bhat, L., Epari, S., Shetty, P. M., Moiyadi, A. V., Ball, G., et al. (2023) · Cells · doi:10.3390/cells12202483 · Cited by 5
“The Bioconductor package ar-rayQualityMetrics was used to assess the technical quality of arrays, which was determined based on background values and various scaling factors [32].”
MethodSethi, A., Sharaff, M. M., & Sahu, R. (2021) · Plant Gene · doi:10.1016/j.plgene.2021.100307 · Cited by 5
Zhan, H., Cheng, L., Li, H., Liu, Y., Huang, Y., Li, X., Yan, S., & Li, Y. (2023) · Immunologic Research · doi:10.1007/s12026-023-09398-w · Cited by 5
“The R package ‘ArrayQualityMetrics’ was used for the quality con-trol process [15], and ‘oligo’ was applied again for filtering probes with P 0.05 in at least three samples using the paCalls function ( P refers to the probability that the expression amounts of probes is the same as that of…”
MethodInfluentialEvaluating Ovarian Cancer Chemotherapy Response Using Gene Expression Data and Machine Learning
Amniouel, S., Yalamanchili, K., Sankararaman, S., & Jafri, M. S. (2024) · BioMedInformatics · doi:10.3390/biomedinformatics4020077 · Cited by 7
“The ArrayQualityMetrics R package (version 4.1.0) [30 ] was used for assurance and quality control of the microarray experiments.”
MethodInfluentialShahmanesh, M., Phillips, K. L., Boothby, M., & Tomlinson, J. (2015) · PLoS ONE · doi:10.1371/journal.pone.0117164 · Cited by 5
Transcriptome of Saccharomyces cerevisiae during production of D-xylonate
Mojžita, D., Oja, M., Rintala, E., Wiebe, M. G., Penttilä, M. E., & Ruohonen, L. (2014) · BMC Genomics · doi:10.1186/1471-2164-15-763 · Cited by 6
ALCAM is indirectly modulated by miR-125b in MCF7 cells
Akman, H. B., Selçuklu, S. D., Donoghue, M. T. A., Akhavantabasi, S., Sapmaz, A., Spillane, C., Yakicier, M. C., & Erson-Bensan, A. E. (2014) · Tumor Biology · doi:10.1007/s13277-014-2987-5 · Cited by 5
“Quality assessment of the Human Genome Focus (HGF) Array was performed using arrayQualityMetrics package in Bioconductor [18, 19].”
MethodChokeshaiusaha, K., Puthier, D., Nguyen, C., & Sananmuang, T. (2015) · The Thai Journal of Veterinary Medicine · doi:10.56808/2985-1130.2681 · Cited by 5
Hendrickx, D. M., & Glaab, E. (2020) · BMC Medical Genomics · doi:10.1186/s12920-020-00761-6 · Cited by 7
Studivan, M. S., Shatters, A., Dodge, D. L., Beal, J. L., & Voss, J. D. (2021) · Frontiers in Marine Science · doi:10.3389/fmars.2021.662220 · Cited by 5
Leal, K., Saavedra, K., Rebolledo, C., & Salazar, L. A. (2021) · Frontiers in Cardiovascular Medicine · doi:10.3389/fcvm.2021.704175 · Cited by 6
Nunes, I. J. G., Recamonde‐Mendoza, M., & Feltes, B. C. (2021) · Genetics and Molecular Biology · doi:10.1590/1678-4685-gmb-2021-0077 · Cited by 6
“…expression analysis and statistical treatment of arrays, including those provided by Agilent and Illumina, and for linear model fitting; (v) arrayQualityMetrics (Kauffmann et al. , 2008) for array quality control; and (vi) topGO for gene ontology (GO) analyses (Alexa and Rahnenfuhrer 2010).”
Ahmed, I., Ziab, M., Da'as, S. I., Hasan, W., Jeya, S. P., ALIYEV, E. E., Nisar, S., Bhat, A. A., Fakhro, K. A., & Akil, A. A. (2023) · Computational and Structural Biotechnology Journal · doi:10.1016/j.csbj.2022.12.054 · Cited by 5
The hwriter package: Composing HTML documents with R objects
Pau, G., & Huber, W. K. (2009) · The R Journal · doi:10.32614/rj-2009-009 · Cited by 5
“Combination of HTML documents and hyperlinking is useful to report analysis results; for example, in the package arrayQualityMetrics (Kauffmann et al., 2009), estimating the quality of microarray data sets and cellHTS2 (Boutros et al., 2006), performing the analysis of cell-based screens.”
MethodSelf-citationNadaraja, S., Schledermann, D., Herrstedt, J., Østrup, O., & Ditzel, H. J. (2019) · Acta Oncologica · doi:10.1080/0284186x.2019.1657941 · Cited by 5
Valadez-Ingersoll, M., Carrión, P. J. A., Bodnar, C. A., Desai, N. A., Gilmore, T. D., & Davies, S. W. (2023) · bioRxiv (Cold Spring Harbor Laboratory) · doi:10.1101/2023.07.30.551141 · Cited by 5
McHugo, G. P., Ward, J. A., Browne, J. A., O’Gorman, G. M., Meade, K. G., Hill, E. W., Hall, T. J., & MacHugh, D. E. (2025) · doi:10.1101/2025.01.31.635858 · Cited by 4
“Quality control with log transformation was performed using affy (v. 1.80.0) [57], Biobase (v. 2.62.0) [58], and arrayQuality-Metrics (v. 3.58.0) [59] with R (v. 4.3.2) [60].”
InfluentialAbbey, D., Singh, G., Verma, I., Derebail, S. S., Kolkundkar, U., Chandrashekar, D. S., Acharya, K. K., Vemuri, M. C., & Seshagiri, P. B. (2019) · Cellular Reprogramming · doi:10.1089/cell.2019.0019 · Cited by 4
“0.7 software (Emig et al., 2010), raw data were processed with standard RMA and DABG filtering options and quality-controlled by using array Quality Metrics (Kauffmann et al., 2009).”
InfluentialMasjedi, M. N.-K., Asgari, Y., & Sadroddiny, E. (2023) · Informatics in Medicine Unlocked · doi:10.1016/j.imu.2023.101172 · Cited by 4
Prognostic value of GLCE and infiltrating immune cells in Ewing sarcoma
Wen, J., Yi, L., Wan, L., & Dong, X. (2023) · Heliyon · doi:10.1016/j.heliyon.2023.e19357 · Cited by 4
“After removing the batch effect, samples with abnormal gene expression profiles in both boxplots and density plots were identified as outliers and excluded [17].”
MethodKoutsandreas, T., Pilalis, E. D., Vlachavas, E., Koczan, D., Klippel, S., Dimitrakopoulou‐Strauss, A., Valavanis, I. K., & Chatziioannou, A. A. (2015) · IEEE International Conference on Bioinformatics and Bioengineering (BIBE) · doi:10.1109/bibe.2015.7367724 · Cited by 4
Array-based approaches to bacterial transcriptome analysis
Mäder, U., & Nicolas, P. (2012) · Methods in microbiology · doi:10.1016/b978-0-08-099387-4.00006-5 · Cited by 6
A comparative analysis of human bone marrow–resident and peripheral memory B cells
Becker, S. C., Szyska, M., Mensen, A., Hellwig, K., Otto, R., Olfe, L. I., Volk, H., Dörner, T., Dörken, B., Scheibenbogen, C., et al. (2018) · Journal of Allergy and Clinical Immunology · doi:10.1016/j.jaci.2017.12.983 · Cited by 6
Poloni, J. D. F., Rispoli, T., Rossetti, M. L. R., Trindade, C., & Vargas, J. E. (2021) · BioMed Research International · doi:10.1155/2021/5262000 · Cited by 4
“The raw data sets were downloaded using ArrayExpress package and analyzed using the R package arrayQualityMetrics [14, 15].”
Yin, S., Li, X., Xiong, Z., Xie, M., Jin, L., Chen, H., Mao, C., Zhang, F., & Lian, L. (2022) · BMC Gastroenterology · doi:10.1186/s12876-022-02252-7 · Cited by 4
“Chip quality was assessed using the ‘arrayQualityMetrics’ package in R [20].”
MethodOpen ocean and coastal strains of the N2-fixing cyanobacterium UCYN-A have distinct transcriptomes
Muñoz‐Marín, M. D. C., Magasin, J. D., & Zehr, J. P. (2023) · PLoS ONE · doi:10.1371/journal.pone.0272674 · Cited by 4
Jiang, Y., Du, Y., Su, R., Wei, L., Gao, P., Zhang, J., Zhou, X., Zhu, S., Zhang, H., Chen, Y., et al. (2023) · Experimental Biology and Medicine · doi:10.1177/15353702231199077 · Cited by 4
Lai, B.-W., Jiang, H., Liao, T., Gao, Y., & Zhou, X. (2023) · Immunity Inflammation and Disease · doi:10.1002/iid3.1123 · Cited by 4
“” 15 After normalization, We prefilter and remove the low count genes and use “ limma ” R package to identify the DEGs with the criteria of |log2 Fold change| > 1 and adjusted p value (Benjamini – Hochberg method) .05.”
MethodBuilding flexible and robust analysis frameworks for molecular subtyping of cancers
Pedersen, C. B., Campos, B., Rene, L., Wegener, H. S., Krishnan, N. M., Panda, B., Vitting‐Seerup, K., Rossing, M., Bagger, F. O., & Olsen, L. R. (2023) · Molecular Oncology · doi:10.1002/1878-0261.13580 · Cited by 5
“54.0 to assess data quality for microarray data [21] and FASTQC v0.”
BackgroundMethodInfluentialGai, Z. (2014) · Genomics Data · doi:10.1016/j.gdata.2014.02.002 · Cited by 4
“The processed intensities and normalized across samples were loaded by using quantile normalization implemented in the Bioconductor package preprocessCore [3].”
MethodMiraji, M. K., Cheng, Y., Ge, S., & Xu, G. (2019) · PeerJ · doi:10.7717/peerj.7067 · Cited by 5
Network Analysis Reveals Proteins Associated with Aortic Dilatation in Mucopolysaccharidoses
Corrêa, T., Feltes, B. C., Gonzalez, E. A., Baldo, G., & Matte, Ú. D. S. (2021) · Interdisciplinary Sciences Computational Life Sciences · doi:10.1007/s12539-020-00406-3 · Cited by 4
Bioinformatics Analysis of Small RNA Transcriptomes: The Detailed Workflow
Ilnytskyy, S., & Bilichak, A. (2016) · Methods in molecular biology · doi:10.1007/978-1-4899-7708-3_16 · Cited by 4
Figueiredo, A. S., Killian, D., Schulte, J., Sticht, C., & Lindner, H. A. (2017) · Data in Brief · doi:10.1016/j.dib.2017.07.018 · Cited by 4
Bioinformatics-inspired analysis for watermarked images with multiple print and scan
Garhwal, A. S. (2018) · Tuwhera (Auckland University of Technology) · Cited by 4
Mordaunt, C. E., Park, B. Y., Bakulski, K. M., Feinberg, J. I., Croen, L., Ladd‐Acosta, C., Newschaffer, C. J., Volk, H. E., Ozonoff, S. J., Hertz‐Picciotto, I., et al. (2018) · bioRxiv (Cold Spring Harbor Laboratory) · doi:10.1101/486498 · Cited by 4
Taccardi, D., Zacharias, A. M., Gowdy, H. G. M., Knezic, M., Parisien, M., Bisson, E. J., Fang, Z. Y., Stickley, S. A., Brown, E., Camiré, D., et al. (2025) · Journal of Clinical Investigation · doi:10.1172/jci188620 · Cited by 6
Parkinson, E., Watkins, W. J., Edkins, S., McLaren, J. E., Clements, M., Andrews, R., Liberatore, F., Lutsar, I., Turner, M. A., Roilides, E., et al. (2025) · Science Translational Medicine · doi:10.1126/scitranslmed.adt1938 · Cited by 5
Tang, X., & Chen, Y. (2024) · Hematology · doi:10.1080/16078454.2024.2377850 · Cited by 3
“2.3) [7].”
InfluentialSeth, S., Chaudhary, K., & Ramachandran, S. (2025) · Biomedical Signal Processing and Control · doi:10.1016/j.bspc.2025.108240 · Cited by 5
Development and application of meta-analysis in environmental health research
Li, Q., Liang, X., Yang, R., Yin, N., & Faiola, F. (2025) · Critical Reviews in Toxicology · doi:10.1080/10408444.2025.2530972 · Cited by 4
“…minimum information requirements for reproducible microarray/high-throughput sequencing experiments; QC tools like arrayQualityMetrics or RSeQC (Kauffmann et al. 2009; Wang et al. 2012) assessing technical data quality; and reporting guidelines like ARRIVE (Kilkenny et al. 2010), which…”
Saarimäki, L. A., Danielsen, P. H., Knudsen, K. B., Poulsen, S. S., Halappanavar, S. S., Wolff, H. J., Kinaret, P., Greco, D., & Vogel, U. B. (2025) · Nanomaterials · doi:10.3390/nano15171364 · Cited by 4
“Quality control was performed using the arrayQualityMetrics package (version 3.52.0) [41 ].”
InfluentialBehrmann, L., Otto, B., & Horstmann, M. A. (2014) · Genomics Data · doi:10.1016/j.gdata.2014.05.009 · Cited by 3
Sources of Errors in Molecular Testing
Chandler, L. J. (2013) · Elsevier eBooks · doi:10.1016/b978-0-12-415783-5.00021-9 · Cited by 3
Cokan, K. B., Hancock, J. M., Spindelboeck, W., Režen, T., Juvan, P., & Rozman, D. (2021) · Biochimica et Biophysica Acta (BBA) - Gene Regulatory Mechanisms · doi:10.1016/j.bbagrm.2021.194785 · Cited by 4
Novel brown adipose tissue candidate genes predicted by the human gene connectome
Salazar‐Tortosa, D. F., Enard, D., Itan, Y., & Ruiz, J. R. (2022) · Scientific Reports · doi:10.1038/s41598-022-11317-2 · Cited by 3
Soloviev, M., Reed, E., & Ferrari, E. (2023) · Current Bioinformatics · doi:10.2174/1574893618666230221141815 · Cited by 4
Comparison Between Next-Generation Sequencing and Microarrays for miRNA Expression in Cancer Samples
Pumeda, S. B. (2023) · National Academy Science Letters · doi:10.1007/s40009-023-01301-3 · Cited by 4
Liu, Y., Peng, C., Brorson, I. S., O'Mahony, D. G., Kelly, R. L., Heng, Y. J., Baker, G. M., Alnæs, G. I. G., Bodelón, C., Stover, D. G., et al. (2024) · The American Journal of Human Genetics · doi:10.1016/j.ajhg.2024.08.009 · Cited by 4
Rosikiewicz, M., & Robinson‐Rechavi, M. (2016) · Bioinformatics · doi:10.1093/bioinformatics/btw374 · Cited by 3
Cerri, F., Gentile, F., Clarelli, F., Santoro, S., Falzone, Y., Dina, G., Romano, A., Domi, T., Pozzi, L., Fazio, R., et al. (2022) · Frontiers in Oncology · doi:10.3389/fonc.2022.974751 · Cited by 5
“We performed quality controls assessing the presence of outliers by means of principal component analysis (PCA) and signal intensities distribution analysis with Bioconductor package Array Quality Metrics (15).”
MethodIntegrative gene expression analysis of lung cancer based on a technology-merging approach
Soto, J. M., Ortuño, F. M., & Rojas, I. (2015) · IEEE EUROCON - International Conference on Computer as a Tool (EUROCON) · doi:10.1109/eurocon.2015.7313796 · Cited by 3
“The quality analysis step for outlier detection has been carefully accomplished by means of ArrayQualityMetrics package [13] from Bioconductor package.”
MethodCurrent Omics Technologies in Biomarker Discovery
Ding, W. J., Qiu, P., Liu, Y., & Feng, W. (2013) · IGI Global eBooks · doi:10.4018/978-1-4666-3604-0.ch027 · Cited by 3
Classifying Osteosarcoma Using Meta-Analysis of Gene Expression
Alge, O., Gryak, J., Hua, Y., & Najaria, K. (2018) · IEEE International Conference on Bioinformatics and Biomedicine (BIBM) · doi:10.1109/bibm.2018.8621119 · Cited by 2
“2) Microarray Data Processing: We assessed the quality of microarray data with the R package arrayQualityMetrics [9].”
MethodIdentification of differentially expressed genes and networks related to hepatic lipid dysfunction
Abedini, J., Handa, S., Edwards, S. W., Chorley, B. N., & El-Masri, H. A. (2019) · Toxicology and Applied Pharmacology · doi:10.1016/j.taap.2019.114757 · Cited by 3
Identification of hub genes and infiltrating immune cells in skeletal muscle in obesity
Jin, S., Huang, J., Chen, K., & Wang, X. (2022) · Annals of Translational Medicine · doi:10.21037/atm-22-1010 · Cited by 2
Gene expression associated with white syndromes in a reef building coral, Acropora hyacinthus.Preprint
Wright, R. M., Aglyamova, G. V., Meyer, E., & Matz, M. V. (2014) · bioRxiv (Cold Spring Harbor Laboratory) · doi:10.1101/012211 · Cited by 4
“No outlying samples were detected by the arrayQualityMetrics package [78].”
Impact on gut development of an early life oral antibiotic intervention in broilers
Schokker, D., Jansman, A. J. M., de Bruin, N., Vastenhouw, S. A., de Bree, F. M., Rebel, J. M. J., & Smits, M. A. (2015) · Wageningen University & Research Publications · Cited by 3
Microvasculopathy, Luminal Calcification and Premature Aging in Fetuin-A Deficient MicePreprint
Herrmann, M., Babler, A., Moshkova, I., Gremse, F., Kiessling, F. M., Kusebauch, U., Nelea, V., Kramann, R., Moritz, R. L., McKee, M. D., et al. (2019) · bioRxiv (Cold Spring Harbor Laboratory) · doi:10.1101/577098 · Cited by 2
Curated and harmonised transcriptomics datasets of interstitial lung diseases
Inkala, S., Federico, A., Serra, A., & Greco, D. (2025) · Data in Brief · doi:10.1016/j.dib.2025.112139 · Cited by 3
“54.0 [ 40 ].”
InfluentialConstruction of a global map of human gene expression : the process, tools and analysis
Lukk, M. (2010) · Työväentutkimus Vuosikirja · Cited by 3
Metadata
- Authors
- Kauffmann, A., Gentleman, R., & Huber, W.
- Affiliations
- European Bioinformatics Institute (GB)
- Corresponding author
- Kauffmann, Audrey
- Venue
- Bioinformatics
- Publisher
- Oxford University Press (OUP)
- Published
- 2008-12-23
- Volume
- 25
- Issue
- 3
- Pages
- 415-416
- ISSN
- 1367-4803 (ISSN-L)
- 1367-4811
- PMC
- PMC2639074
- OpenAlex
- W2159096710
- Cited by
- 946
- References
- 11
- Citations by year
- 2026: 25 · 2025: 43 · 2024: 37 · 2023: 53 · 2022: 50 · 2021: 80 · 2020: 82 · 2019: 72 · 2018: 69 · 2017: 74 · 2016: 75 · 2015: 63 · 2014: 69 · 2013: 50 · 2012: 47
- FWCI
- 7.81
- Type
- journal article
- Language
- en
- Open access
- hybrid
- doi.org
- Licence
- Locations
- Bioinformatics (publishedVersion, cc-by-nc)
- PubMed Central (publishedVersion, cc-by-nc)
- PubMed (publishedVersion)
- Funders
- National Computational Infrastructure
- Australian Government
- Cancer Australia
- South Australian Research and Development Institute
- National Human Genome Research Institute (P41HG004059)
- Topics
- Life Sciences › Biochemistry, Genetics and Molecular Biology › Molecular Biology › Gene expression and cancer classification
- Life Sciences › Biochemistry, Genetics and Molecular Biology › Molecular Biology › Genomics and Phylogenetic Studies
- Life Sciences › Biochemistry, Genetics and Molecular Biology › Molecular Biology › Bioinformatics and Genomic Networks
- Keywords
- Bioconductor package, two-color microarrays, signal-to-noise ratio, reproducibility, automated reporting, diagnostic plots
- MeSH terms
- Algorithms, Data Interpretation, Statistical, Quality Control, Software, Computational Biology, Internet, Oligonucleotide Array Sequence Analysis
About these checks
Registry, retraction, Cites and statistics results are computed, not judged, with one exception: a printed reference that no index lists is read once by a model before it counts as a citation error. Claims are extracted by a model and kept only when their quote appears verbatim in the text; each cited source is then checked, with a model’s help, for whether it says what the claim relies on. Those verdicts can be wrong — read the claim’s quote and the cited source before relying on one.
Statistics and arithmetic are recomputed, not judged.
Confidence bands are shown only for fields calibrated on our annotated test set. None is calibrated yet, so no band is shown.
What counts as a claim ›How we measure confidence ›How we check this ›
Are you an author, or do you see a problem with this page? Request a review
Data sources
Bibliographic data: Semantic Scholar, OpenAlex, Crossref.
Contains information from the Semantic Scholar Academic Graph Datasets, made available under the ODC Attribution License (ODC-BY 1.0).
Semantic Scholar’s data is described in: Kinney, R., et al. (2023). The Semantic Scholar Open Data Platform. arXiv:2301.10140.
