

arrayQualityMetrics—a bioconductor package for quality assessment of microarray data
Open accessThe DOI matches its Crossref record; 12 of the 12 references it cites were found in a registry or an index.
Abstract
Summary:: The assessment of data quality is a major concern in microarray analysis. arrayQualityMetrics is a Bioconductor package that provides a report with diagnostic plots for one or two colour microarray data. The quality metrics assess reproducibility, identify apparent outlier arrays and compute measures of signal-to-noise ratio. The tool handles most current microarray technologies and is amenable to use in automated analysis pipelines or for automatic report generation, as well as for use by individuals. The diagnosis of quality remains, in principle, a context-dependent judgement, but our tool provides powerful, automated, objective and comprehensive instruments on which to base a decision. Availability:: arrayQualityMetrics is a free and open source package, under LGPL license, available from the Bioconductor project at www.bioconductor.org. A users guide and examples are provided with the package. Some examples of HTML reports generated by arrayQualityMetrics can be found at http://www.microarray-quality.org Contact:: audrey@ebi.ac.uk Supplementary information:: Supplementary data are available at Bioinformatics online.
Overview
The claims and statistics of this paper haven’t been checked yet.
Free: it reads the open-access text and checks the first 5 claims that cite a source we can check. Create a free account to check every claim.
Integrity signals
Registry
Cites
Statistics
Figures
Verification
Claims the paper makes
The claims and statistics of this paper haven’t been checked yet.
Free: it reads the open-access text and checks the first 5 claims that cite a source we can check. Create a free account to check every claim.
Claims other papers make about this one
Each is checked against this paper’s own text: does it say what the citing paper says it does?
In the citing paper
“Three RNA deep sequencing quality control measurements were performed to detect outliers and batch effects associated with the dataset: (a) L 1 distance between samples, (b) PCAs, and (c) similarity of density estimates of abundance values (53).”
From Development of an in vitro human liver system for interrogating nonalcoholic steatohepatitis (2016) · cites this paper as [53]
Self-check
Percentages, sums and reported differences re-computed from the paper’s own numbers.
The self-check needs the paper’s full text.
Citations
Cites
Bioconductor: open software development for computational biology and bioinformatics
Gentleman, R. C., Carey, V. J., Bates, D. M., Bolstad, B., Dettling, M., Dudoit, S., Ellis, B., Gautier, L., Ge, Y., Gentry, J., et al. (2004) · Genome Biology · doi:10.1186/gb-2004-5-10-r80 · Cited by 12,172 · cited 1×
“Availability: arrayQualityMetrics is a free and open source package, under LGPL license, available from the Bioconductor project at www.bioconductor.org.”
Self-citationaffy—analysis of Affymetrix GeneChip data at the probe level
Gautier, L., Cope, L., Bolstad, B. M., & Irizarry, R. A. (2004) · Bioinformatics · doi:10.1093/bioinformatics/btg405 · Cited by 5,218 · cited 2×
“The RNA degradation plot from the affy package (Gautier et al., 2004), the relative log expression (RLE) boxplots and the normalized unscaled standard error (NUSE) boxplots from the affyPLM package (Brettschneider et al., 2007) and the QC stat plot from the simpleaffy package (Wilson and Miller,…”
Dudoit, S., Yang, J. Y. H., Callow, M. J., & Speed, T. P. (2002) · UC Berkeley · Cited by 1,576
beadarray: R classes and methods for Illumina bead-based data
Dunning, M. J., Smith, M. L., Ritchie, M. E., & Tavaré, S. (2007) · Bioinformatics · doi:10.1093/bioinformatics/btm311 · Cited by 469
Simpleaffy: a BioConductor package for Affymetrix Quality Control and data analysis
Wilson, C. L., & Miller, C. J. (2005) · Bioinformatics · doi:10.1093/bioinformatics/bti605 · Cited by 445 · cited 2×
“In the case of one colour arrays, the M-value is computed by dividing the intensity by the median intensity of the same probe across all arrays.”
Normalization strategies for cDNA microarrays
Schuchhardt, J. (2000) · Nucleic Acids Research · doi:10.1093/nar/28.10.e47 · Cited by 331 · cited 1×
“Summary: The assessment of data quality is a major concern in microarray analysis. arrayQualityMetrics is a Bioconductor package that provides a report with diagnostic plots for one or two colour microarray data.”
Donuts, scratches and blanks: robust model-based segmentation of microarray images
Li, Q., Fraley, C., Bumgarner, R. E., Yeung, K. Y., & Raftery, A. E. (2005) · Computer applications in the biosciences · doi:10.1093/bioinformatics/bti447 · Cited by 127
arrayMagic: two-colour cDNA microarray quality control and preprocessing
Buneß, A., Huber, W. K., Steiner, K., Sültmann, H., & Poustka, A. (2004) · Bioinformatics · doi:10.1093/bioinformatics/bti052 · Cited by 55 · cited 2×
“, 2007), two-colour cDNA arrays (Buness et al., 2005).”
Self-citationMDQC: a new quality assessment method for microarrays based on quality control reports
Freue, G. V. C., Hollander, Z., Shen, E., Zamar, R. H., Balshaw, R. F., Scherer, A., McManus, B. M., Keown, P. A., McMaster, W. R., & Ng, R. T. (2007) · Bioinformatics · doi:10.1093/bioinformatics/btm487 · Cited by 42 · cited 2×
“Some tools perform outlier detection from quality metrics done before (Freue et al., 2007), or propose interactive quality plots (Lee et al.”
Array-A-Lizer: A serial DNA microarray quality analyzer
Petri, A., Fleckner, J., & Matthiessen, M. W. (2004) · BMC Bioinformatics · doi:10.1186/1471-2105-5-12 · Cited by 12
Research works printed but not linked: 2
- Brettschneider, 2007, Quality assessment for short oligonucleotide arrays
- Parman, 2005, affyQCReport: QC Report Generation for affyBatch objects.
Cited by
Items 401–500 of 951
Ramesh, N., Massaad, M. J., Kumar, L., Koduru, S., Sasahara, Y., Antón, I. M., Bhasin, M., Libermann, T. A., & Geha, R. S. (2014) · Molecular and Cellular Biology · doi:10.1128/mcb.00017-14 · Cited by 22
Does the endometrial gene expression of fertile women vary within and between cycles?
Evans, G. E., Phillipson, G. T. M., Sykes, P. H., McNoe, L. A., Print, C. G., & Evans, J. J. (2017) · Human Reproduction · doi:10.1093/humrep/dex385 · Cited by 25
Just, F., Oster, M., Büsing, K., Borgelt, L., Muráni, E., Ponsuksili, S., Wolf, P., & Wimmers, K. (2018) · BMC Genomics · doi:10.1186/s12864-018-4584-2 · Cited by 22
“All arrays were tested and passed quality control criteria as proposed previously [24].”
MethodSystems-level analysis identifies key regulators driving epileptogenesis in temporal lobe epilepsy
Fu, Y., Wu, Z., Guo, Z., Chen, L., Ma, Y., Wang, Z., Xiao, W., & Wang, Y. (2019) · Genomics · doi:10.1016/j.ygeno.2019.09.020 · Cited by 25
Construction of citrus gene coexpression networks from microarray data using random matrix theory
Du, D., Rawat, N., Deng, Z., & Gmitter, F. G. (2015) · Horticulture Research · doi:10.1038/hortres.2015.26 · Cited by 20
“One sample (GSM825502) that failed more than one test of arrayQualityMetrics 26 was removed and a total of 230 samples remained for network construction (Table S1).”
BackgroundGálvez, J. M., Castillo-Secilla, D., Herrera, L. J., Román, B. S., Valenzuela, O., Ortuño, F. M., & Rojas, I. (2018) · PLoS ONE · doi:10.1371/journal.pone.0196836 · Cited by 25
Zeng, H. M., Fu, Y., Shen, L., & Quan, S. (2022) · Frontiers in Endocrinology · doi:10.3389/fendo.2022.785462 · Cited by 20
“Quality controls (QC) were conducted using the R-package ArrayQualityMetrics (16).”
MethodSarafidis, M., Lambrou, G. Ι., Zoumpourlis, V., & Koutsouris, D. (2022) · Cancers · doi:10.3390/cancers14143358 · Cited by 22
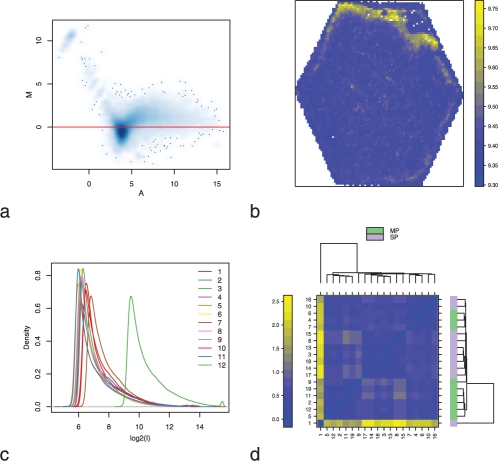
“50) [30], inspecting three visualizations included in the arrayQualityMetrics reports: the heatmap of the distance between arrays, the boxplot of the logarithm ratios, and the MA plot, which includes the logarithm of the intensity ratios (M) vs.”
BackgroundAdel‐Patient, K., Campeotto, F., Grauso, M., Guillon, B., Moroldo, M., Venot, É., Dietrich, C., Machavoine, F., Castelli, F. A., Fenaille, F., et al. (2023) · Frontiers in Immunology · doi:10.3389/fimmu.2023.1108895 · Cited by 20
“0) (21) and subsequently used to perform a scaled PCA analysis for quality assessment (FactoMineR R package, version 2.”
MethodAnalyzing ChIP-chip Data Using Bioconductor
Toedling, J., & Huber, W. K. (2008) · PLoS Computational Biology · doi:10.1371/journal.pcbi.1000227 · Cited by 20
“The Bioconductor package arrayQualityMetrics [21] offers an extensive set of visualizations and metrics for assessing microarray data quality.”
Self-citation‘Multi-omic’ data analysis using O-miner
Sangaralingam, A., Ullah, A. Z. M. D., Marzec, J., Gadaleta, E., Nagano, A., Ross‐Adams, H., Wang, J., Lemoine, N. R., & Chelala, C. (2017) · Briefings in Bioinformatics · doi:10.1093/bib/bbx080 · Cited by 20
Kriefall, N. G., Pechenik, J. A., Pires, A., & Davies, S. W. (2018) · Frontiers in Marine Science · doi:10.3389/fmars.2018.00312 · Cited by 20
“First, data were tested for sample outliers using the arrayQualityMetrics package (Kauffmann et al., 2009) and no outliers were detected.”
MethodNetwork-based analysis of omics with multi-objective optimization
Mosca, E., & Milanesi, L. (2013) · Molecular BioSystems · doi:10.1039/c3mb70327d · Cited by 22
AtGGM2014, an Arabidopsis gene co-expression network for functional studies
Ma, S., Bohnert, H. J., & Dinesh‐Kumar, S. P. (2015) · Science China Life Sciences · doi:10.1007/s11427-015-4803-x · Cited by 20
Effects of stress and MDMA on hippocampal gene expression
Weber, G. F., Johnson, B. N., Yamamoto, B. K., & Gudelsky, G. A. (2014) · BioMed Research International · doi:10.1155/2014/141396 · Cited by 19
“Analysis was performed using statistical software R and the limma package of Bioconductor [31].”
Grigore, I. A., Rajagopal, A., Chow, J. T.-S., Stone, T. J., & Salmena, L. (2024) · Scientific Reports · doi:10.1038/s41598-024-78337-y · Cited by 21
An evaluation of two-channel ChIP-on-chip and DNA methylation microarray normalization strategies
Adriaens, M. E., Jaillard, M., Eijssen, L., Mayer, C., & Evelo, C. T. (2012) · BMC Genomics · doi:10.1186/1471-2164-13-42 · Cited by 23
“Quality control and bias assessment of the raw and normalized data was performed using the arrayQuality-Metrics package [36].”
MethodDietary and environmental factors have opposite AhR-dependent effects on C. elegans healthspan
Brinkmann, V., Schiavi, A., Shaik, A., Puchta, D. R., & Ventura, N. (2020) · Aging · doi:10.18632/aging.202316 · Cited by 23
Mohr, T. T., Katz, S., Paulitschke, V., Aizarani, N., & Tolios, A. (2021) · Cancers · doi:10.3390/cancers13081768 · Cited by 18
“Data Preprocessing and QC CEL files were downloaded and read into “GNU R” [32] using the package “affy” [33] and preprocessed using the R-package “arrayQualityMetrics” [34].”
BackgroundMethodGene expression associated with disease resistance and long-term growth in a reef-building coral
Kelley, E. R., Sleith, R. S., Matz, M. V., & Wright, R. M. (2021) · Royal Society Open Science · doi:10.1098/rsos.210113 · Cited by 21
Basílio, J., Hochreiter, B., Hoesel, B., Sheshori, E., Mußbacher, M., Hanel, R., & Schmid, J. A. (2022) · Cancers · doi:10.3390/cancers14246164 · Cited by 22
Christen, L., Broghammer, H., Rapöhn, I., Möhlis, K., Strehlau, C., Ribas‐Latre, A., Gebhardt, C., Roth, L. G., Krause, K., Landgraf, K., et al. (2022) · Clinical and Translational Medicine · doi:10.1002/ctm2.1108 · Cited by 22
Studivan, M. S., Eckert, R. J., Shilling, E. N., Soderberg, N., Enochs, I. C., & Voss, J. D. (2023) · Molecular Ecology · doi:10.1111/mec.17110 · Cited by 20
Synergistic drug combinations from electronic health records and gene expression
Low, Y., Daugherty, A. C., Schroeder, E. A., Chen, W., Seto, T., Weber, S., Lim, M., Hastie, T. J., Mathur, M. B., Desai, M., et al. (2016) · Journal of the American Medical Informatics Association · doi:10.1093/jamia/ocw161 · Cited by 22
“31 When raw data were unavailable, processed data were used instead.”
Mastelic-Gavillet, B., Vono, M., Gonzalez‐Dias, P., Ferreira, F. M., Cardozo, L. E., Lambert, P., Nakaya, H. I., & Siegrist, C. (2019) · Frontiers in Immunology · doi:10.3389/fimmu.2019.01845 · Cited by 18
“First, raw expression data from GSE43863 and GSE40068 studies were normalized by RMA using the affy R/Bioconductor package (46), and submitted to quality control with the arrayQualityMetrics R/Bioconductor package (47).”
MethodSchyman, P., Printz, R. L., Estes, S. K., O’Brien, T. P., Shiota, M., & Wallqvist, A. (2019) · Frontiers in Genetics · doi:10.3389/fgene.2019.01233 · Cited by 19
Eichner, J., Kossler, N., Wrzodek, C., Kalkuhl, A., Toft, D. B., Ostenfeldt, N., Richard, V. E., & Zell, A. (2013) · PLoS ONE · doi:10.1371/journal.pone.0073938 · Cited by 19
Aguilar-Rangel, M. R., Montes, R. A. C., González‐Segovia, E., Ross‐Ibarra, J., Simpson, J. K., & Sawers, R. J. H. (2017) · PeerJ · doi:10.7717/peerj.3737 · Cited by 21
The Transcription Factors EBF1 and EBF2 Are Positive Regulators of Myelination in Schwann Cells
Moruzzo, D., Nobbio, L., Sterlini, B., Consalez, G. G., Benfenati, F., Schenone, A. E., & Corradi, A. (2016) · Molecular Neurobiology · doi:10.1007/s12035-016-0296-2 · Cited by 18
“Quality controls on raw and normalized data were performed using the R-package arrayQualityMetrics [19], inspecting MAplots, boxplot, and heatmap to detect outlier samples.”
MethodPinheiro‐de‐Sousa, I., Fonseca‐Alaniz, M. H., Teixeira, S. K., Rodrigues, M. V., & Krieger, J. E. (2022) · Scientific Reports · doi:10.1038/s41598-022-05404-7 · Cited by 23
A truncated HIV Tat demonstrates potent and specific latency reversal activity
Gulck, E. R. V., Pardons, M., Nijs, E., Verheyen, N., Dockx, K., den Eynde, C. V., Battivelli, E., Vega, J. B., Florence, É., Autran, B., et al. (2023) · Antimicrobial Agents and Chemotherapy · doi:10.1128/aac.00417-23 · Cited by 19
“Quality assessment was performed with array QualityMetrics (97).”
MethodFutrega, K., Yu, J., Jones, J. W., Kane, M. A., Lott, W. B., Atkinson, K., & Doran, M. R. (2016) · Lab on a Chip · doi:10.1039/c6lc00269b · Cited by 19
McKay, J. A., Adriaens, M. E., Evelo, C. T., Ford, D., & Mathers, J. C. (2016) · Molecular Nutrition & Food Research · doi:10.1002/mnfr.201600079 · Cited by 18
“All samples passed the quality control analysis performed in the arrayQualityMetrics package [34].”
Zhu, Y., Mordaunt, C. E., Durbin-Johnson, B. P., Caudill, M. A., Malysheva, O., Miller, J. W., Green, R., James, S. J., Melnyk, S. B., Fallin, M. D., et al. (2020) · Autism Research · doi:10.1002/aur.2428 · Cited by 27
Nehme, A., Dakik, H., Picou, F., Cheok, M. H.-C., Preudhomme, C., Dombret, H., Lambert, J., Gyan, E., Pigneux, A., Récher, C., et al. (2020) · Blood Advances · doi:10.1182/bloodadvances.2020002042 · Cited by 21
“Likewise, our score could not identify poor responders within the favorable subtype, despite taking t(8;21) and t(9;11) translocations into account while identifying CODEGs.”
BackgroundAshley, S., Jones, A. C., Anderson, D. R., Holt, P. G., Bosco, A., & Tang, M. L. K. (2022) · Allergy · doi:10.1111/all.15324 · Cited by 18
Sill, M., Saadati, M., & Benner, A. (2015) · Bioinformatics · doi:10.1093/bioinformatics/btv197 · Cited by 21
“In bioinformatics typical applications range from outlier detection as part of quality control (Kauffmann et al. , 2009) to exploratory data analysis for revealing new molecular subgroups (Remke et al. , 2011), as well as pathway and network analysis (Ma and Dai, 2011).”
BackgroundWissing, M. L., Sonne, S. B., Westergaard, D., do Nguyen, K., Belling, K., Høst, T., & Mikkelsen, A. L. (2014) · Journal of Ovarian Research · doi:10.1186/s13048-014-0110-6 · Cited by 19
“Array quality was assessed with the arrayQualityMetrics R package [14], which used a variety of statistical tests combined with data visualization to mark outliers.”
MethodExpression of aurora kinase A correlates with the Wnt‐modulator RACGAP 1 in gastric cancer
Bornschein, J., Nielitz, J., Drozdov, I. A., Selgrad, M., Wex, T., Jechorek, D., Link, A., Vieth, M., & Malfertheiner, P. (2016) · Cancer Medicine · doi:10.1002/cam4.610 · Cited by 20
“The arrayQualityMetrics [20] Bioconductor package was used to identify and remove outlying samples.”
MethodKeller, R. F., Dragomir, A., Fan, Y., Akay, Y. M., & Akay, M. (2018) · Scientific Reports · doi:10.1038/s41598-018-31882-9 · Cited by 19
Yacoub, A., Gerbore, J., Magnin, N., Haidar, R., Compant, S., & Rey, P. (2017) · Biological Control · doi:10.1016/j.biocontrol.2017.02.007 · Cited by 17
Zhou, M. R., Lu, F., Jiang, L., Chen, C., Chen, S., Geng, L., Sun, R., Li, Q., Duan, S., Zhang, B., et al. (2023) · Journal of Inflammation Research · doi:10.2147/jir.s409017 · Cited by 18
Ficklin, S. P., & Feltus, F. A. (2013) · PLoS ONE · doi:10.1371/journal.pone.0068551 · Cited by 18
“All microarrays were then pre-processed with RMA normalization [60] using RMAExpress [61] and outliers were detected using the arrayQualityMetrics package [62] for BioConductor [63].”
MethodMessenger RNA and microRNA profiling during early mouse EB formation
Tripathi, R., Saini, H. K., Rad, R., Abreu‐Goodger, C., van Dongen, S., & Enright, A. J. (2011) · Gene Expression Patterns · doi:10.1016/j.gep.2011.03.004 · Cited by 17
Wu, J. N., Pinello, L., Yissachar, E., Wischhusen, J. W., Yuan, G., & Roberts, C. W. M. (2015) · Epigenetics & Chromatin · doi:10.1186/s13072-015-0046-0 · Cited by 21
Aging: a portrait from gene expression profile in blood cells
Calabria, E., Mazza, E. M. C., Dyar, K. A., Pogliaghi, S., Bruseghini, P., Morandi, C., Salvagno, G. L., Gelati, M., Guidi, G. C., Bicciato, S., et al. (2016) · Aging · doi:10.18632/aging.101016 · Cited by 22
“Quality control was performed using ArrayQualityMetrics [66], and based on the quality assessment all 20 samples were deemed suitable for further analysis.”
Bagewadi, S., Raschka, T., Naz, M., Simoes, R. D. M., Senger, P., & Hofmann‐Apitius, M. (2017) · Journal of Alzheimer s Disease · doi:10.3233/jad-170011 · Cited by 24
“Using the Bioconductor package arrayQuality-Metrics [40], we assessed the array quality and removed the outlier samples.”
MethodInduction of Cell Cycle and NK Cell Responses by Live-Attenuated Oral Vaccines against Typhoid Fever
Blohmke, C. J., Hill, J. W., Darton, T. C., Bürger, M. C., Eustace, A., Jones, C., Schreiber, F., Goodier, M. R., Dougan, G., Nakaya, H. I., et al. (2017) · Frontiers in Immunology · doi:10.3389/fimmu.2017.01276 · Cited by 16
“Quality control was performed using the arrayQualityMetrics() function in R (51) and led to the exclusion of 14 samples.”
MethodAKIRIN1: A Potential New Reference Gene in Human Natural Killer Cells and Granulocytes in Sepsis
Coulibaly, A., Velásquez, S. Y., Sticht, C., Figueiredo, A. S., Himmelhan, B. S., Schulte, J., Sturm, T., Centner, F.-S., Schoettler, J. J., Thiel, M., et al. (2019) · International Journal of Molecular Sciences · doi:10.3390/ijms20092290 · Cited by 16
“A quality assessment of the microarray data using the R/Bioconductor package arrayQualityMetrics [63] is provided as Supplementary Results.”
MethodChronic Disruption of the Late Cholesterol Synthesis Leads to Female-Prevalent Liver Cancer
Cokan, K. B., Urlep, Ž., Lorbek, G., Matz‐Soja, M., Skubic, C., Perše, M., Jeruc, J., Juvan, P., Režen, T., & Rozman, D. (2020) · Cancers · doi:10.3390/cancers12113302 · Cited by 19
“Package arrayQualityMetrics [81] was used to check additional quality control and assessment of potential outliers before and after normalization.”
MethodA New Ensemble Method for Detecting Anomalies in Gene Expression Matrices
Selicato, L., Esposito, F., Gargano, G., Vegliante, M. C., Opinto, G., Zaccaria, G. M., Ciavarella, S., Guarini, A., & Buono, N. D. (2021) · Mathematics · doi:10.3390/math9080882 · Cited by 17
“In the context of gene expression array analysis, state-of-the-art standard methods for detecting anomalies in microarrays, which are considered reference methods, are implemented in the Bioconductor package arrayQuality [19,20].”
MethodFibromine is a multi-omics database and mining tool for target discovery in pulmonary fibrosis
Fanidis, D., Moulos, P., & Aidinis, V. (2021) · Scientific Reports · doi:10.1038/s41598-021-01069-w · Cited by 19
Gene expression profiling of sequential metastatic biopsies for biomarker discovery in breast cancer
Foukakis, T., Lövrot, J., Sandqvist, P., Xie, H., Lindström, L. S., Giorgetti, C., Jacobsson, H., Hedayati, E., & Bergh, J. C. S. (2015) · Molecular Oncology · doi:10.1016/j.molonc.2015.03.011 · Cited by 17
“The quality of gene expression data was assessed with the arrayQualityMetrics package (Kauffmann et al., 2009).”
Bandopadhayay, P., Jabbour, A. M., Riffkin, C. D., Salmanidis, M., Gordon, L., Popovski, D., Rigby, L., Ashley, D. M., Watkins, D. N., Thomas, D. M., et al. (2013) · BMC Cancer · doi:10.1186/1471-2407-13-585 · Cited by 19
“Data quality was confirmed using Bioconductor packages arrayQualityMetrics and lumi [17-19].”
MethodIyappan, A., Bagewadi, S., Raschka, T., Hofmann‐Apitius, M., & Senger, P. (2016) · Journal of Biomedical Semantics · doi:10.1186/s13326-016-0079-8 · Cited by 21
“To assess the quality of the arrays we applied ArrayQuali-tyMetrics [79] package.”
MethodFatima, A., Connaughton, R. M., Weiser, A., Murphy, A. M., O’Grada, C. M., Ryan, M., Brennan, L., Gaora, P. Ó., & Roche, H. M. (2017) · Molecular Nutrition & Food Research · doi:10.1002/mnfr.201700388 · Cited by 20
“Signal intensity files from Affymetrix were checked for quality using the arrayQualitymetrics bioconductor package [14].”
MethodChoudhari, J. K., Verma, M. K., Choubey, J., & Sahariah, B. P. (2021) · Scientific Reports · doi:10.1038/s41598-020-77636-4 · Cited by 18
Targeting the TP53/MDM2 axis enhances radiation sensitivity in atypical teratoid rhabdoid tumors
Alimova, I. N., Wang, D., Danis, E. P., Pierce, A. M., Donson, A. M., Serkova, N. J., Madhavan, K. P. C., Lakshmanachetty, S., Balakrishnan, I., Foreman, N. K., et al. (2022) · International Journal of Oncology · doi:10.3892/ijo.2022.5322 · Cited by 19
Uludağ, D., Bay, S., Sucu, B. O., İpek, Ö. Ş., Mohr, T. T., Güzel, M., & Karakaş, N. (2022) · Frontiers in Pharmacology · doi:10.3389/fphar.2022.828400 · Cited by 18
“Raw data (E-GEOD-16011 and E-GEOD-4271) were downloaded from the ArrayAxpress database using the R package ArrayExpress (Kauffmann et al., 2009).”
MethodInfluentialKazmin, D. A., Clutterbuck, E., Napolitani, G., Wilkins, A. L., Tarlton, A., Thompson, A., Montomoli, E., Lapini, G., Bihari, S., White, R., et al. (2023) · npj Vaccines · doi:10.1038/s41541-023-00702-1 · Cited by 19
Transcriptomic risk scores for attention deficit/hyperactivity disorder
Cabana‐Domínguez, J., Llonga, N., Arribas, L., Alemany, S., Vilar‐Ribó, L., Demontis, D., Fadeuilhe, C., Corrales, M., Richarte, V., Børglum, A. D., et al. (2023) · Molecular Psychiatry · doi:10.1038/s41380-023-02200-1 · Cited by 23
“PNPLA2 was the most ubiquitous gene found colocalized in 9 tissues (GCLP range: 0.643 – 0.896), followed by REELD1 in 8 tissues (GCLP range: 0.615 – 0.818), and LSM6 in 7 tissues (GCLP range: 0.724 – 0.844; Supplementary Table S6).”
BackgroundInfluentialDeciphering gene expression program of MAP3K1 in mouse eyelid morphogenesis
Jin, C., Chen, J., Meng, Q., Carreira, V., Tam, N. N. C., Geh, E. N., Karyala, S. V., Ho, S., Zhou, X., Medvedovic, M., et al. (2012) · Developmental Biology · doi:10.1016/j.ydbio.2012.11.020 · Cited by 17
“Statistical and bioinformatics analyses Microarray data were analyzed at gene level using statistical software R and the limma package of Bioconductor (Smyth, 2004) with custom CDF downloaded from BrainArray (Dai et al., 2005).”
MethodJNK signaling regulates oviposition in the malaria vector Anopheles gambiae
Peirce, M. J., Mitchell, S. N., Kakani, E. G., Scarpelli, P., South, A., Shaw, W. R., Werling, K., Gabrieli, P., Marcenac, P., Bordoni, M., et al. (2020) · Scientific Reports · doi:10.1038/s41598-020-71291-5 · Cited by 27
Ramos‐Campoy, O., Lladó, A., Bosch, B., Ferrer, M., Pérez‐Millan, A., Vergara, M., Molina‐Porcel, L., Fort‐Aznar, L., Gonzalo, R., Moreno, F., et al. (2022) · Molecular Neurobiology · doi:10.1007/s12035-022-02969-2 · Cited by 21
Mapping of hepatic expression quantitative trait loci (eQTLs) in a Han Chinese population
Wang, X., Tang, H., Teng, M., Li, Z., Li, J., Fan, J., Zhong, L., Sun, X., Xu, J., Chen, G., et al. (2014) · Journal of Medical Genetics · doi:10.1136/jmedgenet-2013-102045 · Cited by 20
Lai, C. K., Moon, Y., Kuchenbauer, F. C., Starzcynowski, D. T., Argiropoulos, B., Yung, E., Beer, P. A., Schwarzer, A., Sharma, A., Park, G., et al. (2014) · PLoS ONE · doi:10.1371/journal.pone.0112671 · Cited by 16
“Quality was assessed with the ArrayQualityMetrics package [36].”
MethodLysophosphatidic Acid Is a Proinflammatory Stimulus of Renal Tubular Epithelial Cells
Magkrioti, C., Antonopoulou, G., Fanidis, D., Pliaka, V., Sakellaropoulos, T., Alexopoulos, L. G., Ullmer, C., & Aidinis, V. (2022) · International Journal of Molecular Sciences · doi:10.3390/ijms23137452 · Cited by 16
miRNA expression profiling of formalin-fixed paraffin-embedded (FFPE) hereditary breast tumors
Tanić, M., Yanowsky, K., Andrés‐León, E., Goméz-López, G., Socorro, M. R.-P., Pisano, D. G., Martínez–Delgado, B., & Benitez, J. J. (2014) · Genomics Data · doi:10.1016/j.gdata.2014.11.008 · Cited by 15
“Further between array quality control was performed using ArrayDataMetrics R/Bioconductor package [6].”
MethodEvidence of function for conserved noncoding sequences in Arabidopsis thaliana
Spangler, J. B., Subramaniam, S., Freeling, M., & Feltus, F. A. (2011) · New Phytologist · doi:10.1111/j.1469-8137.2011.03916.x · Cited by 15
Integration of flow studies for robust selection of mechanoresponsive genes
Maimari, N., Pedrigi, R. M., Russo, A., Broda, K. B., & Krams, R. (2016) · Thrombosis and Haemostasis · doi:10.1160/th15-09-0704 · Cited by 16
“Finally, individual studies were assessed for technical and biological outliers by arrayQualityMetrics (36).”
BackgroundValor, L. M., Rodríguez‐Bayona, B., Ramos-Amaya, A., Brieva, J. A., & Campos‐Caro, A. (2017) · PLoS ONE · doi:10.1371/journal.pone.0183264 · Cited by 17
Does Inter-Organellar Proteostasis Impact Yeast Quality and Performance During Beer Fermentation?
Telini, B. D. P., Menoncin, M., & Bonatto, D. (2020) · Frontiers in Genetics · doi:10.3389/fgene.2020.00002 · Cited by 17
“parsing (Davis and Meltzer, 2007); (ii) arrayQualityMetrics for microarray quality analysis (Kauffmann et al., 2009) and (iii) limma for differentially expressed gene (DEG) analysis (Ritchie et al.”
MethodGene Expression Profiles in Children With Suspected Sepsis
Balamuth, F., Alpern, E. R., Kan, M., Shumyatcher, M., Hayes, K. L., Lautenbach, E., & Himes, B. E. (2020) · Annals of Emergency Medicine · doi:10.1016/j.annemergmed.2019.09.020 · Cited by 15
Differential Targeting of Gr-MDSCs, T Cells and Prostate Cancer Cells by Dactolisib and Dasatinib
Liu, G., Jin, Z., & Lü, X. (2020) · International Journal of Molecular Sciences · doi:10.3390/ijms21072337 · Cited by 18
“0 package [47] used for quality control and calibration, ArrayExpress 1.”
MethodScheff, N. N., Ye, Y., Conley, Z. R., Quan, J. W., Lam, Y. V. R., Klares, R., Singh, K., Schmidt, B. L., & Aouizerat, B. E. (2020) · Pain · doi:10.1097/j.pain.0000000000001926 · Cited by 17
Comparative neurotranscriptomics reveal widespread species differences associated with bonding
Tripp, J. A., Berrío, A., McGraw, L. A., Matz, M. V., Davis, J. K., Inoue, K., Thomas, J. W., Young, L. J., & Phelps, S. M. (2021) · BMC Genomics · doi:10.1186/s12864-021-07720-0 · Cited by 23
Aguirre, E. G., Million, W. C., Bartels, E., Krediet, C. J., & Kenkel, C. D. (2022) · Coral Reefs · doi:10.1007/s00338-022-02218-x · Cited by 16
“The arrayQualityMetrics and DESeq2 R packages (Kauffmann et al. 2009; Love et al. 2014) were used to screen for outlier samples.”
MethodExploring the use of internal and externalcontrols for assessing microarray technical performance
Lippa, K. A., Duewer, D. L., Salit, M., Gamé, L., & Causton, H. C. (2010) · BMC Research Notes · doi:10.1186/1756-0500-3-349 · Cited by 13
“Extensive whole-array quality assurance metrics and BioConductor-based summary statistics [27-30] related to scanner/array performance and RNA quality are routinely assembled for each of the datasets with a report generated at the CSC/IC Microarray Centre.”
BackgroundSmith, W., Jäntti, J., Oja, M., & Saloheimo, M. (2014) · BMC Biotechnology · doi:10.1186/s12896-014-0091-y · Cited by 15
Mayer‐Wagner, S., Hammerschmid, F., Blum, H., Krebs, S., Redeker, J. I., Holzapfel, B. M., Jansson, V., & Müller, P. E. (2016) · Archives of Medical Science · doi:10.5114/aoms.2016.59894 · Cited by 15
“All arrays passed the quality control checks implemented in the R package arrayQualityMetrics [22].”
MethodPlassais, J., Venet, F., Cazalis, M.-A., Quang, D. L., Pachot, A., Monneret, G., Tissot, S., & Textoris, J. (2017) · Critical Care · doi:10.1186/s13054-017-1743-9 · Cited by 16
Kan, M., Shumyatcher, M., Diwadkar, A. R., Soliman, G., & Himes, B. E. (2018) · Europe PMC (PubMed Central) · Cited by 17
AHR Signaling Dampens Inflammatory Signature in Neonatal Skin γδ T Cells
Merches, K., Schiavi, A., Weighardt, H., Steinwachs, S., Teichweyde, N., Förster, I., Hochrath, K., Schumak, B., Ventura, N., Petzsch, P., et al. (2020) · International Journal of Molecular Sciences · doi:10.3390/ijms21062249 · Cited by 15
“0) [78], a Bioconductor [79] package under R.”
MethodPianigiani, G., Licastro, D., Fortugno, P., Castiglia, D., Petrovic, I. M., & Pagani, F. (2018) · RNA · doi:10.1261/rna.063438.117 · Cited by 17
“To detect outlier data after normalization, we used the R package arrayQualityMetrics (Kauffmann et al. 2009), and before”
MethodAryl Hydrocarbon Receptor-Dependent and -Independent Pathways Mediate Curcumin Anti-Aging Effects
Brinkmann, V., Romeo, M., Larigot, L., Hemmers, A., Tschage, L., Kleinjohann, J., Schiavi, A., Steinwachs, S., Esser, C., Menzel, R., et al. (2022) · Antioxidants · doi:10.3390/antiox11040613 · Cited by 20
A PREVENTIVE TOOL FOR PREDICTING BLOODSTREAM INFECTIONS IN CHILDREN WITH BURNS
Tsurumi, A., Flaherty, P., Que, Y., Ryan, C. M., Banerjee, A., Chakraborty, A., Almpani, M., Shankar, M., Goverman, J. M., Schulz, J., et al. (2023) · Shock · doi:10.1097/shk.0000000000002075 · Cited by 16
Al‐Shaer, L., Leach, W. B., Baban, N., Yagodich, M., Gibson, M. C., & Layden, M. J. (2023) · Royal Society Open Science · doi:10.1098/rsos.230152 · Cited by 19
Ruggeri, M., Zhang, Y., Aglyamova, G. V., & Kenkel, C. D. (2023) · Frontiers in Marine Science · doi:10.3389/fmars.2023.1163552 · Cited by 16
Valadez-Ingersoll, M., Carrión, P. J. A., Bodnar, C. A., Desai, N. A., Gilmore, T. D., & Davies, S. W. (2024) · Proceedings of the Royal Society B Biological Sciences · doi:10.1098/rspb.2023.1685 · Cited by 14
“ArrayQualityMetrics (v.3.52.0) [31] tested for outliers.”
InfluentialA reproducible approach to high-throughput biological data acquisition and integration
Börnigen, D., Moon, Y. S., Rahnavard, A., Waldron, L., McIver, L. J., Shafquat, A., Franzosa, E. A., Miropolsky, L., Sweeney, C. J., Morgan, X. C., et al. (2015) · PeerJ · doi:10.7717/peerj.791 · Cited by 17
Investigation of protein secretion and secretion stress in Ashbya gossypii
Aguiar, T. Q., Ribeiro, O., Arvas, M., Wiebe, M. G., Penttilä, M. E., & Domingues, L. (2014) · BMC Genomics · doi:10.1186/1471-2164-15-1137 · Cited by 16
“Array data quality was controlled with arrayQualityMetrics [87] and sample wise Principal Component Analysis (PCA) of raw, RMA preprocessed and repeat averaged data.”
MethodMaeda, K., Showmaker, K. C., Johnson, A. C., Garrett, M. R., & Sasser, J. M. (2019) · Physiological Genomics · doi:10.1152/physiolgenomics.00020.2019 · Cited by 13
MatrixQCvis: shiny-based interactive data quality exploration for omics data
Naake, T., & Huber, W. K. (2021) · Bioinformatics · doi:10.1093/bioinformatics/btab748 · Cited by 14
“Several software packages exist that center around the assessment of data quality: among others, arrayQualityMetrics (Kauffmann et al., 2009), initially developed more than 10 years ago for the quality assessment of microarrays, that creates automatic reports of the data quality. Contrary to arrayQualityMetrics, which…”
MethodSelf-citationMoore, S. G., McCabe, M. S., Green, J. C., Newsom, E. M., & Lucy, M. C. (2017) · Biology of Reproduction · doi:10.1093/biolre/iox059 · Cited by 15
The relative resistance of children to sepsis mortality: from pathways to drug candidates
Joachim, R. B., Altschuler, G. M., Hutchinson, J. N., Wong, H. R., Hide, W. A., & Kobzik, L. (2018) · Molecular Systems Biology · doi:10.15252/msb.20177998 · Cited by 14
Reyer, H., Oster, M., Magowan, E. A., Muráni, E., Sauerwein, H., Dannenberger, D., Kuhla, B., Ponsuksili, S., & Wimmers, K. (2018) · Physiological Genomics · doi:10.1152/physiolgenomics.00021.2018 · Cited by 24
“The initial microarray processing included a quality check (28) and robust multichip average (RMA) normalization (Log2) of raw intensity values.”
MethodYuen, S. C., Zhu, H., & Leung, S.-W. (2020) · Frontiers in Neuroscience · doi:10.3389/fnins.2020.00209 · Cited by 16
“Fyn is a protein tyrosine kinase belonging to the Src family, and it mediates synaptic plasticity in the central nervous system (Kaufman et al., 2015).”
BackgroundChoi, J., Tarnouskaya, A., Nesdoly, S., Topouza, D. G., Koti, M., & Duan, Q. (2020) · BMC Cancer · doi:10.1186/s12885-020-06922-1 · Cited by 14
“Two potential outliers and two duplicated samples were removed from the study during the quality control step using the arrayQualityMetrics [25] package (see Supplemental Data 1 for steps of pre-processing), resulting in 135 sensitive and 99 resistant HGSOC subjects in the expression set.”
MethodGenome-wide studies of time of day in the brain: Design and analysis
Wu, G., Ruben, M. D., Lee, Y., Li, J., Hughes, M. E., & Hogenesch, J. B. (2020) · Brain Science Advances · doi:10.26599/bsa.2020.9050005 · Cited by 12
“package arrayQualityMetrics [42] detects outlier samples for Affymetrix arrays, and FastQC (https://www.”
BackgroundKugler, K., Jandric, Z., Beyer, R., Klopf, E., Glaser, W., Lemmens, M., Shams, M., Mayer, K., Adam, G., & Schüller, C. (2016) · BMC Genomics · doi:10.1186/s12864-016-2718-y · Cited by 15
“Quality Controls were performed using the arrayQualityMetrics package [98].”
Method
Metadata
- Authors
- Kauffmann, A., Gentleman, R., & Huber, W.
- Affiliations
- European Bioinformatics Institute (GB)
- Corresponding author
- Kauffmann, Audrey
- Venue
- Bioinformatics
- Publisher
- Oxford University Press (OUP)
- Published
- 2008-12-23
- Volume
- 25
- Issue
- 3
- Pages
- 415-416
- ISSN
- 1367-4803 (ISSN-L)
- 1367-4811
- PMC
- PMC2639074
- OpenAlex
- W2159096710
- Cited by
- 946
- References
- 11
- Citations by year
- 2026: 25 · 2025: 43 · 2024: 37 · 2023: 53 · 2022: 50 · 2021: 80 · 2020: 82 · 2019: 72 · 2018: 69 · 2017: 74 · 2016: 75 · 2015: 63 · 2014: 69 · 2013: 50 · 2012: 47
- FWCI
- 7.81
- Type
- journal article
- Language
- en
- Open access
- hybrid
- doi.org
- Licence
- Locations
- Bioinformatics (publishedVersion, cc-by-nc)
- PubMed Central (publishedVersion, cc-by-nc)
- PubMed (publishedVersion)
- Funders
- National Computational Infrastructure
- Australian Government
- Cancer Australia
- South Australian Research and Development Institute
- National Human Genome Research Institute (P41HG004059)
- Topics
- Life Sciences › Biochemistry, Genetics and Molecular Biology › Molecular Biology › Gene expression and cancer classification
- Life Sciences › Biochemistry, Genetics and Molecular Biology › Molecular Biology › Genomics and Phylogenetic Studies
- Life Sciences › Biochemistry, Genetics and Molecular Biology › Molecular Biology › Bioinformatics and Genomic Networks
- Keywords
- Bioconductor package, two-color microarrays, signal-to-noise ratio, reproducibility, automated reporting, diagnostic plots
- MeSH terms
- Algorithms, Data Interpretation, Statistical, Quality Control, Software, Computational Biology, Internet, Oligonucleotide Array Sequence Analysis
About these checks
Registry, retraction, Cites and statistics results are computed, not judged, with one exception: a printed reference that no index lists is read once by a model before it counts as a citation error. Claims are extracted by a model and kept only when their quote appears verbatim in the text; each cited source is then checked, with a model’s help, for whether it says what the claim relies on. Those verdicts can be wrong — read the claim’s quote and the cited source before relying on one.
Statistics and arithmetic are recomputed, not judged.
Confidence bands are shown only for fields calibrated on our annotated test set. None is calibrated yet, so no band is shown.
What counts as a claim ›How we measure confidence ›How we check this ›
Are you an author, or do you see a problem with this page? Request a review
Data sources
Bibliographic data: Semantic Scholar, OpenAlex, Crossref.
Contains information from the Semantic Scholar Academic Graph Datasets, made available under the ODC Attribution License (ODC-BY 1.0).
Semantic Scholar’s data is described in: Kinney, R., et al. (2023). The Semantic Scholar Open Data Platform. arXiv:2301.10140.
