

arrayQualityMetrics—a bioconductor package for quality assessment of microarray data
Open accessThe DOI matches its Crossref record; 12 of the 12 references it cites were found in a registry or an index.
Abstract
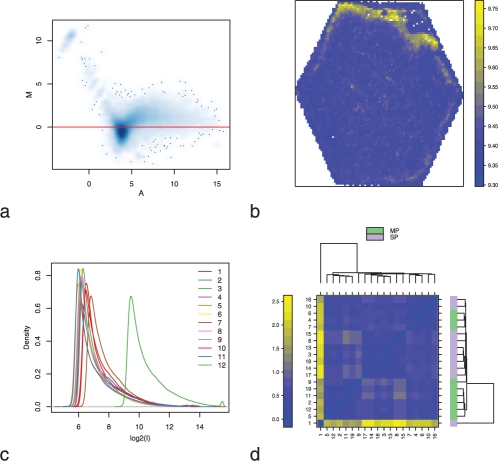
Summary:: The assessment of data quality is a major concern in microarray analysis. arrayQualityMetrics is a Bioconductor package that provides a report with diagnostic plots for one or two colour microarray data. The quality metrics assess reproducibility, identify apparent outlier arrays and compute measures of signal-to-noise ratio. The tool handles most current microarray technologies and is amenable to use in automated analysis pipelines or for automatic report generation, as well as for use by individuals. The diagnosis of quality remains, in principle, a context-dependent judgement, but our tool provides powerful, automated, objective and comprehensive instruments on which to base a decision. Availability:: arrayQualityMetrics is a free and open source package, under LGPL license, available from the Bioconductor project at www.bioconductor.org. A users guide and examples are provided with the package. Some examples of HTML reports generated by arrayQualityMetrics can be found at http://www.microarray-quality.org Contact:: audrey@ebi.ac.uk Supplementary information:: Supplementary data are available at Bioinformatics online.
Overview
The claims and statistics of this paper haven’t been checked yet.
Free: it reads the open-access text and checks the first 5 claims that cite a source we can check. Create a free account to check every claim.
Integrity signals
Registry
Cites
Statistics
Figures
Verification
Claims the paper makes
The claims and statistics of this paper haven’t been checked yet.
Free: it reads the open-access text and checks the first 5 claims that cite a source we can check. Create a free account to check every claim.
Claims other papers make about this one
Each is checked against this paper’s own text: does it say what the citing paper says it does?
In the citing paper
“Three RNA deep sequencing quality control measurements were performed to detect outliers and batch effects associated with the dataset: (a) L 1 distance between samples, (b) PCAs, and (c) similarity of density estimates of abundance values (53).”
From Development of an in vitro human liver system for interrogating nonalcoholic steatohepatitis (2016) · cites this paper as [53]
Self-check
Percentages, sums and reported differences re-computed from the paper’s own numbers.
The self-check needs the paper’s full text.
Citations
Cites
Bioconductor: open software development for computational biology and bioinformatics
Gentleman, R. C., Carey, V. J., Bates, D. M., Bolstad, B., Dettling, M., Dudoit, S., Ellis, B., Gautier, L., Ge, Y., Gentry, J., et al. (2004) · Genome Biology · doi:10.1186/gb-2004-5-10-r80 · Cited by 12,172 · cited 1×
“Availability: arrayQualityMetrics is a free and open source package, under LGPL license, available from the Bioconductor project at www.bioconductor.org.”
Self-citationaffy—analysis of Affymetrix GeneChip data at the probe level
Gautier, L., Cope, L., Bolstad, B. M., & Irizarry, R. A. (2004) · Bioinformatics · doi:10.1093/bioinformatics/btg405 · Cited by 5,218 · cited 2×
“The RNA degradation plot from the affy package (Gautier et al., 2004), the relative log expression (RLE) boxplots and the normalized unscaled standard error (NUSE) boxplots from the affyPLM package (Brettschneider et al., 2007) and the QC stat plot from the simpleaffy package (Wilson and Miller,…”
Dudoit, S., Yang, J. Y. H., Callow, M. J., & Speed, T. P. (2002) · UC Berkeley · Cited by 1,576
beadarray: R classes and methods for Illumina bead-based data
Dunning, M. J., Smith, M. L., Ritchie, M. E., & Tavaré, S. (2007) · Bioinformatics · doi:10.1093/bioinformatics/btm311 · Cited by 469
Simpleaffy: a BioConductor package for Affymetrix Quality Control and data analysis
Wilson, C. L., & Miller, C. J. (2005) · Bioinformatics · doi:10.1093/bioinformatics/bti605 · Cited by 445 · cited 2×
“In the case of one colour arrays, the M-value is computed by dividing the intensity by the median intensity of the same probe across all arrays.”
Normalization strategies for cDNA microarrays
Schuchhardt, J. (2000) · Nucleic Acids Research · doi:10.1093/nar/28.10.e47 · Cited by 331 · cited 1×
“Summary: The assessment of data quality is a major concern in microarray analysis. arrayQualityMetrics is a Bioconductor package that provides a report with diagnostic plots for one or two colour microarray data.”
Donuts, scratches and blanks: robust model-based segmentation of microarray images
Li, Q., Fraley, C., Bumgarner, R. E., Yeung, K. Y., & Raftery, A. E. (2005) · Computer applications in the biosciences · doi:10.1093/bioinformatics/bti447 · Cited by 127
arrayMagic: two-colour cDNA microarray quality control and preprocessing
Buneß, A., Huber, W. K., Steiner, K., Sültmann, H., & Poustka, A. (2004) · Bioinformatics · doi:10.1093/bioinformatics/bti052 · Cited by 55 · cited 2×
“, 2007), two-colour cDNA arrays (Buness et al., 2005).”
Self-citationMDQC: a new quality assessment method for microarrays based on quality control reports
Freue, G. V. C., Hollander, Z., Shen, E., Zamar, R. H., Balshaw, R. F., Scherer, A., McManus, B. M., Keown, P. A., McMaster, W. R., & Ng, R. T. (2007) · Bioinformatics · doi:10.1093/bioinformatics/btm487 · Cited by 42 · cited 2×
“Some tools perform outlier detection from quality metrics done before (Freue et al., 2007), or propose interactive quality plots (Lee et al.”
Array-A-Lizer: A serial DNA microarray quality analyzer
Petri, A., Fleckner, J., & Matthiessen, M. W. (2004) · BMC Bioinformatics · doi:10.1186/1471-2105-5-12 · Cited by 12
Research works printed but not linked: 2
- Brettschneider, 2007, Quality assessment for short oligonucleotide arrays
- Parman, 2005, affyQCReport: QC Report Generation for affyBatch objects.
Cited by
Items 101–200 of 951
Islam, A. B. M. M. K., & Khan, M. A. (2020) · Scientific Reports · doi:10.1038/s41598-020-76404-8 · Cited by 99
Integrated miRNA and mRNA Expression Profiling in Inflamed Colon of Patients with Ulcerative Colitis
der Goten, J. V., Vanhove, W., Lemaire, K., Lommel, L. V., Machiels, K., Wollants, W.-J., Preter, V. D., Hertogh, G. D., Ferrante, M., Assche, G. V., et al. (2014) · PLoS ONE · doi:10.1371/journal.pone.0116117 · Cited by 97
“detection was performed before and after normalization using the Bioconductor package arrayQualityMetrics [25].”
MethodGlobal Gene Expression Analysis of Murine Limb Development
Taher, L., Collette, N. M., Murugesh, D. K., Maxwell, E. K., Ovcharenko, I., & Loots, G. G. (2011) · PLoS ONE · doi:10.1371/journal.pone.0028358 · Cited by 101
Corey, K. E., Pitts, R., Lai, M., Loureiro, J., Masia, R., Osganian, S. A., Gustafson, J. L., Hutter, M. M., Gee, D. W., Meireles, O. R., et al. (2022) · Journal of Hepatology · doi:10.1016/j.jhep.2021.09.026 · Cited by 88
House, C. D., Jordan, E., Hernandez, L., Ozaki, M., James, J. M., Kim, M., Kruhlak, M. J., Batchelor, E., Elloumi, F., Cam, M. C., et al. (2017) · Cancer Research · doi:10.1158/0008-5472.can-17-0366 · Cited by 91
Dumitriu, A., Latourelle, J. C., Hadzi, T. C., Pankratz, N., Garza, D., Miller, J. P., Vance, J. M., Foroud, T., Beach, T. G., & Myers, R. H. (2012) · PLoS Genetics · doi:10.1371/journal.pgen.1002794 · Cited by 91
“Nine outlier samples were detected based on the arrayQualityMetrics default criteria [46] and were dropped from further analyses.”
MethodPatir, A., Shih, B., McColl, B. W., & Freeman, T. C. (2019) · Glia · doi:10.1002/glia.23572 · Cited by 90
Loveday, E.-K., Svinti, V., Diederich, S., Pasick, J. M. M., & Jean, F. (2012) · Journal of Virology · doi:10.1128/jvi.06892-11 · Cited by 100
“was carried out using the package arrayQualityMetrics (33) in the R sta-”
MethodMartel, C., Zhurov, V. V., Navarro, M., Martínez, M., Cazaux, M., Auger, P., Migeon, A., Santamaria, M. E., Wybouw, N., Díaz, I., et al. (2015) · Molecular Plant-Microbe Interactions · doi:10.1094/mpmi-09-14-0291-fi · Cited by 103
“An initial data quality assessment was conducted using arrayQualityMetrics (Kauffmann et al. 2009).”
MethodBeckers, V., Poblete‐Castro, I., Tomasch, J., & Wittmann, C. (2016) · Microbial Cell Factories · doi:10.1186/s12934-016-0470-2 · Cited by 98
Assessing affymetrix GeneChip microarray quality
McCall, M. N., Murakami, P. N., Lukk, M., Huber, W. K., & Irizarry, R. A. (2011) · BMC Bioinformatics · doi:10.1186/1471-2105-12-137 · Cited by 97
“While there have been previous attempts at providing array quality metrics coupled with publicly available data sets [24,25] and at assessing the effect of quality on differential expression [26], these attempts used metrics that could only assess the quality of an array relative to other arrays in the batch or the qu…”
Self-citationModeling human pancreatic beta cell dedifferentiation
Diedisheim, M., Oshima, M., Albagli, O., Huldt, C. W., Ahlstedt, I., Clausen, M., Menon, S., Aivazidis, A., Andréasson, A., Haynes, W. G., et al. (2018) · Molecular Metabolism · doi:10.1016/j.molmet.2018.02.002 · Cited by 98
“Differential gene expression was assessed as previously described [15,16].”
MethodDefining the Microglia Response during the Time Course of Chronic Neurodegeneration
Vincenti, J. E., Murphy, L., Grabert, K., McColl, B. W., Cancellotti, E., Freeman, T. C., & Manson, J. C. (2016) · Journal of Virology · doi:10.1128/jvi.02613-15 · Cited by 88
G Protein-coupled pH-sensing Receptor OGR1 Is a Regulator of Intestinal Inflammation
de Vallière, C., Wang, Y., Eloranta, J. J., Vidal, S., Clay, I., Spalinger, M. R., Tcymbarevich, I., Terhalle, A., Ludwig, M., Suply, T., et al. (2015) · Inflammatory Bowel Diseases · doi:10.1097/mib.0000000000000375 · Cited by 98
Skeletal muscle characteristics are preserved in hTERT/cdk4 human myogenic cell lines
Thorley, M., Duguez, S., Mazza, E. M. C., Valsoni, S., Bigot, A., Mamchaoui, K., Harmon, B., Voit, T., Mouly, V., & Duddy, W. (2016) · Skeletal Muscle · doi:10.1186/s13395-016-0115-5 · Cited by 86
“The Bioconductor library arrayQualityMetrics was used for quality assessment of the arrays [41].”
MethodEndoDB: a database of endothelial cell transcriptomics data
Khan, S., Taverna, F., Rohlenová, K., Treps, L., Geldhof, V., de Rooij, L. P. M. H., Sokol, L., Pircher, A., Conradi, L., Kalucka, J. M., et al. (2018) · Nucleic Acids Research · doi:10.1093/nar/gky997 · Cited by 91
Alterations in the sputum proteome and transcriptome in smokers and early-stage COPD subjects
Titz, B., Sewer, A., Schneider, T., Elamin, A., Martin, F. P., Dijon, S., Luettich, K., Guedj, E., Vuillaume, G., Ivanov, N. V., et al. (2015) · Journal of Proteomics · doi:10.1016/j.jprot.2015.08.009 · Cited by 98
Liu, W.-T., Wang, Y., Zhang, J., Ye, F., Huang, X., Li, B., & He, Q. (2018) · Cancer Letters · doi:10.1016/j.canlet.2018.03.043 · Cited by 85
The Choice between MapMan and Gene Ontology for Automated Gene Function Prediction in Plant Science
Klie, S., & Nikoloski, Z. (2012) · Frontiers in Genetics · doi:10.3389/fgene.2012.00115 · Cited by 84
“Here, the R Bioconductor package array Quality Metrics (Kauffmann et al., 2009) was employed to conduct (1) between-array comparisons based on distance between arrays and Principal Component Analysis, (2) density plots, (3) variance-mean dependence of each array, (4) individual array quality…”
Abdelrahman, M., Nishiyama, R., Tran, C. D., Kusano, M., Nakabayashi, R., Okazaki, Y., Matsuda, F., Montes, R. A. C., Mostofa, M. G., Li, W., et al. (2021) · Proceedings of the National Academy of Sciences · doi:10.1073/pnas.2105021118 · Cited by 90
“The ArrayQualityMetrics (96) R package was run for each experiment, and low-quality samples were discarded.”
MethodMolecular analysis of cyenopyrafen resistance in the two‐spotted spider mite Tetranychus urticae
Khalighi, M., Dermauw, W., Wybouw, N., Bajda, S., Osakabe, M., Tirry, L., & Leeuwen, T. V. (2015) · Pest Management Science · doi:10.1002/ps.4071 · Cited by 92
Mach, N., Plancade, S., Pacholewska, A., Lecardonnel, J., Rivière, J., Moroldo, M., Vaiman, A., Morgenthaler, C., Beinat, M., Nevot, A., et al. (2016) · Scientific Reports · doi:10.1038/srep22932 · Cited by 85
Kasturi, S. P., Kozlowski, P. A., Nakaya, H. I., Bürger, M. C., Russo, P., Pham, M., Kovalenkov, Y. O., Silveira, E. L. V., Havenar‐Daughton, C., Burton, S. L., et al. (2016) · Journal of Virology · doi:10.1128/jvi.01844-16 · Cited by 92
Date, S. V., Modrusan, Z. D., Lawrence, M. F., Morisaki, J. H., Toy, K. J., Shah, I. M., Kim, J., Park, S., Xu, M. J., Basuino, L., et al. (2013) · The Journal of Infectious Diseases · doi:10.1093/infdis/jit668 · Cited by 88
“Array quality was determined using the standard array quality metrics (AQM) bioconductor package [13].”
MethodThe Ink4a/Arf locus operates as a regulator of the circadian clock modulating RAS activity
El‐Athman, R., Генов, Н., Mazuch, J., Zhang, K., Yu, Y., Fuhr, L., Abreu, M., Li, Y., Wallach, T. E., Kramer, A., et al. (2017) · PLoS Biology · doi:10.1371/journal.pbio.2002940 · Cited by 88
Potential Marker Pathways in the Endometrium That May Cause Recurrent Implantation Failure
Baştu, E., Demiral, İ., Günel, T., Ülgen, E., Gümüşoğlu-Acar, E., Hosseini, M. K., Sezerman, O. U., Buyru, F., & Yeh, J. (2018) · Reproductive Sciences · doi:10.1177/1933719118792104 · Cited by 89
“array QualityMetrics.(9) After median intensity values were read into R, the data were background-corrected using the normexp method.”
MethodmTORC1 is Required for Brown Adipose Tissue Recruitment and Metabolic Adaptation to Cold
Labbé, S. M., Mouchiroud, M., Caron, A., Secco, B., Freinkman, E., Lamoureux, G., Gélinas, Y., Lecomte, R., Bossé, Y., Chimin, P., et al. (2016) · Scientific Reports · doi:10.1038/srep37223 · Cited by 82
Li, H., Reksten, T. R., Ice, J. A., Kelly, J. A., Adrianto, I., Rasmussen, A., Wang, S., He, B., Grundahl, K. M., Glenn, S. B., et al. (2017) · PLoS Genetics · doi:10.1371/journal.pgen.1006820 · Cited by 88
Sárvári, M., Hrabovszky, E., Kalló, I., Solymosi, N., Tóth, K., Likó, I., Széles, J., Mahó, S., Molnár, B., & Liposits, Z. (2011) · Journal of Neuroinflammation · doi:10.1186/1742-2094-8-82 · Cited by 78
“After outlier identification [26], linear models combined with empirical Bayesian methods were applied [27] and the raw fold change values were used to select differentially expressed genes [28].”
MethodPPAR agonists regulate brain gene expression: Relationship to their effects on ethanol consumption
Ferguson, L. B., Most, D., Blednov, Y. A., & Harris, R. A. (2014) · Neuropharmacology · doi:10.1016/j.neuropharm.2014.06.024 · Cited by 82
“Quality assessment of the data using Bioconductor arrayQualityMetrics package (Kauffmann et al., 2009) resulted in the removal of 7 outliers: amygdala 16 (fenotreated) and 31 (beza-treated); PFC 6 (tesa-treated) and 36 (fenotreated); and liver 11 (beza-treated), 27 (tesa-treated) and 36…”
Combined Activity of DCL2 and DCL3 Is Crucial in the Defense against Potato Spindle Tuber Viroid
Κατσαρού, Κ., Mavrothalassiti, E., Dermauw, W., Leeuwen, T. V., & Kalantidis, K. (2016) · PLoS Pathogens · doi:10.1371/journal.ppat.1005936 · Cited by 83
DrosophilaDosage Compensation Involves Enhanced Pol II Recruitment to Male X-Linked Promoters
Conrad, T., Cavalli, F. M. G., Vaquerizas, J. M., Luscombe, N. M., & Akhtar, A. (2012) · Science · doi:10.1126/science.1221428 · Cited by 77
Human Kidney Tubule-Specific Gene Expression Based Dissection of Chronic Kidney Disease Traits
Beckerman, P., Qiu, C., Park, J., Ledó, N., Ko, Y.-A., Park, A. S. D., Han, S. Y., Choi, P., Palmer, M., & Suszták, K. (2017) · EBioMedicine · doi:10.1016/j.ebiom.2017.09.014 · Cited by 81
“(Kauffmann et al., 2009) Outliers were identified using several detection methods including: PCA (presented in FigS3), MA-plot, the boxplot of the log-ratios, distance between arrays, relative log expression (RLE), normalized unscaled standard error (NUSE) and spatial distribution of M (feature…”
MethodGabriel, M., Fey, V., Heinosalo, T., Adhikari, P. R., Rytkönen, K. T., Komulainen, T., Huhtinen, K., Laajala, T. D., Siitari, H., Virkki, A., et al. (2020) · Scientific Data · doi:10.1038/s41597-020-00623-x · Cited by 84
β - catenin is central to DUX4 -driven network rewiring in facioscapulohumeral muscular dystrophy
Banerji, C. R. S., Knopp, P., Moyle, L. A., Simone Severini, B., Orrell, R. W., Teschendorff, A. E., & Zammit, P. S. (2014) · Journal of The Royal Society Interface · doi:10.1098/rsif.2014.0797 · Cited by 78
Guo, H., Lee, T., Wang, X., & Paterson, A. H. (2013) · PLANT PHYSIOLOGY · doi:10.1104/pp.112.213447 · Cited by 86
“We further filtered the data set to remove outlier data points using arrayQualityMetrics in the Bioconductor packages (Kauffmann et al., 2009).”
MethodKenkel, C. D., Moya, A., Strahl, J., Humphrey, C. A., & Bay, L. K. (2017) · Global Change Biology · doi:10.1111/gcb.13833 · Cited by 86
Kustikova, O. S., Schwarzer, A., Stahlhut, M., Brugman, M. H., Neumann, T., Yang, M., Li, Z., Schambach, A., Heinz, N., Gerdes, S., et al. (2012) · Leukemia · doi:10.1038/leu.2012.355 · Cited by 79
Hoeksema, M. A., Scicluna, B. P., Boshuizen, M. C. S., van der Velden, S., Neele, A. E., den Bossche, J. V., Matlung, H. L., van den Berg, T. K., Goossens, P., & de Winther, M. P. J. (2015) · The Journal of Immunology · doi:10.4049/jimmunol.1402077 · Cited by 76
“0 (16) was used for further quality assessment of the normalized bead summary data.”
MethodLuisier, R., Lempiäinen, H., Scherbichler, N., Braeuning, A., Geissler, M., Dubost, V., Müller, A., Scheer, N., Chibout, S., Hara, H., et al. (2014) · Toxicological Sciences · doi:10.1093/toxsci/kfu038 · Cited by 75
“Quality metrics including scaling factors, average intensities, background intensities, RNA degradation, and raw Q values obtained from arrays prior and after normalization using Bioconductor’s array QualityMetrics package (Kauffmann et al., 2009) were within acceptable limits except for six chips which were removed f…”
MethodDiscovery of a ZIP7 inhibitor from a Notch pathway screen
Nolin, E., Gans, S., Llamas, L., Bandyopadhyay, S., Brittain, S. M., Bernasconi-Elias, P., Carter, K. P., Loureiro, J., Thomas, J. R., Schirle, M., et al. (2018) · Nature Chemical Biology · doi:10.1038/s41589-018-0200-7 · Cited by 70
Rajamani, D., & Bhasin, M. (2016) · Genome Medicine · doi:10.1186/s13073-016-0282-3 · Cited by 74
“The quality of the normalized data from Affymetrix gene expression datasets was assessed using the arrayQualityMetrics package from Bioconductor [19].”
MethodInfluentialNaorem, L. D., Muthaiyan, M., & Venkatesan, A. (2018) · Journal of Cellular Biochemistry · doi:10.1002/jcb.27903 · Cited by 74
“Raw CEL files were downloaded and quality of the individual samples for each data set was assessed with the R package arrayQualitymetrics.(12) This package detects outlier samples based on three quality control criteria such as array intensity distribution through box plot and density plot, individual array quality th…”
MethodMucosal IL13RA2 expression predicts nonresponse to anti‐TNF therapy in Crohn's disease
Verstockt, B., Verstockt, S., Creyns, B., Tops, S., Assche, G. V., Gils, A., Ceuppens, J. L., Vermeire, S., Ferrante, M., & Breynaert, C. M. (2019) · Alimentary Pharmacology & Therapeutics · doi:10.1111/apt.15126 · Cited by 76
Highet, A. R., Khoda, S. M.-E., Buckberry, S., Leemaqz, S., Bianco‐Miotto, T., Harrington, E., Ricciardelli, C., & Roberts, C. T. (2015) · European Journal of Cell Biology · doi:10.1016/j.ejcb.2015.10.004 · Cited by 76
Therapeutic activity of modified U1 core spliceosomal particles
Rogalska, M. E., Tajnik, M., Licastro, D., Bussani, E., Camparini, L., Mattioli, C., & Pagani, F. (2016) · Nature Communications · doi:10.1038/ncomms11168 · Cited by 76
Riedelberger, M., Penninger, P., Tscherner, M., Seifert, M., Jenull, S., Brunnhofer, C., Scheidl, B., Tsymala, I., Bourgeois, C., Petryshyn, A., et al. (2020) · Cell Host & Microbe · doi:10.1016/j.chom.2020.01.023 · Cited by 64
Khoo, S., Read, J. F., Franks, K., Zhang, G., Bizzintino, J. A., Coleman, L., McCrae, C., Öberg, L., Troy, N. M., Prastanti, F., et al. (2019) · The Journal of Immunology · doi:10.4049/jimmunol.1800178 · Cited by 67
“Low-quality/outlying arrays were identified on the basis of relative log expression and normalized unscaled standard error metrics and removed from the analysis (19, 20).”
MethodBarneda-Zahonero, B., Román-González, L., Collazo, O., Rafati, H., Islam, A. B. M. M. K., Bussmann, L. H., di Tullio, A., De Andres, L., Graf, T., López-Bigas, N., et al. (2013) · PLoS Genetics · doi:10.1371/journal.pgen.1003503 · Cited by 67
Kararigas, G., Fliegner, D., Gustafsson, J.-Α., & Regitz‐Zagrosek, V. (2011) · Physiological Genomics · doi:10.1152/physiolgenomics.00199.2010 · Cited by 76
“The quality of the data was assessed with the affy (11) and the arrayQualityMetrics (22) packages.”
MethodSchokker, D., Fledderus, J., Jansen, R., Vastenhouw, S. A., de Bree, F. M., Smits, M. A., & Jansman, A. J. M. (2018) · Journal of Animal Science · doi:10.1093/jas/sky110 · Cited by 75
Snoeck, S., Pavlidi, N., Pipini, D., VONTAS, J. G., Dermauw, W., & Leeuwen, T. V. (2019) · Insect Biochemistry and Molecular Biology · doi:10.1016/j.ibmb.2019.04.010 · Cited by 68
Prenatal Lead Levels, Plasma Amyloid β Levels, and Gene Expression in Young Adulthood
Mazumdar, M., Xia, W., Hofmann, O., Gregas, M., Sui, S. H., Hide, W., Yang, T., Needleman, H. L., & Bellinger, D. C. (2012) · Environmental Health Perspectives · doi:10.1289/ehp.1104474 · Cited by 65
“Array data were retrieved and processed using the BioConductor framework, version 2.9 (Gentleman et al. 2004; http://www.bioconductor.org/), and tested for quality using the arrayQualityMetrics package (Kauffmann et al. 2009).”
MethodInfluentialStrader, M. E., Wong, J. M., Kozal, L. C., Leach, T. S., & Hofmann, G. E. (2019) · Journal of Experimental Marine Biology and Ecology · doi:10.1016/j.jembe.2019.03.002 · Cited by 68
Systems Level Analysis and Identification of Pathways and Networks Associated with Liver Fibrosis
AbdulHameed, M. D. M., Tawa, G. J., Kumar, K., Ippolito, D. L., Lewis, J. A., Stallings, J. D., & Wallqvist, A. (2014) · PLoS ONE · doi:10.1371/journal.pone.0112193 · Cited by 63
“We then used the BioConductor package ArrayQualityMetrics to assess the quality of the microarray data and removed 155 outlier arrays [42].”
MethodDanova‐Alt, R., Heider, A., Egger, D., Cross, M. A., & Alt, R. (2012) · PLoS ONE · doi:10.1371/journal.pone.0034899 · Cited by 72
“Microarray data quality was checked with arrayQualityMetrics [16].”
MethodThe leukocyte non-coding RNA landscape in critically ill patients with sepsis
Scicluna, B. P., Uhel, F., van Vught, L. A., Wiewel, M. A., Hoogendijk, A. J., Baessmann, I., Franitza, M., Nürnberg, P., Horn, J., Cremer, O. L., et al. (2020) · eLife · doi:10.7554/elife.58597 · Cited by 66
Walker, L., Boddington, C., Jenkins, D., Wang, Y., Grønlund, J. T., Hulsmans, J., Kumar, S., Patel, D., Moore, J. D., Carter, A., et al. (2017) · The Plant Cell · doi:10.1105/tpc.16.00961 · Cited by 61
“All arrays for pericycle and cortex were normalized together, and arrays were assessed for quality implemented by the Bioconductor package arrayQualityMetrics (Kauffmann et al., 2009).”
MethodCortese, M., Hagan, T., Rouphael, N., Wu, S.-Y., Xie, X., Kazmin, D. A., Wimmers, F., Gupta, S., der Most, R. G. V., Coccia, M., et al. (2025) · Nature Immunology · doi:10.1038/s41590-024-02036-z · Cited by 78
“Initial data quality was assessed by background level, 3′ labeling bias, and pairwise correlation among samples via the arrayQualityMetrics package in Bioconductor (v.3.17) 83 .”
InfluentialMaking Informed Choices about Microarray Data Analysis
Reimers, M. (2010) · PLoS Computational Biology · doi:10.1371/journal.pcbi.1000786 · Cited by 72
“One general statistical approach to address QA issues is to compare each chip to an ideal reference and look for unusually large departures from the ideal that seem correlated with known technical variables [9,10,11].”
BackgroundKuijjer, M. L., van den Akker, B. E. W. M., Hilhorst, R., Mommersteeg, M., Buddingh, E. P., Serra, M., Buerger, H., Hogendoorn, P. C. W., & Cleton-Jansen, A. (2014) · BMC Medical Genomics · doi:10.1186/1755-8794-7-4 · Cited by 71
“Kauffmann A, Gentleman R, Huber W: arrayQualityMetrics–a bioconductor package for quality assessment of microarray data.”
MethodWhitmore, S. S., Braun, T. A., Skeie, J. M., Haas, C. M., Sohn, E. H., Stone, E. M., Scheetz, T. E., & Mullins, R. F. (2013) · PubMed Central · Cited by 75
Iskandar, A. R., Mathis, C., Schlage, W. K., Frentzel, S., Leroy, P., Xiang, Y., Sewer, A., Majeed, S., Ortega-Torres, L., Johne, S., et al. (2016) · Toxicology in Vitro · doi:10.1016/j.tiv.2016.11.009 · Cited by 68
A practical data processing workflow for multi-OMICS projects
Kohl, M., Megger, D. A., Trippler, M., Meckel, H., Ahrens, M., Bracht, T., Weber, F., Hoffmann, A.-C., Baba, H. A., Sitek, B., et al. (2014) · Biochimica et Biophysica Acta (BBA) - Proteins and Proteomics · doi:10.1016/j.bbapap.2013.02.029 · Cited by 60
Wolski, D., Foote, P. K., Chen, D. Y., Lewis‐Ximenez, L. L., Fauvelle, C., Aneja, J., Walker, A., Tonnerre, P., Torres-Cornejo, A., Kvistad, D., et al. (2017) · Immunity · doi:10.1016/j.immuni.2017.09.006 · Cited by 64
“Finally, probe sets were collapsed to the gene level using genefilter (Kauffmann et al., 2009), removing duplicate entries and manufacturer quality control probe sets, resulting in a set of 5246 genes.”
Lentiviral Vector Induced Insertional Haploinsufficiency of Ebf1 Causes Murine Leukemia
Heckl, D., Schwarzer, A., Haemmerle, R., Steinemann, D., Rudolph, C., Skawran, B., Knoess, S., Krause, J., Li, Z., Schlegelberger, B., et al. (2012) · Molecular Therapy · doi:10.1038/mt.2012.59 · Cited by 60
Integration of RNA-Seq data with heterogeneous microarray data for breast cancer profiling
Castillo-Secilla, D., Gálvez, J. M., Herrera, L. J., Román, B. S., Rojas, F., & Rojas, I. (2017) · BMC Bioinformatics · doi:10.1186/s12859-017-1925-0 · Cited by 65
“This outliers detection and removal was performed through arrayQualityMetrics R package [27], which computes the Kolmogorov-Smirnov statistic K a between the distribution of each array and the distribution of the pooled data.”
MethodSnoeck, S., Wybouw, N., Leeuwen, T. V., & Dermauw, W. (2018) · G3 Genes Genomes Genetics · doi:10.1534/g3.118.200585 · Cited by 61
Schwarzenbacher, R. E., Wardell, G. E., Stassen, J., Guest, E. J., Zhang, P., Luna, E., & Ton, J. (2020) · Molecular Plant · doi:10.1016/j.molp.2020.07.010 · Cited by 68
Whole genome analysis of p38 SAPK-mediated gene expression upon stress
Ferreiro, I., Joaquin, M., Islam, A. B. M. M. K., Goméz-López, G., Barragán, M., Lombardía, L., Domínguez, O., Pisano, D. G., López-Bigas, N., Nebreda, Á. R., et al. (2010) · BMC Genomics · doi:10.1186/1471-2164-11-144 · Cited by 72
“The quality and homogeneity of the background corrected and VSN normalized microarray data [26] for the Cy5 and Cy3 channels was assessed by the Bioconductor package arrayQualityMetrics [15] version 2.”
MethodIdentification of ELF3 as an early transcriptional regulator of human urothelium
Böck, M., Hinley, J., Schmitt, C., Wahlicht, T., Krämer, S., & Southgate, J. (2013) · Developmental Biology · doi:10.1016/j.ydbio.2013.12.028 · Cited by 57
“Quality assessment of the microarrays was performed with the arrayQualityMetrics package (Kauffmann et al., 2009) and two samples were discarded due to quality issues (one control sample: 72 h ABS/Ca2þ from cell line M.”
MethodEMA - A R package for Easy Microarray data analysis
Servant, N., Gravier, E., Gestraud, P., Laurent, C., Paccard, C., Biton, A., Brito, I., Mandel, J., Asselain, B. J. R., Barillot, E., et al. (2010) · BMC Research Notes · doi:10.1186/1756-0500-3-277 · Cited by 64
“For the data quality assessment, we recommend to use the arrayQualityMetrics package [3], which performs a powerful, easy-to-use and comprehensive data quality estimation as well as an automatic html report.”
MethodAn end to end workflow for differential gene expression using Affymetrix microarrays
Klaus, B., & Reisenauer, S. (2016) · F1000Research · doi:10.12688/f1000research.8967.1 · Cited by 89
“[1] "hugene10sttranscriptcluster" [2] "hugene10sttranscriptclusterACCNUM" [3] "hugene10sttranscriptclusterALIAS2PROBE" [4] "hugene10sttranscriptclusterCHR" [5] "hugene10sttranscriptclusterCHRLENGTHS" [6] "hugene10sttranscriptclusterCHRLOC"”
Muñoz‐Marín, M. D. C., Shilova, I. N., Shi, T., Farnelid, H., Cabello, A. M., & Zehr, J. P. (2019) · mBio · doi:10.1128/mbio.02495-18 · Cited by 59
“org) and the Bioconductor Project (58), specifically, using the Biobase (59), Linear Models for Microarray LIMMA (60), arrayQualityMetrics (61), affyPLM (62, 63), and genefilter packages.”
Gasparetto, M., Payne, F., Nayak, K., Kraiczy, J., Glemas, C., Philip-McKenzie, Y., Ross, A., Edgar, R. D., Zerbino, D. R., Salvestrini, C., et al. (2020) · Gastroenterology · doi:10.1053/j.gastro.2020.08.017 · Cited by 62
“0).(19) Samples failing quality control were removed, and batch correction was performed using the “ComBat” function as part of the sva package (version 3.”
Islam, A. B. M. M. K., Khan, M. A., Ahmed, R., Hossain, M. S., Kabir, S. M. T., Islam, M. S., & Siddiki, A. Z. (2021) · Journal of Translational Medicine · doi:10.1186/s12967-020-02695-0 · Cited by 64
Gibson, S. M., Ficklin, S. P., Isaacson, S., Luo, F., Feltus, F. A., & Smith, M. C. (2013) · PLoS ONE · doi:10.1371/journal.pone.0055871 · Cited by 71
“After normalization, outliers were detected using the arrayQualityMetrics [57] package provided by BioConductor [58].”
MethodA NETWORK VIEW ON PARKINSON'S DISEASE
Chandrasekaran, S., & Bonchev, D. (2013) · Computational and Structural Biotechnology Journal · doi:10.5936/csbj.201304004 · Cited by 58
A comparison of analog and Next-Generation transcriptomic tools for mammalian studies
Roy, N. C., Altermann, E., Park, Z. A., & McNabb, W. C. (2011) · Briefings in Functional Genomics · doi:10.1093/bfgp/elr005 · Cited by 67
Jubb, A. W., Young, R. S., Hume, D. A., & Bickmore, W. A. (2016) · The Journal of Immunology · doi:10.4049/jimmunol.1502009 · Cited by 58
McKinney, E. F., Cuthbertson, I., Harris, K. M., Smilek, D. E., Connor, C., Manferrari, G., Carr, E. J., Zamvil, S. S., & Smith, K. G. C. (2021) · Nature Communications · doi:10.1038/s41467-020-20594-2 · Cited by 61
McMurray, J. L., von Borstel, A., Taher, T. E. I., Syrimi, E., Taylor, G. S., Sharif, M., Rossjohn, J., Remmerswaal, E. B. M., Bemelman, F. J., Braga, F. A. V., et al. (2022) · Cell Reports · doi:10.1016/j.celrep.2022.110858 · Cited by 61
“Outliers were determined using PCA and the arrayQualityMetrics R package (Kauffmann et al., 2009) in accordance with outlier removal peformed by Guinney et al.”
MethodCastillo-Secilla, D., Gálvez, J. M., Herrera, L. J., Rojas, F., Valenzuela, O., Caba, O., Prados, J. C., & Rojas, I. (2019) · PLoS ONE · doi:10.1371/journal.pone.0212127 · Cited by 67
Miller, W. R., Larionov, A. A., Anderson, T. J., Evans, D. B., & Dixon, J. M. (2010) · The Pharmacogenomics Journal · doi:10.1038/tpj.2010.67 · Cited by 59
BeadArray Expression Analysis Using Bioconductor
Ritchie, M. E., Dunning, M., Smith, M. L., Shi, W., & Lynch, A. G. (2011) · PLoS Computational Biology · doi:10.1371/journal.pcbi.1002276 · Cited by 64
“The arrayQualityMetrics [20] package is able to”
Keildson, S., Fadista, J., Ladenvall, C., Hedman, Å. K., Elgzyri, T., Small, K. S., Grundberg, E., Nica, A. C., Glass, D., Richards, J. B., et al. (2014) · Diabetes · doi:10.2337/db13-1301 · Cited by 61
Bosco, A., Wiehler, S., & Proud, D. (2016) · BMC Genomics · doi:10.1186/s12864-016-2405-z · Cited by 56
“The quality of the microarray data was assessed with ArrayQualityMetrics [20].”
Method3-D nasal cultures: Systems toxicological assessment of a candidate modified-risk tobacco product
Iskandar, A. R., Mathis, C., Martin, F., Leroy, P., Sewer, A., Majeed, S., Kuehn, D., Trivedi, K., Grandolfo, D., Cabanski, M., et al. (2016) · ALTEX · doi:10.14573/altex.1605041 · Cited by 62
Colorectal premalignancy is associated with consensus molecular subtypes 1 and 2
Chang, K., Willis, J. A., Reumers, J., Taggart, M. W., San Lucas, F. A., Thirumurthi, S., Kanth, P., Delker, D. A., Hagedorn, C. H., Lynch, P. M., et al. (2018) · Annals of Oncology · doi:10.1093/annonc/mdy337 · Cited by 51
Rivera, H. E., & Davies, S. W. (2021) · Scientific Reports · doi:10.1038/s41598-021-00697-6 · Cited by 52
Murthy, S., Karkossa, I., Schmidt, C., Hoffmann, A., Hagemann, T., Rothe, K., Seifert, O., Anderegg, U., von Bergen�, M., Schubert, K. A., et al. (2022) · Cell Death and Disease · doi:10.1038/s41419-022-04507-3 · Cited by 58
Staines, K. A., Zhu, D., Farquharson, C., & MacRae, V. E. (2013) · Journal of Bone and Mineral Metabolism · doi:10.1007/s00774-013-0493-2 · Cited by 56
Berkovits, B. D., Wang, L., Guarnieri, P., & Wolgemuth, D. J. (2012) · Nucleic Acids Research · doi:10.1093/nar/gks342 · Cited by 58
Futrega, K., Atkinson, K., Lott, W. B., & Doran, M. R. (2017) · Tissue Engineering Part C Methods · doi:10.1089/ten.tec.2016.0329 · Cited by 60
“24 Bioconductor 25 packages lumi 26 and arrayQualityMetrics 27 software packages were used for quality control.”
Aguilar, C., Raina, J., Forêt, S., Hayward, D. C., Lapeyre, B., Bourne, D. G., & Miller, D. J. (2019) · BMC Genomics · doi:10.1186/s12864-019-5527-2 · Cited by 64
“The read count matrix was analysed in R (R Core Team 2014) using the package arrayQualityMetrics [33] to check for outliers, and was transformed (variance stabilizing transformation (VST)) to be visualized using a principal component analysis (PCA).”
MethodHerrmann, M., Babler, A., Moshkova, I., Gremse, F., Kiessling, F. M., Kusebauch, U., Nelea, V., Kramann, R., Moritz, R. L., McKee, M. D., et al. (2020) · PLoS ONE · doi:10.1371/journal.pone.0228503 · Cited by 56
“The quality of the microarrays was assessed using the ArrayQualityMetrics package [36].”
MethodSensing of HIV-1 Entry Triggers a Type I Interferon Response in Human Primary Macrophages
Decalf, J., Desdouits, M., Rodrigues, V., Gobert, F.-X., Gentili, M., Marques-Ladeira, S., Chamontin, C., Mougel, M., de Alencar, B. C., & Benaroch, P. (2017) · Journal of Virology · doi:10.1128/jvi.00147-17 · Cited by 60
“Quality control was performed using the arrayQualityMetrics package (52), and data were normalized with the robust multiarray average algorithm from the affy package (53).”
MethodNeuroevolution as a tool for microarray gene expression pattern identification in cancer research
Grisci, B. I., Feltes, B. C., & Dorn, M. (2018) · Journal of Biomedical Informatics · doi:10.1016/j.jbi.2018.11.013 · Cited by 55
Systems level analysis of sex-dependent gene expression changes in Parkinson’s disease
Tranchevent, L.-C., Halder, R., & Glaab, E. (2023) · npj Parkinson s Disease · doi:10.1038/s41531-023-00446-8 · Cited by 79
Barry, C. T., D’Souza, M., McCall, M. N., Safadjou, S., Ryan, C., Kashyap, R., Marroquin, C. E., Orloff, M., Almudevar, A., & Godfrey, T. E. (2011) · American Journal of Transplantation · doi:10.1111/j.1600-6143.2011.03788.x · Cited by 53
“Array quality was assessed using a suite of widely used quality measures (25).”
Method
Metadata
- Authors
- Kauffmann, A., Gentleman, R., & Huber, W.
- Affiliations
- European Bioinformatics Institute (GB)
- Corresponding author
- Kauffmann, Audrey
- Venue
- Bioinformatics
- Publisher
- Oxford University Press (OUP)
- Published
- 2008-12-23
- Volume
- 25
- Issue
- 3
- Pages
- 415-416
- ISSN
- 1367-4803 (ISSN-L)
- 1367-4811
- PMC
- PMC2639074
- OpenAlex
- W2159096710
- Cited by
- 946
- References
- 11
- Citations by year
- 2026: 25 · 2025: 43 · 2024: 37 · 2023: 53 · 2022: 50 · 2021: 80 · 2020: 82 · 2019: 72 · 2018: 69 · 2017: 74 · 2016: 75 · 2015: 63 · 2014: 69 · 2013: 50 · 2012: 47
- FWCI
- 7.81
- Type
- journal article
- Language
- en
- Open access
- hybrid
- doi.org
- Licence
- Locations
- Bioinformatics (publishedVersion, cc-by-nc)
- PubMed Central (publishedVersion, cc-by-nc)
- PubMed (publishedVersion)
- Funders
- National Computational Infrastructure
- Australian Government
- Cancer Australia
- South Australian Research and Development Institute
- National Human Genome Research Institute (P41HG004059)
- Topics
- Life Sciences › Biochemistry, Genetics and Molecular Biology › Molecular Biology › Gene expression and cancer classification
- Life Sciences › Biochemistry, Genetics and Molecular Biology › Molecular Biology › Genomics and Phylogenetic Studies
- Life Sciences › Biochemistry, Genetics and Molecular Biology › Molecular Biology › Bioinformatics and Genomic Networks
- Keywords
- Bioconductor package, two-color microarrays, signal-to-noise ratio, reproducibility, automated reporting, diagnostic plots
- MeSH terms
- Algorithms, Data Interpretation, Statistical, Quality Control, Software, Computational Biology, Internet, Oligonucleotide Array Sequence Analysis
About these checks
Registry, retraction, Cites and statistics results are computed, not judged, with one exception: a printed reference that no index lists is read once by a model before it counts as a citation error. Claims are extracted by a model and kept only when their quote appears verbatim in the text; each cited source is then checked, with a model’s help, for whether it says what the claim relies on. Those verdicts can be wrong — read the claim’s quote and the cited source before relying on one.
Statistics and arithmetic are recomputed, not judged.
Confidence bands are shown only for fields calibrated on our annotated test set. None is calibrated yet, so no band is shown.
What counts as a claim ›How we measure confidence ›How we check this ›
Are you an author, or do you see a problem with this page? Request a review
Data sources
Bibliographic data: Semantic Scholar, OpenAlex, Crossref.
Contains information from the Semantic Scholar Academic Graph Datasets, made available under the ODC Attribution License (ODC-BY 1.0).
Semantic Scholar’s data is described in: Kinney, R., et al. (2023). The Semantic Scholar Open Data Platform. arXiv:2301.10140.
