

Reconstructing gene regulatory dynamics from high-dimensional single-cell snapshot data
Open accessThe DOI matches its Crossref record; 37 of the 37 references it cites were found in a registry or an index.
Abstract
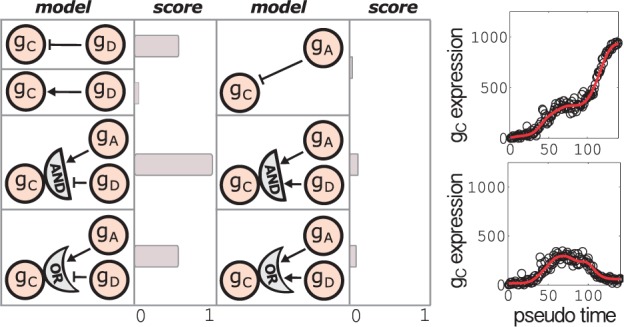
Motivation: High-dimensional single-cell snapshot data are becoming widespread in the systems biology community, as a mean to understand biological processes at the cellular level. However, as temporal information is lost with such data, mathematical models have been limited to capture only static features of the underlying cellular mechanisms. Results: Here, we present a modular framework which allows to recover the temporal behaviour from single-cell snapshot data and reverse engineer the dynamics of gene expression. The framework combines a dimensionality reduction method with a cell time-ordering algorithm to generate pseudo time-series observations. These are in turn used to learn transcriptional ODE models and do model selection on structural network features. We apply it on synthetic data and then on real hematopoietic stem cells data, to reconstruct gene expression dynamics during differentiation pathways and infer the structure of a key gene regulatory network. Availability and implementation: C++ and Matlab code available at https://www.helmholtz-muenchen.de/fileadmin/ICB/software/inferenceSnapshot.zip. Contact: fabian.theis@helmholtz-muenchen.de Supplementary information: Supplementary data are available at Bioinformatics online.
Overview
The claims and statistics of this paper haven’t been checked yet.
Free: it reads the open-access text and checks the first 5 claims that cite a source we can check. Create a free account to check every claim.
Integrity signals
Registry
Cites
Statistics
Figures




Verification
Claims the paper makes
The claims and statistics of this paper haven’t been checked yet.
Free: it reads the open-access text and checks the first 5 claims that cite a source we can check. Create a free account to check every claim.
Claims other papers make about this one
Each is checked against this paper’s own text: does it say what the citing paper says it does?
The cited source says what the claim attributes to it.
In the citing paper
“Indeed, several single‐cell GRN inference methods use trajectories with mechanistic differential equation models (Ocone et al, 2015; Matsumoto et al, 2017).”
From Current best practices in single-cell RNA-seq analysis: a tutorial (2019) · cites this paper as Ocone et al, 2015
In the citing paper
“A special category within these is the ODE models, which reconstruct expression profiles over time to detect and merge similar profiles.”
From Mapping gene regulatory networks from single-cell omics data (2018) · cites this paper as [46]
Self-check
Percentages, sums and reported differences re-computed from the paper’s own numbers.
The self-check needs the paper’s full text.
Citations
Cites
Jeffreys, H., Moran, P. A. P., & Chatfield, C. (1922) · Nature · doi:10.1093/oso/9780198503682.001.0001 · Cited by 7,878
Trapnell, C., Cacchiarelli, D., Grimsby, J., Pokharel, P., Li, S., Morse, M., Lennon, N. J., Livak, K. J., Mikkelsen, T. S., & Rinn, J. L. (2014) · Nature Biotechnology · doi:10.1038/nbt.2859 · Cited by 7,314
Stochastic Gene Expression in a Single Cell
Elowitz, M. B., Levine, A. J., Siggia, E. D., & Swain, P. S. (2002) · Science · doi:10.1126/science.1070919 · Cited by 5,441
Construction of a genetic toggle switch in Escherichia coli
Gardner, T. S., Cantor, C. R., & Collins, J. J. (2000) · Nature · doi:10.1038/35002131 · Cited by 4,268
An Introduction to Systems Biology: Design Principles of Biological Circuits
Alon, U. (2006) · doi:10.1201/9781420011432 · Cited by 2,825
Hematopoiesis: An Evolving Paradigm for Stem Cell Biology
Orkin, S. H., & Zon, L. I. (2008) · Cell · doi:10.1016/j.cell.2008.01.025 · Cited by 2,570
Inferring Regulatory Networks from Expression Data Using Tree-Based Methods
Huynh-Thu, V. A., Irrthum, A., Wehenkel, L., & Geurts, P. (2010) · PLoS ONE · doi:10.1371/journal.pone.0012776 · Cited by 2,131
Advances in Neural Information Processing Systems 18
Murray, I., Mackay, D., Zoubin Ghahramani, A., & Skilling, J. (2006) · Cited by 1,927
Coifman, R. R., Lafon, S., Lee, A. B., Maggioni, M., Nadler, B., Warner, F., & Zucker, S. W. (2005) · Proceedings of the National Academy of Sciences · doi:10.1073/pnas.0500334102 · Cited by 1,675 · cited 2×
“Here, we use a nonlinear method, known as diffusion map (Coifman et al. , 2005), which represents the probabilistic version of spectral clustering techniques (Nadler et al. , 2005).”
Amir, E.-A. D., Davis, K. L., Tadmor, M. D., Simonds, E. F., Levine, J. H., Bendall, S. C., Shenfeld, D. K., Krishnaswamy, S., Nolan, G. P., & Pe'er, D. (2013) · Nature Biotechnology · doi:10.1038/nbt.2594 · Cited by 1,550
JEFFREYS, H. (1922) · Nature · doi:10.1038/109132a0 · Cited by 1,217
Bendall, S. C., Davis, K. L., Amir, E.-A. D., Tadmor, M. D., Simonds, E. F., Chen, T. J., Shenfeld, D. K., Nolan, G. P., & Pe’er, D. (2014) · Cell · doi:10.1016/j.cell.2014.04.005 · Cited by 906 · cited 6×
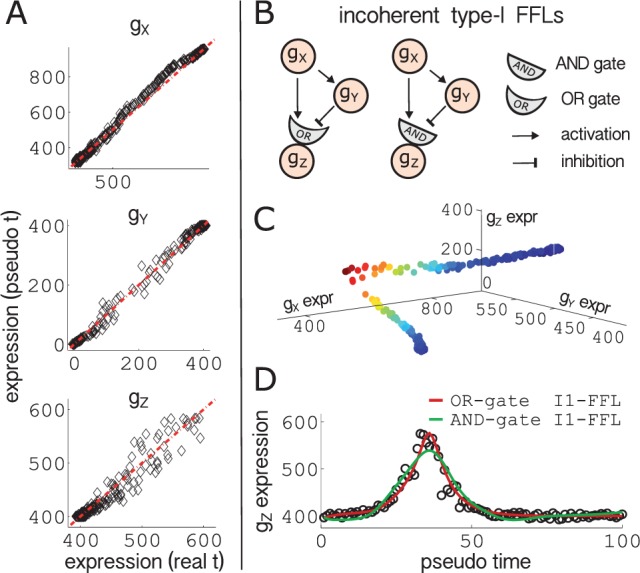
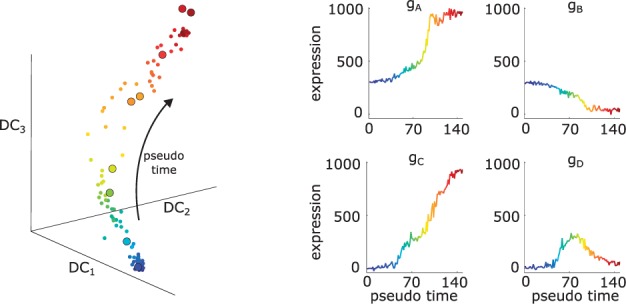
“The first is a combination of a dimensionality reduction method [i.e. diffusion map algorithm (Coifman et al. , 2005)] ( B ), clustering ( C ) and cell time-ordering [i.e. Wanderlust algorithm (Bendall et al. , 2014)], which provides pseudo time-series (dynamic data) ( D ).”
InfluentialBayesian analysis of computer code outputs: A tutorial
O’Hagan, A. (2006) · Reliability Engineering & System Safety · doi:10.1016/j.ress.2005.11.025 · Cited by 755
Hahn, C. N., Chong, C.-E., Carmichael, C. L., Wilkins, E. J., Brautigan, P. J., Li, X.-C., Babic, M., Lin, M., Carmagnac, A., Lee, Y. K., et al. (2011) · Nature Genetics · doi:10.1038/ng.913 · Cited by 606
Stochastic modelling for quantitative description of heterogeneous biological systems
Wilkinson, D. J. (2009) · Nature Reviews Genetics · doi:10.1038/nrg2509 · Cited by 574 · cited 1×
“Different classes of approaches have been proposed, from ODE-based models (Honkela et al ., 2010; Sanguinetti et al. , 2009) to stochastic models (Wilkinson, 2009), and a number of optimization techniques have been developed for inference and parameter estimation in gene regulatory models (Liepe et…”
Moignard, V., Woodhouse, S., Haghverdi, L., Lilly, A. J., Tanaka, Y., Wilkinson, A. C., Buettner, F., Macaulay, I. C., Jawaid, W., Diamanti, E., et al. (2015) · Nature Biotechnology · doi:10.1038/nbt.3154 · Cited by 380
Self-citationPtashne, M., & Gann, A. A. F. (2001) · Cold Spring Harbor Laboratory Institutional Repository (Cold Spring Harbor Laboratory) · Cited by 356
The Incoherent Feed-forward Loop Accelerates the Response-time of the gal System of Escherichia coli
Mangan, S., Itzkovitz, S., Zaslaver, A., & Alon, U. (2006) · Journal of Molecular Biology · doi:10.1016/j.jmb.2005.12.003 · Cited by 323
Diffusion Maps, Spectral Clustering and Eigenfunctions of Fokker-Planck operators
Nadler, B., Lafon, S., Coifman, R. R., & Kevrekidis, I. G. (2005) · arXiv (Cornell University) · doi:10.48550/arxiv.math/0506090 · Cited by 294
Fast, accurate reconstruction of cell lineages from large-scale fluorescence microscopy data
Amat, F., Lemon, W., Mossing, D. P., McDole, K., Wan, Y., Branson, K., Myers, E. W., & Keller, P. J. (2014) · Nature Methods · doi:10.1038/nmeth.3036 · Cited by 290
Signal-dependent dynamics of transcription factor translocation controls gene expression
Hao, N., & O'Shea, E. K. (2012) · Nature Structural & Molecular Biology · doi:10.1038/nsmb.2192 · Cited by 278 · cited 2×
“:3) ð j ; h Þ are parameters of a nonlinear Hill-type function f ð x ð t Þ ; h Þ (Hao and O’Shea, 2011), where j and h are dissociation constant and Hill coefficient, respectively.”
Moignard, V., Macaulay, I. C., Swiers, G., Buettner, F., Schütte, J., Calero-Nieto, F. J., Kinston, S., Joshi, A., Hannah, R., Theis, F. J., et al. (2013) · Nature Cell Biology · doi:10.1038/ncb2709 · Cited by 268
Self-citationThe Use of Induced Pluripotent Stem Cells in Drug Development
Inoue, H., & Yamanaka, S. (2011) · Clinical Pharmacology & Therapeutics · doi:10.1038/clpt.2011.38 · Cited by 221 · cited 1×
“Understanding stem cell differentiation is fundamental for advances in cell reprogramming research, with potentially practical applications in regenerative medicine and drug development (Cherry and Daley, 2012; Inoue and Yamanaka, 2011).”
Liepe, J., Kirk, P., Filippi, S., Toni, T., Barnes, C. P., & Stumpf, M. P. H. (2014) · Nature Protocols · doi:10.1038/nprot.2014.025 · Cited by 217
Reprogramming Cellular Identity for Regenerative Medicine
Cherry, A. B. C., & Daley, G. Q. (2012) · Cell · doi:10.1016/j.cell.2012.02.031 · Cited by 191 · cited 1×
“Understanding stem cell differentiation is fundamental for advances in cell reprogramming research, with potentially practical applications in regenerative medicine and drug development (Cherry and Daley, 2012; Inoue and Yamanaka, 2011).”
Comprehensive qPCR profiling of gene expression in single neuronal cells
Citri, A., Pang, Z. P., Südhof, T. C., Wernig, M., & Malenka, R. C. (2012) · Nature Protocols · doi:10.1038/nprot.2011.430 · Cited by 171 · cited 1×
“However, as recent advances in single-cell technologies offer the possibility to analyse gene expression simultaneously in hundreds of individual cells (Citri et al. , 2012), time-course data are not always available for massive single-cell dataset.”
Estimating Bayes factors via thermodynamic integration and population MCMC
Calderhead, B., & Girolami, M. (2009) · Computational Statistics & Data Analysis · doi:10.1016/j.csda.2009.07.025 · Cited by 169 · cited 1×
“In addition to more simple statistics as Akaike (AIC) and Bayesian information criterions (BIC), we do Bayesian model comparison by computing Bayes’ factors through thermodynamic integration (Calderhead and Girolami, 2009).”
Bistable switches control memory and plasticity in cellular differentiation
Wang, L., Walker, B. L., Iannaccone, S., Bhatt, D., Kennedy, P. J., & Tse, W. T. (2009) · Proceedings of the National Academy of Sciences · doi:10.1073/pnas.0806137106 · Cited by 122
Model-based method for transcription factor target identification with limited data
Honkela, A., Girardot, C., Gustafson, E. H., Liu, Y.-H., Furlong, E. E. M., Lawrence, N. D., & Rattray, M. (2010) · Proceedings of the National Academy of Sciences · doi:10.1073/pnas.0914285107 · Cited by 104
Causal network inference using biochemical kinetics
Oates, C. J., Dondelinger, F., Bayani, N., Korkola, J. E., Gray, J. W., & Mukherjee, S. (2014) · Bioinformatics · doi:10.1093/bioinformatics/btu452 · Cited by 72
Model Selection in Systems Biology Depends on Experimental Design
Silk, D., Kirk, P. D. W., Barnes, C. P., Toni, T., & Stumpf, M. P. H. (2014) · PLoS Computational Biology · doi:10.1371/journal.pcbi.1003650 · Cited by 66 · cited 1×
“Understanding stem cell differentiation is fundamental for advances in cell reprogramming research, with potentially practical applications in regenerative medicine and drug development (Cherry and Daley, 2012; Inoue and Yamanaka, 2011).”
Markov chain Monte Carlo inference for Markov jump processes via the linear noise approximation
Stathopoulos, V., & Girolami, M. (2013) · Philosophical Transactions of the Royal Society A Mathematical Physical and Engineering Sciences · doi:10.1098/rsta.2011.0541 · Cited by 48 · cited 1×
“…models (Honkela et al ., 2010; Sanguinetti et al. , 2009) to stochastic models (Wilkinson, 2009), and a number of optimization techniques have been developed for inference and parameter estimation in gene regulatory models (Liepe et al ., 2014; Ocone et al ., 2013; Stathopoulos and Girolami, 2012).”
Hybrid regulatory models: a statistically tractable approach to model regulatory network dynamics
Ocone, A., Millar, A. J., & Sanguinetti, G. (2013) · Bioinformatics · doi:10.1093/bioinformatics/btt069 · Cited by 45
Self-citationSwitching regulatory models of cellular stress response
Sanguinetti, G., Ruttor, A., Opper, M., & Archambeau, C. (2009) · Bioinformatics · doi:10.1093/bioinformatics/btp138 · Cited by 34
Reconstructing transcription factor activities in hierarchical transcription network motifs
Ocone, A., & Sanguinetti, G. (2011) · Bioinformatics · doi:10.1093/bioinformatics/btr487 · Cited by 16 · cited 2×
“FFLs are three-gene networks which have been of large interest in the recent literature (Alon, 2006; Ocone and Sanguinetti, 2011).”
Self-citationA subsystems approach for parameter estimation of ODE models of hybrid systems
Georgoulas, A., Clark, A., Ocone, A., Gilmore, S., & Sanguinetti, G. (2012) · Electronic Proceedings in Theoretical Computer Science · doi:10.4204/eptcs.92.3 · Cited by 10
Self-citationCausal network inference using biochemical kineticsPreprint
Oates, C. J., Dondelinger, F., Bayani, N., et al. (2014) · arXiv (Cornell University) · doi:10.48550/arxiv.1406.0063 · Cited by 7
Research works printed but not linked: 1
- Jeffreys, 1961, Theory of Probability
Cited by
Current best practices in single-cell RNA-seq analysis: a tutorial
Luecken, M. D., & Theis, F. J. (2019) · Molecular Systems Biology · doi:10.15252/msb.20188746 · Cited by 2,231
Self-citationSingle-cell RNA sequencing technologies and bioinformatics pipelines
Hwang, B., Lee, J. H., & Bang, D. (2018) · Experimental & Molecular Medicine · doi:10.1038/s12276-018-0071-8 · Cited by 1,781
Recovering Gene Interactions from Single-Cell Data Using Data Diffusion
van Dijk, D., Sharma, R., Nainys, J., Yim, K., Kathail, P., Carr, A. J., Burdziak, C., Moon, K. R., Chaffer, C. L., Pattabiraman, D., et al. (2018) · Cell · doi:10.1016/j.cell.2018.05.061 · Cited by 1,829
Benchmarking algorithms for gene regulatory network inference from single-cell transcriptomic data
Pratapa, A., Jalihal, A. P., Law, J. N., Bharadwaj, A., & Murali, T. M. (2020) · Nature Methods · doi:10.1038/s41592-019-0690-6 · Cited by 792
A single-cell resolution map of mouse hematopoietic stem and progenitor cell differentiation
Nestorowa, S., Hamey, F. K., Pijuan Sala, B., Diamanti, E., Shepherd, M., Laurenti, E., Wilson, N. K., Kent, D. G., & Göttgens, B. (2016) · Blood · doi:10.1182/blood-2016-05-716480 · Cited by 768
Metadata
- Authors
- Ocone, A., Haghverdi, L., Mueller, N. S., & Theis, F. J.
- Affiliations
- Helmholtz Munich (DE)
- Corresponding author
- Theis, Fabian J.
- Venue
- Bioinformatics
- Publisher
- Oxford University Press (OUP)
- Published
- 2015-06-10
- Volume
- 31
- Issue
- 12
- Pages
- i89-i96
- ISSN
- 1367-4803 (ISSN-L)
- 1367-4811
- PMC
- PMC4765871
- OpenAlex
- W2125258701
- Cited by
- 155
- References
- 36
- Citations by year
- 2026: 7 · 2025: 6 · 2024: 12 · 2023: 16 · 2022: 11 · 2021: 8 · 2020: 20 · 2019: 22 · 2018: 17 · 2017: 19 · 2016: 14 · 2015: 3
- FWCI
- 7.67
- Type
- journal article
- Language
- en
- Open access
- hybrid
- doi.org
- Licence
- Locations
- Bioinformatics (publishedVersion, cc-by-nc)
- PubMed Central (publishedVersion, cc-by-nc)
- PubMed (publishedVersion)
- MDC Repository (Max-Delbrueck-Center for Molecular Medicine) (acceptedVersion)
- HighWire Press Open Archive (submittedVersion)
- Site cant be reached (submittedVersion, cc-by-nc)
- PuSH - Publication Server of Helmholtz Zentrum München (submittedVersion)
- Topics
- Life Sciences › Biochemistry, Genetics and Molecular Biology › Molecular Biology › Gene Regulatory Network Analysis
- Life Sciences › Biochemistry, Genetics and Molecular Biology › Molecular Biology › Single-cell and spatial transcriptomics
- Life Sciences › Biochemistry, Genetics and Molecular Biology › Molecular Biology › Gene expression and cancer classification
- Keywords
- gene regulatory network inference, gene expression dynamics, dimensionality reduction, model selection, hematopoietic stem cells, cell differentiation, temporal reconstruction
- MeSH terms
- Algorithms, Hematopoiesis, Hematopoietic Stem Cells, Kinetics, Models, Genetic, Gene Expression Profiling, Systems Biology, Gene Regulatory Networks, Single-Cell Analysis
About these checks
Registry, retraction, Cites and statistics results are computed, not judged, with one exception: a printed reference that no index lists is read once by a model before it counts as a citation error. Claims are extracted by a model and kept only when their quote appears verbatim in the text; each cited source is then checked, with a model’s help, for whether it says what the claim relies on. Those verdicts can be wrong — read the claim’s quote and the cited source before relying on one.
Statistics and arithmetic are recomputed, not judged.
Confidence bands are shown only for fields calibrated on our annotated test set. None is calibrated yet, so no band is shown.
What counts as a claim ›How we measure confidence ›How we check this ›
Are you an author, or do you see a problem with this page? Request a review
Data sources
Bibliographic data: Semantic Scholar, OpenAlex, Crossref.
Contains information from the Semantic Scholar Academic Graph Datasets, made available under the ODC Attribution License (ODC-BY 1.0).
Semantic Scholar’s data is described in: Kinney, R., et al. (2023). The Semantic Scholar Open Data Platform. arXiv:2301.10140.
