

The DOI matches its Crossref record; 51 of the 53 references it cites were found in a registry or an index.
Inferring Regulatory Networks from Expression Data Using Tree-Based Methods
Open accessAbstract
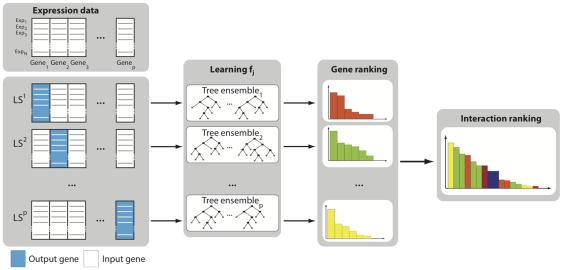
One of the pressing open problems of computational systems biology is the elucidation of the topology of genetic regulatory networks (GRNs) using high throughput genomic data, in particular microarray gene expression data. The Dialogue for Reverse Engineering Assessments and Methods (DREAM) challenge aims to evaluate the success of GRN inference algorithms on benchmarks of simulated data. In this article, we present GENIE3, a new algorithm for the inference of GRNs that was best performer in the DREAM4 In Silico Multifactorial challenge. GENIE3 decomposes the prediction of a regulatory network between p genes into p different regression problems. In each of the regression problems, the expression pattern of one of the genes (target gene) is predicted from the expression patterns of all the other genes (input genes), using tree-based ensemble methods Random Forests or Extra-Trees. The importance of an input gene in the prediction of the target gene expression pattern is taken as an indication of a putative regulatory link. Putative regulatory links are then aggregated over all genes to provide a ranking of interactions from which the whole network is reconstructed. In addition to performing well on the DREAM4 In Silico Multifactorial challenge simulated data, we show that GENIE3 compares favorably with existing algorithms to decipher the genetic regulatory network of Escherichia coli. It doesn't make any assumption about the nature of gene regulation, can deal with combinatorial and non-linear interactions, produces directed GRNs, and is fast and scalable. In conclusion, we propose a new algorithm for GRN inference that performs well on both synthetic and real gene expression data. The algorithm, based on feature selection with tree-based ensemble methods, is simple and generic, making it adaptable to other types of genomic data and interactions.
Overview
The claims and statistics of this paper haven’t been checked yet.
Run the check — free, no account needed. It reads the open-access text and checks the sources it cites.
Integrity signals
Registry
Cites
Statistics
Figures
Verification
Claims the paper makes
The claims and statistics of this paper haven’t been checked yet.
Run the check — free, no account needed. It reads the open-access text and checks the sources it cites.
Claims other papers make about this one
Each is checked against this paper’s own text: does it say what the citing paper says it does?
The source backs part of the claim, not all of it — or backs it for a different population, condition or comparison.
In the citing paper
“A limitation of GENIE3 is that TF information is required for it to perform better than random chance [113].”
From Gene co-expression analysis for functional classification and gene–disease predictions (2017) · cites this paper as [113]
Experimental — accuracy not yet measuredThe cited source says what the claim attributes to it.
In the citing paper
“Because of this second constraint, we cannot use pre-existing GRN inference algorithms, such as GENIE3 and GRNboost (refs. 7,51).”
From Dissecting cell identity via network inference and in silico gene perturbation (2023) · cites this paper as [51]
The cited source says what the claim attributes to it.
In the citing paper
“A major family of methods in this category is based on co-expression analysis (reviewed in [32]), and has been broadly used on bulk gene expression data (e.g. GENIE3 [33] and WGCNA [34], see [27, 35] for benchmark comparisons).”
From Mapping gene regulatory networks from single-cell omics data (2018) · cites this paper as [33]
The cited source says what the claim attributes to it.
In the citing paper
“GENIE3 incorporates TF information to construct a regulatory network by determining the TF expression pattern that best explains the expression of each of their target genes.”
From Gene co-expression analysis for functional classification and gene–disease predictions (2017) · cites this paper as [113]
Self-check
Percentages, sums and reported differences re-computed from the paper’s own numbers.
The self-check needs the paper’s full text.
Citations
Cites
Breiman, L. (2001) · Machine Learning · doi:10.1023/a:1010933404324 · Cited by 133,538
Classification and Regression Trees.
Gordon, A. D., Breiman, L., Friedman, J. H., Olshen, R. A., & Stone, C. J. (1984) · Biometrics · doi:10.2307/2530946 · Cited by 23,522
Classification and Regression Trees.
Ryzin, J. V., Breiman, L., Friedman, J. H., Olshen, R. A., & Stone, C. J. (1986) · Journal of the American Statistical Association · doi:10.2307/2288003 · Cited by 20,825
Breiman, L. (1996) · Machine Learning · doi:10.1007/bf00058655 · Cited by 16,325
Cluster analysis and display of genome-wide expression patterns
Eisen, M. B., Spellman, P. T., Brown, P. O., & Botstein, D. (1998) · Proceedings of the National Academy of Sciences · doi:10.1073/pnas.95.25.14863 · Cited by 16,184 · cited 1×
“Models based on the statistical analysis of dependencies between expression patterns have an intermediate complexity, and have already been successfully applied to the inference of large GRNs. Early models used correlation coefficients between expression patterns of all pairs of genes to infer “coexpression networks””
MethodClassification And Regression Trees
Breiman, L., Friedman, J. H., Olshen, R. A., & Stone, C. J. (2017) · doi:10.1201/9781315139470 · Cited by 11,417
Geurts, P., Ernst, D., & Wehenkel, L. (2006) · Machine Learning · doi:10.1007/s10994-006-6226-1 · Cited by 9,300 · cited 2×
“Empirical validations in [32] have shown that these two values of K were near-optimal in terms of predictive accuracy on several problems.”
BackgroundMethodSelf-citationThe Origins of Order: Self-Organization and Selection in Evolution
Kauffman, S. A. (1993) · doi:10.1093/oso/9780195079517.001.0001 · Cited by 7,855
The origins of order; self organization and selection in evolution
(1994) · International Journal of Biochemistry · doi:10.1016/0020-711x(94)90119-8 · Cited by 6,649
A review of feature selection techniques in bioinformatics
Saeys, Y., Inza, I., & Larrañaga, P. (2007) · Bioinformatics · doi:10.1093/bioinformatics/btm344 · Cited by 5,244
Research works printed but not linked: 2
- TM Cover, 2006, Elements of Information Theory 2nd Edition
- J Schäfer, 2006, Reverse engineering genetic networks using the GeneNet package., R News 6/, 5, 50
Cited by
Scenic: single-cell regulatory network inference and clustering.
Aibar, S., González-Blas, C. B., Moerman, T., Huynh-Thu, V. A., Imrichova, H., Hulselmans, G., Rambow, F., Marine, J.-C., Geurts, P., Aerts, J., et al. (2017) · Nature Methods · doi:10.1038/nmeth.4463 · Cited by 6,520
Self-citationWisdom of crowds for robust gene network inference
The DREAM5 Consortium, Marbach, D., Costello, J. C., Küffner, R., Vega, N. M., Prill, R. J., Camacho, D. M., Allison, K. R., Kellis, M., Collins, J. J., et al. (2012) · Nature Methods · doi:10.1038/nmeth.2016 · Cited by 1,667
PanglaoDB: a web server for exploration of mouse and human single-cell RNA sequencing data
Franzén, O., Gan, L.-M., & Björkegren, J. L. M. (2019) · Database · doi:10.1093/database/baz046 · Cited by 1,551
Microbial co-occurrence relationships in the human microbiome
Faust, K., Sathirapongsasuti, J. F., Izard, J., Segata, N., Gevers, D., Raes, J., & Huttenhower, C. (2012) · PLoS Computational Biology · doi:10.1371/journal.pcbi.1002606 · Cited by 1,527
A scalable SCENIC workflow for single-cell gene regulatory network analysis
Van de Sande, B., Flerin, C., Davie, K., De Waegeneer, M., Hulselmans, G., Aibar, S., Seurinck, R., Saelens, W., Cannoodt, R., Rouchon, Q., et al. (2020) · Nature Protocols · doi:10.1038/s41596-020-0336-2 · Cited by 1,494
Metadata
- Authors
- Huynh-Thu, V. A., Irrthum, A., Wehenkel, L., & Geurts, P.
- Affiliations
- University of Liège (BE)
- Venue
- PLoS ONE
- Publisher
- Public Library of Science (PLoS)
- Published
- 2010-09-28
- Volume
- 5
- Issue
- 9
- Pages
- e12776
- ISSN
- 1932-6203 (ISSN-L)
- PMC
- PMC2946910
- OpenAlex
- W2076513103
- Cited by
- 2,131
- References
- 53
- Citations by year
- 2026: 237 · 2025: 273 · 2024: 274 · 2023: 241 · 2022: 225 · 2021: 194 · 2020: 146 · 2019: 120 · 2018: 95 · 2017: 79 · 2016: 59 · 2015: 63 · 2014: 53 · 2013: 36 · 2012: 25
- FWCI
- 9.24
- Type
- journal article
- Language
- en
- Open access
- gold
- doi.org
- Locations
- PLoS ONE (publishedVersion, cc-by)
- PubMed Central (publishedVersion, cc-by)
- PubMed (publishedVersion)
- RePEc: Research Papers in Economics (submittedVersion)
- DOAJ (DOAJ: Directory of Open Access Journals) (submittedVersion, cc-by-sa)
- Figshare (submittedVersion, cc-by)
- Open Repository and Bibliography (University of Liège) (submittedVersion)
- ORBi (University of Liège) (submittedVersion, other-oa)
- ORBi (University of Liège) (submittedVersion)
- Funders
- Fonds De La Recherche Scientifique - FNRS
- Fédération Wallonie-Bruxelles
- Topics
- Life Sciences › Biochemistry, Genetics and Molecular Biology › Molecular Biology › Gene Regulatory Network Analysis
- Life Sciences › Biochemistry, Genetics and Molecular Biology › Molecular Biology › Bioinformatics and Genomic Networks
- Life Sciences › Biochemistry, Genetics and Molecular Biology › Molecular Biology › Microbial Metabolic Engineering and Bioproduction
- Keywords
- GENIE3, random forest, extra trees, microarray gene expression, Escherichia coli, feature selection, network topology
- MeSH terms
- Algorithms, Escherichia coli, Gene Expression Regulation, Computational Biology, Oligonucleotide Array Sequence Analysis, Gene Regulatory Networks
About these checks
Registry, retraction, Cites and statistics results are computed, not judged, with one exception: a printed reference that no index lists is read once by a model before it counts as a citation error. Claims are extracted by a model and kept only when their quote appears verbatim in the text; each cited source is then checked, with a model’s help, for whether it says what the claim relies on. Those verdicts can be wrong — read the claim’s quote and the cited source before relying on one.
Statistics and arithmetic are recomputed, not judged.
Confidence bands are shown only for fields calibrated on our annotated test set. None is calibrated yet, so no band is shown.
What counts as a claim ›How we measure confidence ›How we check this ›
Are you an author, or do you see a problem with this page? Request a review
How to cite
Cite CoChat for the checks on this page, and the paper for its own findings.
- This page
- CoChat. (2026). Citation check: Inferring Regulatory Networks from Expression Data Using Tree-Based Methods. https://app.cochat.ai/papers/10.1371/journal.pone.0012776
- The paper
- Huynh-Thu, V. A., Irrthum, A., Wehenkel, L., & Geurts, P. (2010). Inferring Regulatory Networks from Expression Data Using Tree-Based Methods. PLoS ONE. https://doi.org/10.1371/journal.pone.0012776
Data sources
Bibliographic data: Semantic Scholar, OpenAlex, Crossref.
Contains information from the Semantic Scholar Academic Graph Datasets, made available under the ODC Attribution License (ODC-BY 1.0).
Semantic Scholar’s data is described in: Kinney, R., et al. (2023). The Semantic Scholar Open Data Platform. arXiv:2301.10140.
