

The DOI matches its Crossref record; 121 of the 121 references it cites were found in a registry or an index.
The Neonatal Connectome During Preterm Brain Development
Open accessAbstract
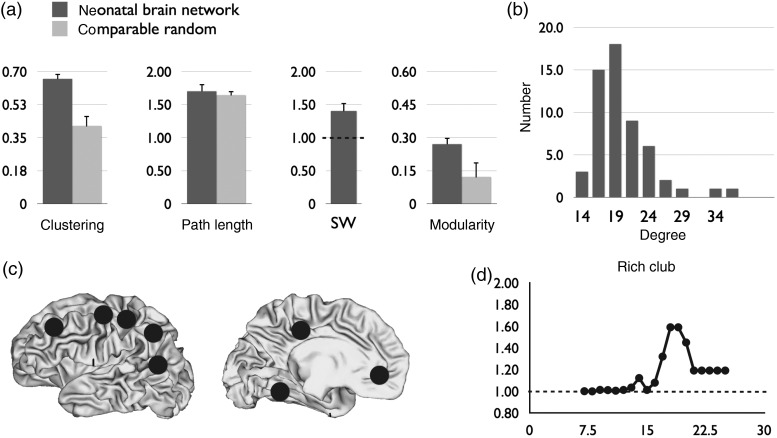
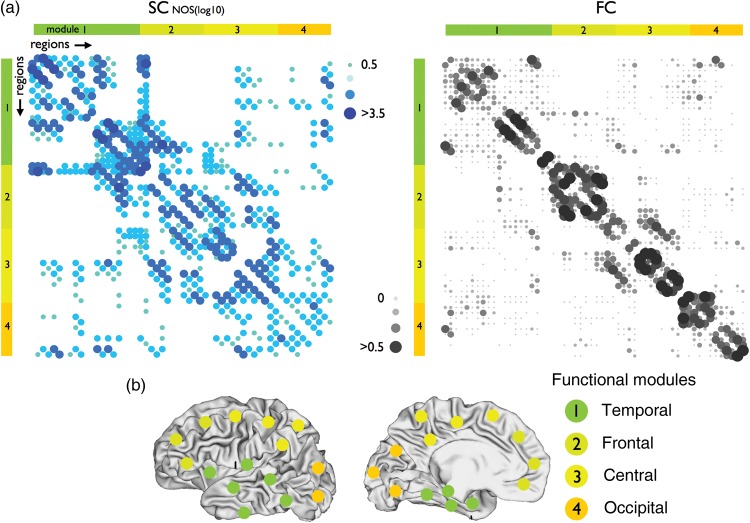
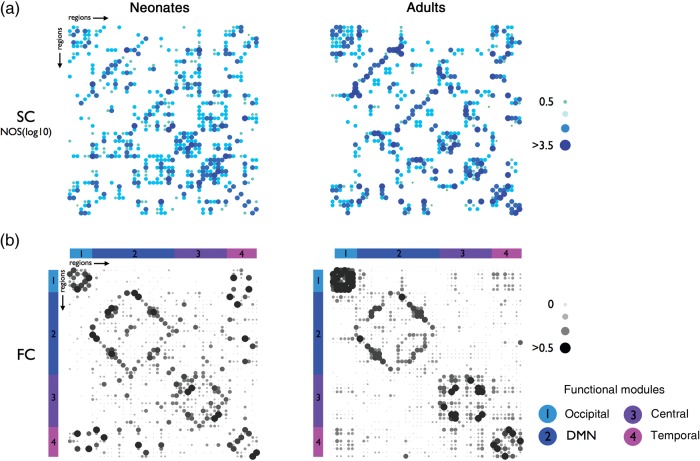
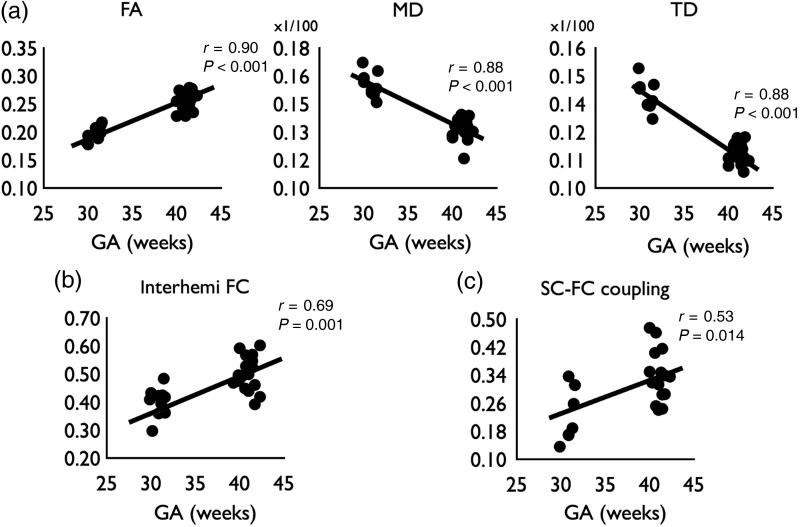
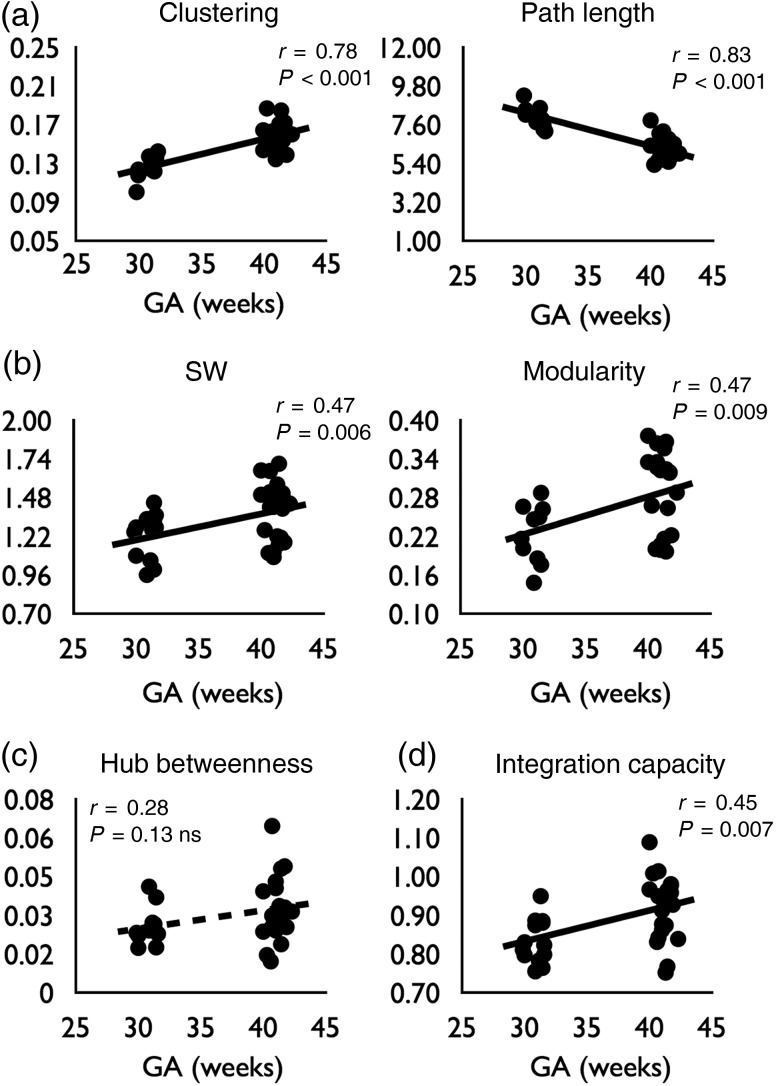
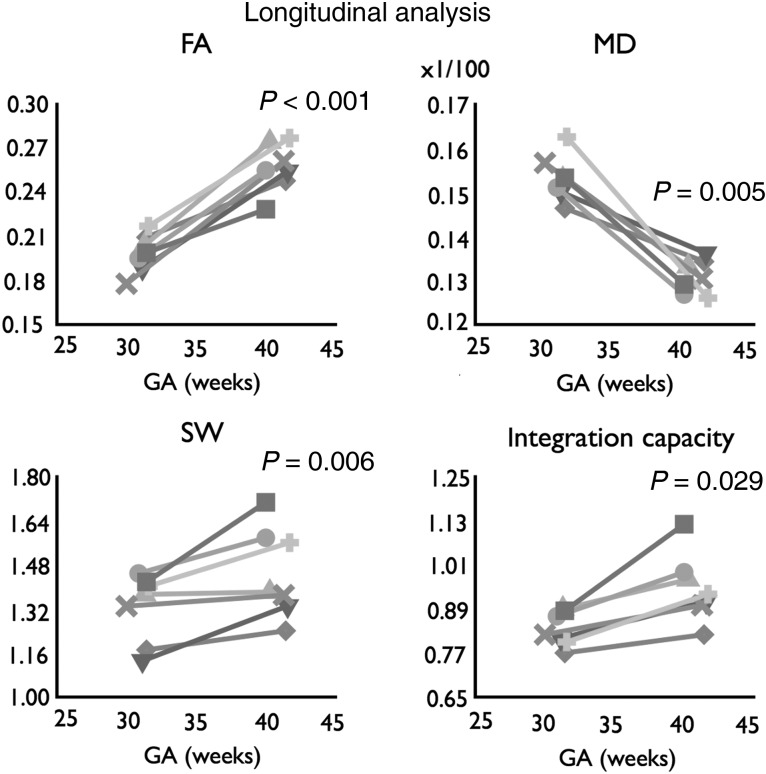
The human connectome is the result of an elaborate developmental trajectory. Acquiring diffusion-weighted imaging and resting-state fMRI, we studied connectome formation during the preterm phase of macroscopic connectome genesis. In total, 27 neonates were scanned at week 30 and/or week 40 gestational age (GA). Examining the architecture of the neonatal anatomical brain network revealed a clear presence of a small-world modular organization before term birth. Analysis of neonatal functional connectivity (FC) showed the early formation of resting-state networks, suggesting that functional networks are present in the preterm brain, albeit being in an immature state. Moreover, structural and FC patterns of the neonatal brain network showed strong overlap with connectome architecture of the adult brain (85 and 81%, respectively). Analysis of brain development between week 30 and week 40 GA revealed clear developmental effects in neonatal connectome architecture, including a significant increase in white matter microstructure (P < 0.01), small-world topology (P < 0.01) and interhemispheric FC (P < 0.01). Computational analysis further showed that developmental changes involved an increase in integration capacity of the connectivity network as a whole. Taken together, we conclude that hallmark organizational structures of the human connectome are present before term birth and subject to early development.
Overview
The claims and statistics of this paper haven’t been checked yet.
Run the check — free, no account needed. It reads the open-access text and checks the sources it cites.
Integrity signals
Registry
Cites
Statistics
Figures
Verification
Claims the paper makes
The claims and statistics of this paper haven’t been checked yet.
Run the check — free, no account needed. It reads the open-access text and checks the sources it cites.
Claims other papers make about this one
Each is checked against this paper’s own text: does it say what the citing paper says it does?
In the citing paper
“Overall, the white-matter connectome at birth is highly organized and includes hub regions and connections that are similar to those observed in adults48,49.”
From Imaging structural and functional brain development in early childhood (2018) · cites this paper as [49]
In the citing paper
“We identified four functionally meaningful modules consistent with the findings of van den Heuvel et al. 23.”
From Functional properties of resting state networks in healthy full-term newborns (2015) · cites this paper as [23]
Self-check
Percentages, sums and reported differences re-computed from the paper’s own numbers.
The self-check needs the paper’s full text.
Citations
Cites
Modularity and community structure in networks
Newman, M. E. J. (2006) · Proceedings of the National Academy of Sciences · doi:10.1073/pnas.0601602103 · Cited by 12,256
Complex brain networks: graph theoretical analysis of structural and functional systems
Bullmore, E., & Sporns, O. (2009) · Nature Reviews Neuroscience · doi:10.1038/nrn2575 · Cited by 11,820
Complex network measures of brain connectivity: Uses and interpretations
Rubinov, M., & Sporns, O. (2010) · NeuroImage · doi:10.1016/j.neuroimage.2009.10.003 · Cited by 11,522
Power, J. D., Barnes, K. A., Snyder, A. Z., Schlaggar, B. L., & Petersen, S. E. (2012) · NeuroImage · doi:10.1016/j.neuroimage.2011.10.018 · Cited by 7,429
Papile, L. A., Burstein, J., Burstein, R., & Koffler, H. (1978) · The Journal of Pediatrics · doi:10.1016/s0022-3476(78)80282-0 · Cited by 6,435
Consistent resting-state networks across healthy subjects
Damoiseaux, J. S., Rombouts, S. A. R. B., Barkhof, F., Scheltens, P., Stam, C. J., Smith, S. M., & Beckmann, C. F. (2006) · Proceedings of the National Academy of Sciences · doi:10.1073/pnas.0601417103 · Cited by 4,326
Mapping the structural core of human cerebral cortex
Hagmann, P., Cammoun, L., Gigandet, X., Meuli, R., Honey, C. J., Wedeen, V. J., & Sporns, O. (2008) · PLoS Biology · doi:10.1371/journal.pbio.0060159 · Cited by 4,173
Exploring the brain network: A review on resting-state fMRI functional connectivity
van den Heuvel, M. P., & Hulshoff Pol, H. E. (2010) · European Neuropsychopharmacology · doi:10.1016/j.euroneuro.2010.03.008 · Cited by 3,326
Predicting human resting-state functional connectivity from structural connectivity
Honey, C. J., Sporns, O., Cammoun, L., Gigandet, X., Thiran, J. P., Meuli, R., & Hagmann, P. (2009) · Proceedings of the National Academy of Sciences · doi:10.1073/pnas.0811168106 · Cited by 3,307
The Human Connectome: A Structural Description of the Human Brain
Sporns, O., Tononi, G., & Kötter, R. (2005) · PLoS Computational Biology · doi:10.1371/journal.pcbi.0010042 · Cited by 3,260
Cited by
Sorted by citations
Imaging structural and functional brain development in early childhood
Gilmore, J. H., Knickmeyer, R. C., & Gao, W. (2018) · Nature Reviews Neuroscience · doi:10.1038/nrn.2018.1 · Cited by 1,013
Grayson, D. S., & Fair, D. A. (2017) · NeuroImage · doi:10.1016/j.neuroimage.2017.01.079 · Cited by 411
“In neonates, two independent rs-fcMRI studies found evidence for modules comprised largely of anatomically proximate areas (De Asis-Cruz et al., 2015; van den Heuvel et al., 2015b).”
BackgroundResultInfluentialBaum, G. L., Ciric, R., Roalf, D. R., Betzel, R. F., Moore, T. M., Shinohara, R. T., Kahn, A. E., Vandekar, S. N., Rupert, P. E., Quarmley, M., et al. (2017) · Current Biology · doi:10.1016/j.cub.2017.04.051 · Cited by 401
Small-world human brain networks: Perspectives and challenges
Liao, X., Vasilakos, A. V., & Yong He, A. (2017) · Neuroscience & Biobehavioral Reviews · doi:10.1016/j.neubiorev.2017.03.018 · Cited by 443
The UNC/UMN Baby Connectome Project (BCP): An overview of the study design and protocol development
Howell, B., Styner, M. A., Gao, W., Yap, P., Wang, L., Baluyot, K., Yacoub, E. S., Chen, G., Potts, T., Salzwedel, A., et al. (2018) · NeuroImage · doi:10.1016/j.neuroimage.2018.03.049 · Cited by 452
van den Heuvel, M. P., Bullmore, E. T., & Sporns, O. (2016) · Trends in Cognitive Sciences · doi:10.1016/j.tics.2016.03.001 · Cited by 328
Segregated Systems of Human Brain Networks
Wig, G. S. (2017) · Trends in Cognitive Sciences · doi:10.1016/j.tics.2017.09.006 · Cited by 374
Zhang, F., Daducci, A., He, Y., Schiavi, S., Seguin, C., Smith, R. E., Yeh, C.-H., Zhao, T., & O’Donnell, L. J. (2022) · NeuroImage · doi:10.1016/j.neuroimage.2021.118870 · Cited by 302
“During prenatal development, the whole network becomes increasingly efficient and segregated with typical system-level refinements such as increased small-worldness [51] and increased modularity [463].”
Developmental connectomics from infancy through early childhood
Cao, M., Huang, H., & He, Y. (2017) · Trends in Neurosciences · doi:10.1016/j.tins.2017.06.003 · Cited by 284
Delineation of early brain development from fetuses to infants with diffusion MRI and beyond
Ouyang, M., Dubois, J., Yu, Q., Mukherjee, P., & Huang, H. (2018) · NeuroImage · doi:10.1016/j.neuroimage.2018.04.017 · Cited by 257
Neural histology and neurogenesis of the human fetal and infant brain
Kostović, I., Sedmak, G., & Judáš, M. (2018) · NeuroImage · doi:10.1016/j.neuroimage.2018.12.043 · Cited by 272
The development of brain network hubs
Oldham, S., & Fornito, A. (2018) · Developmental Cognitive Neuroscience · doi:10.1016/j.dcn.2018.12.005 · Cited by 257
Early development of structural networks and the impact of prematurity on brain connectivity
Batallé, D., Hughes, E., Zhang, H. G., Tournier, J., Tusor, N., Aljabar, P., Wali, L., Alexander, D. C., Hajnal, J. V., Nosarti, C., et al. (2017) · NeuroImage · doi:10.1016/j.neuroimage.2017.01.065 · Cited by 248
MRI of the Neonatal Brain: A Review of Methodological Challenges and Neuroscientific Advances
Dubois, J., Alison, M., Counsell, S. J., Hertz‐Pannier, L., Hüppi, P. S., & Benders, M. J. N. L. (2021) · Journal of Magnetic Resonance Imaging · doi:10.1002/jmri.27192 · Cited by 226
Self-citationZhao, T., Cao, M., Niu, H., Zuo, X., Evans, A., He, Y., Dong, Q., & Shu, N. (2015) · Human Brain Mapping · doi:10.1002/hbm.22877 · Cited by 209
The Developing Human Connectome Project: typical and disrupted perinatal functional connectivity
Eyre, M., Fitzgibbon, S. P., Ciarrusta, J., Cordero‐Grande, L., Price, A. N., Poppe, T., Schuh, A., Hughes, E., O’Keeffe, C., Brandon, J., et al. (2021) · Brain · doi:10.1093/brain/awab118 · Cited by 201
Scholtens, L. H., Schmidt, R., de Reus, M. A., & van den Heuvel, M. P. (2014) · The Journal of Neuroscience · doi:10.1523/jneurosci.0752-14.2014 · Cited by 160
The Visual Scoring of Sleep in Infants 0 to 2 Months of Age
Grigg-Damberger, M. M. (2016) · Journal of Clinical Sleep Medicine · doi:10.5664/jcsm.5600 · Cited by 180
Exploring early human brain development with structural and physiological neuroimaging
Vasung, L., Abaci Turk, E., Ferradal, S. L., Sutin, J., Stout, J. N., Ahtam, B., Lin, P.-Y., & Grant, P. E. (2019) · NeuroImage · doi:10.1016/j.neuroimage.2018.07.041 · Cited by 177
Cao, M., Yong He, A., Dai, Z., Liao, X., Jeon, T., Ouyang, M., Chalak, L. F., Bi, Y., Rollins, N. K., Dong, Q., et al. (2016) · Cerebral Cortex · doi:10.1093/cercor/bhw038 · Cited by 194
Functional Connectome of the Fetal Brain
Turk, E., van den Heuvel, M. I., Benders, M. J., de Heus, R., Franx, A., Manning, J. H., Hect, J. L., Hernandez-Andrade, E., Hassan, S. S., Romero, R., et al. (2019) · The Journal of Neuroscience · doi:10.1523/jneurosci.2891-18.2019 · Cited by 176
Self-citationThe emergence of functional architecture during early brain development
Keunen, K., Counsell, S. J., & Benders, M. J. N. L. (2017) · NeuroImage · doi:10.1016/j.neuroimage.2017.01.047 · Cited by 189
Self-citationEarly environment and long-term outcomes of preterm infants
Cheong, J. L. Y., Burnett, A., Treyvaud, K., & Spittle, A. J. (2019) · Journal of Neural Transmission · doi:10.1007/s00702-019-02121-w · Cited by 195
Specialization and integration of functional thalamocortical connectivity in the human infant
Toulmin, H., Beckmann, C. F., O’Muircheartaigh, J., Ball, G., Nongena, P., Makropoulos, A., Ederies, A., Counsell, S. J., Kennea, N. L., Arichi, T., et al. (2015) · Proceedings of the National Academy of Sciences · doi:10.1073/pnas.1422638112 · Cited by 177
Collin, G., Scholtens, L. H., Kahn, R. S., Hillegers, M. H. J., & van den Heuvel, M. P. (2017) · Biological Psychiatry · doi:10.1016/j.biopsych.2017.06.013 · Cited by 155
Self-citationToward Developmental Connectomics of the Human Brain
Cao, M., Huang, H., Peng, Y., Dong, Q., & Yong He, A. (2016) · Frontiers in Neuroanatomy · doi:10.3389/fnana.2016.00025 · Cited by 156
Schröter, M. S., Charlesworth, P., Kitzbichler, M. G., Paulsen, O., & Bullmore, E. T. (2015) · Journal of Neuroscience · doi:10.1523/jneurosci.4259-14.2015 · Cited by 149
Growth of Thalamocortical Fibers to the Somatosensory Cortex in the Human Fetal Brain
Krsnik, Ž., Majić, V., Vasung, L., Huang, H., & Kostović, I. (2017) · Frontiers in Neuroscience · doi:10.3389/fnins.2017.00233 · Cited by 130
Sex differences in functional connectivity during fetal brain development
Wheelock, M. D., Hect, J. L., Hernandez-Andrade, E., Hassan, S. S., Romero, R., Eggebrecht, A. T., & Thomason, M. E. (2019) · Developmental Cognitive Neuroscience · doi:10.1016/j.dcn.2019.100632 · Cited by 126
Early breast milk exposure modifies brain connectivity in preterm infants
Blesa, M., Sullivan, G., Anblagan, D., Telford, E. J., Quigley, A. J., Sparrow, S. A., Serag, A., Semple, S. I. K., Bastin, M. E., & Boardman, J. P. (2018) · NeuroImage · doi:10.1016/j.neuroimage.2018.09.045 · Cited by 124
Hierarchical functional system development supports executive function
Keller, A. S., Sydnor, V. J., Pines, A. R., Fair, D. A., Bassett, D. S., & Satterthwaite, T. D. (2022) · Trends in Cognitive Sciences · doi:10.1016/j.tics.2022.11.005 · Cited by 130
Emerson, R. W., Gao, W., & Lin, W. (2016) · The Journal of Neuroscience · doi:10.1523/jneurosci.3980-15.2016 · Cited by 112
An Embodied Brain Model of the Human Foetus
Yamada, Y., Kanazawa, H., Iwasaki, S., Tsukahara, Y., Iwata, O., Yamada, S., & Kuniyoshi, Y. (2016) · Scientific Reports · doi:10.1038/srep27893 · Cited by 116
Hubs in the human fetal brain network
van den Heuvel, M. I., Turk, E., Manning, J. H., Hect, J., Hernandez-Andrade, E., Hassan, S. S., Romero, R., van den Heuvel, M. P., & Thomason, M. E. (2018) · Developmental Cognitive Neuroscience · doi:10.1016/j.dcn.2018.02.001 · Cited by 108
“Furthermore, our observation of hubs in the fusiform gyrus was also observed in two other studies examining hubs in health term newborns [10] and preterm infants [13].”
InfluentialStraathof, M., Sinke, M. R. T., Dijkhuizen, R. M., & Otte, W. M. (2018) · Journal of Cerebral Blood Flow & Metabolism · doi:10.1177/0271678x18809547 · Cited by 109
Structural network analysis of brain development in young preterm neonates
Brown, C. J., Miller, S. P., Booth, B. G., Andrews, S., Chau, V., Poskitt, K. J., & Hamarneh, G. (2014) · NeuroImage · doi:10.1016/j.neuroimage.2014.07.030 · Cited by 103
Graph theoretical modeling of baby brain networks
Zhao, T., Xu, Y., & Yong He, A. (2018) · NeuroImage · doi:10.1016/j.neuroimage.2018.06.038 · Cited by 108
Early human brain development: Starring the subplate
Hadders-Algra, M. (2018) · Neuroscience & Biobehavioral Reviews · doi:10.1016/j.neubiorev.2018.06.017 · Cited by 100
The development of the nociceptive brain
Verriotis, M., Chang, P., Fitzgerald, M., & Lorenzo Fabrizi, D. (2016) · Neuroscience · doi:10.1016/j.neuroscience.2016.07.026 · Cited by 98
Mechanisms of Connectome Development
Kaiser, M. (2017) · Trends in Cognitive Sciences · doi:10.1016/j.tics.2017.05.010 · Cited by 99
Kostović, I. (2020) · Progress in Neurobiology · doi:10.1016/j.pneurobio.2020.101883 · Cited by 105
First-year development of modules and hubs in infant brain functional networks
Wen, X., Zhang, H., Li, G., Liu, M., Yin, W., Lin, W., Zhang, J., & Shen, D. G. (2018) · NeuroImage · doi:10.1016/j.neuroimage.2018.10.019 · Cited by 104
Bedside functional monitoring of the dynamic brain connectivity in human neonates
Baranger, J., Demené, C., Frérot, A., Faure, F., Delanöe, C., Serroune, H., Houdouin, A., Mairesse, J., Biran, V., Baud, O., et al. (2021) · Nature Communications · doi:10.1038/s41467-021-21387-x · Cited by 97
Transdiagnostic Brain Mapping in Developmental Disorders
Šiugždaitė, R., Bathelt, J., Holmes, J., & Astle, D. E. (2020) · Current Biology · doi:10.1016/j.cub.2020.01.078 · Cited by 100
Zimmermann, J., Ritter, P., Shen, K., Rothmeier, S., Schirner, M., & McIntosh, A. R. (2016) · Human Brain Mapping · doi:10.1002/hbm.23200 · Cited by 99
Yu, Q., Du, Y., Chen, J., Jing Sui (Beijing Normal University), my correct affiliation is beijing normal university, N. Q. U. O. S. A. T., Adalı, T., Pearlson, G. D., & Calhoun, V. D. (2018) · Proceedings of the IEEE · doi:10.1109/jproc.2018.2825200 · Cited by 96
Use of resting-state functional MRI to study brain development and injury in neonates
Smyser, C. D., & Neil, J. J. (2015) · Seminars in Perinatology · doi:10.1053/j.semperi.2015.01.006 · Cited by 95
Functional properties of resting state networks in healthy full-term newborns
De Asis-Cruz, J., Bouyssi-Kobar, M., Evangelou, I., Vezina, G., & Limperopoulos, C. (2015) · Scientific Reports · doi:10.1038/srep17755 · Cited by 85
Preterm birth alters neonatal, functional rich club organization
Scheinost, D., Kwon, S. H., Shen, X., Lacadie, C., Schneider, K. C., Dai, F., Ment, L. R., & Constable, R. T. (2015) · Brain Structure and Function · doi:10.1007/s00429-015-1096-6 · Cited by 91
Functional connectomics from a “big data” perspective
Xia, M., & Yong He, A. (2017) · NeuroImage · doi:10.1016/j.neuroimage.2017.02.031 · Cited by 85
Batallé, D., Edwards, A. D., & O’Muircheartaigh, J. (2017) · Journal of Child Psychology and Psychiatry · doi:10.1111/jcpp.12838 · Cited by 92
Neonatal brain injury and aberrant connectivity
Smyser, C. D., Wheelock, M. D., Limbrick, D. D., & Neil, J. J. (2018) · NeuroImage · doi:10.1016/j.neuroimage.2018.07.057 · Cited by 87
Pharmacotherapy for Neonatal Seizures: Current Knowledge and Future Perspectives
Donovan, M. D., Griffin, B. T., Kharoshankaya, L., Cryan, J. F., & Boylan, G. B. (2016) · Drugs · doi:10.1007/s40265-016-0554-7 · Cited by 82
Marami, B., Salehi, S. S. M., Afacan, O., Scherrer, B., Rollins, C. K., Yang, E., Estroff, J. A., Warfield, S. K., & Gholipour, A. (2017) · NeuroImage · doi:10.1016/j.neuroimage.2017.04.033 · Cited by 81
Linke, A. C., Jao Keehn, R. J., Pueschel, E. B., Fishman, I., & Müller, R.-A. (2018) · Developmental Cognitive Neuroscience · doi:10.1016/j.dcn.2017.01.007 · Cited by 88
Topological turning points across the human lifespan
Mousley, A., Bethlehem, R. A. I., Yeh, F.-C. F., & Astle, D. E. (2025) · Nature Communications · doi:10.1038/s41467-025-65974-8 · Cited by 105
Luo, A. C., Sydnor, V. J., Pines, A. R., Larsen, B., Alexander‐Bloch, A. F., Cieslak, M., Covitz, S. C., Chen, A. A., Esper, N. B., Feczko, E., et al. (2024) · Nature Communications · doi:10.1038/s41467-024-47748-w · Cited by 88
Cai, L., Dong, Q., & Niu, H. (2018) · Developmental Cognitive Neuroscience · doi:10.1016/j.dcn.2018.03.003 · Cited by 78
Rovelli, V., & Longo, N. (2023) · Molecular Genetics and Metabolism · doi:10.1016/j.ymgme.2023.107583 · Cited by 74
Human fetal brain connectome: structural network development from middle fetal stage to birth
Song, L., Mishra, V., Ouyang, M., Peng, Q., Slinger, M., Liu, S., & Huang, H. (2017) · Frontiers in Neuroscience · doi:10.3389/fnins.2017.00561 · Cited by 71
Rich-club in the brain’s macrostructure: Insights from graph theoretical analysis
Kim, D.-J., & Min, B.-K. (2020) · Computational and Structural Biotechnology Journal · doi:10.1016/j.csbj.2020.06.039 · Cited by 73
Early development of sleep and brain functional connectivity in term-born and preterm infants
Uchitel, J., Vanhatalo, S., & Austin, T. (2021) · Pediatric Research · doi:10.1038/s41390-021-01497-4 · Cited by 79
Kersbergen, K. J., Leemans, A., Groenendaal, F., van der Aa, N. E., Viergever, M. A., de Vries, L. S., & Benders, M. J. N. L. (2014) · NeuroImage · doi:10.1016/j.neuroimage.2014.09.039 · Cited by 70
Self-citationControversies in preterm brain injury
Penn, A. A., Gressèns, P., Fleiss, B., Back, S. A., & Gallo, V. (2015) · Neurobiology of Disease · doi:10.1016/j.nbd.2015.10.012 · Cited by 73
Development of Microstructural and Morphological Cortical Profiles in the Neonatal Brain
Fenchel, D., Dimitrova, R., Seidlitz, J., Robinson, E. C., Batalle, D., Hutter, J., Christiaens, D., Pietsch, M., Brandon, J., Hughes, E. J., et al. (2020) · Cerebral Cortex · doi:10.1093/cercor/bhaa150 · Cited by 71
Progress in Neonatal Neurology with a Focus on Neuroimaging in the Preterm Infant
Benders, M. J. N. L., Groenendaal, F., & de Vries, L. S. (2015) · Neuropediatrics · doi:10.1055/s-0035-1554102 · Cited by 71
Self-citationAdaptive mechanisms of developing brain: Cerebral lateralization in the prematurely-born
Kwon, S. H., Scheinost, D., Lacadie, C., Sze, G. K., Schneider, K. C., Dai, F., Constable, R. T., & Ment, L. R. (2014) · NeuroImage · doi:10.1016/j.neuroimage.2014.12.032 · Cited by 69
Asis‐Cruz, J. D., Donofrio, M. T., Vézina, G., & Limperopoulos, C. (2017) · NeuroImage Clinical · doi:10.1016/j.nicl.2017.09.020 · Cited by 73
Yang, S., Wagstyl, K., Meng, Y., Zhao, X., Li, J., Zhong, P., Li, B., Fan, Y., Chen, H., & Liao, W. (2021) · Cell Reports · doi:10.1016/j.celrep.2021.109582 · Cited by 68
Structural network maturation of the preterm human brain
Zhao, T., Mishra, V. R., Jeon, T., Ouyang, M., Peng, Q., Chalak, L. F., Wisnowski, J. L., Heyne, R. J., Rollins, N. K., Shu, N., et al. (2018) · NeuroImage · doi:10.1016/j.neuroimage.2018.06.047 · Cited by 69
Galdi, P., Blesa, M., Stoye, D. Q., Sullivan, G., Lamb, G. J., Quigley, A. J., Thrippleton, M. J., Bastin, M. E., & Boardman, J. P. (2020) · NeuroImage Clinical · doi:10.1016/j.nicl.2020.102195 · Cited by 68
White matter connectomes at birth accurately predict cognitive abilities at age 2
Girault, J. B., Munsell, B. C., Puechmaille, D., Goldman, B. D., Prieto, J. C., Styner, M. A., & Gilmore, J. H. (2019) · NeuroImage · doi:10.1016/j.neuroimage.2019.02.060 · Cited by 60
The development of brain network architecture
Wierenga, L. M., van den Heuvel, M. P., van Dijk, S., Rijks, Y., de Reus, M. A., & Durston, S. (2015) · Human Brain Mapping · doi:10.1002/hbm.23062 · Cited by 60
Bouyssi-Kobar, M., Asis‐Cruz, J. D., Murnick, J. G., Chang, T., & Limperopoulos, C. (2019) · The Journal of Pediatrics · doi:10.1016/j.jpeds.2019.06.030 · Cited by 63
de Almeida, J. S., Meskaldji, D. E., Loukas, S., Lordier, L., Gui, L., Lazeyras, F., & Hüppi, P. S. (2020) · NeuroImage · doi:10.1016/j.neuroimage.2020.117440 · Cited by 61
Claessens, N. H. P., Kelly, C. J., Counsell, S. J., & Benders, M. J. N. L. (2017) · Developmental Medicine & Child Neurology · doi:10.1111/dmcn.13461 · Cited by 59
Self-citationNetwork-specific selectivity of functional connections in the neonatal brain
Sylvester, C. M., Kaplan, S., Myers, M. J., Gordon, E. M., Schwarzlose, R. F., Alexopoulos, D. K., Nielsen, A. N., Kenley, J. K., Meyer, D., Yu, Q., et al. (2022) · Cerebral Cortex · doi:10.1093/cercor/bhac202 · Cited by 63
Topological organization of connectivity strength in the rat connectome
van den Heuvel, M. P., Scholtens, L. H., & de Reus, M. A. (2015) · Brain Structure and Function · doi:10.1007/s00429-015-0999-6 · Cited by 58
Xiao, Y., Friederici, A. D., Margulies, D. S., & Bräuer, J. (2015) · NeuroImage · doi:10.1016/j.neuroimage.2015.12.008 · Cited by 62
Pain Exposure and Brain Connectivity in Preterm Infants
Selvanathan, T., Ufkes, S., Guo, T., Chau, V., Branson, H. M., Ibrahim, G. M., Ly, L. G., Kelly, E. N., GRUNAU, R. E., & Miller, S. P. (2024) · JAMA Network Open · doi:10.1001/jamanetworkopen.2024.2551 · Cited by 55
Preterm Birth Changes Networks of Newborn Cortical Activity
Tokariev, A., Stjerna, S., Lano, A., Metsäranta, M., Palva, J. M., & Vanhatalo, S. (2019) · Cerebral Cortex · doi:10.1093/cercor/bhy012 · Cited by 53
Rich Club Organization and Cognitive Performance in Healthy Older Participants
Baggio, H. C., Segura, B., Junqué, C., de Reus, M. A., Sala‐Llonch, R., & van den Heuvel, M. P. (2015) · Journal of Cognitive Neuroscience · doi:10.1162/jocn_a_00821 · Cited by 54
Bergman, N., Ludwig, R. J., Westrup, B., & Welch, M. G. (2019) · Birth Defects Research · doi:10.1002/bdr2.1529 · Cited by 57
Kwon, S. H., Scheinost, D., Vohr, B. R., Lacadie, C., Schneider, K. C., Dai, F., Sze, G. K., Constable, R. T., & Ment, L. R. (2016) · Developmental Medicine & Child Neurology · doi:10.1111/dmcn.13043 · Cited by 51
Rommel, A., James, S., McLoughlin, G., Brandeis, D., Banaschewski, T., Asherson, P. J., & Kuntsi, J. (2016) · Journal of the American Academy of Child & Adolescent Psychiatry · doi:10.1016/j.jaac.2016.10.006 · Cited by 56
Development of Structural and Functional Connectivity
Dubois, J., Kostović, I., & Judas, M. (2015) · Elsevier eBooks · doi:10.1016/b978-0-12-397025-1.00360-2 · Cited by 55
Stjerna, S., Sairanen, V., Gröhn, R., Andersson, S., Metsäranta, M., Lano, A., & Vanhatalo, S. (2015) · Journal of Neuroscience · doi:10.1523/jneurosci.5162-14.2015 · Cited by 52
Xie, W., Mallin, B. M., & Richards, J. E. (2018) · Developmental Science · doi:10.1111/desc.12703 · Cited by 54
The Brain before Birth: Using fMRI to Explore the Secrets of Fetal Neurodevelopment
Konkel, L. (2018) · Environmental Health Perspectives · doi:10.1289/ehp2268 · Cited by 59
Social brain circuitry and social cognition in infants born preterm
Fenoglio, A., Georgieff, M., & Elison, J. T. (2017) · Journal of Neurodevelopmental Disorders · doi:10.1186/s11689-017-9206-9 · Cited by 72
Understanding Vulnerability and Adaptation in Early Brain Development using Network Neuroscience
Graham, A. M., Marr, M. C., Buß, C., Sullivan, E. L., & Fair, D. A. (2021) · Trends in Neurosciences · doi:10.1016/j.tins.2021.01.008 · Cited by 50
Typical and disrupted brain circuitry for conscious awareness in full-term and preterm infants
Hu, H., Cusack, R., & Naçi, L. (2022) · Brain Communications · doi:10.1093/braincomms/fcac071 · Cited by 51
Fetal development of functional thalamocortical and cortico–cortical connectivity
Taymourtash, A., Schwartz, E., Nenning, K., Sobotka, D., Licandro, R., Glatter, S., Diogo, M. C., Golland, P., Grant, P. E., Prayer, D., et al. (2022) · Cerebral Cortex · doi:10.1093/cercor/bhac446 · Cited by 47
Encoding of mechanical nociception differs in the adult and infant brain
Lorenzo Fabrizi, D., Verriotis, M., Williams, G., Lee, A. E., Meek, J. H., Olhede, S. C., & Fitzgerald, M. (2016) · Scientific Reports · doi:10.1038/srep28642 · Cited by 47
Linke, A. C., Wild, C. J., Zubiaurre‐Elorza, L., Herzmann, C., Duffy, H., Han, V. K. M., Lee, D. S. C., & Cusack, R. (2018) · NeuroImage Clinical · doi:10.1016/j.nicl.2018.02.002 · Cited by 48
Dubois, J., Adibpour, P., Poupon, C., Hertz-Pannier, L., & Dehaene-Lambertz, G. (2016) · Brain Plasticity · doi:10.3233/bpl-160031 · Cited by 40
Kipping, J., Tuan, T. A., Fortier, M. V., & Qiu, A. (2016) · Cerebral Cortex · doi:10.1093/cercor/bhw298 · Cited by 49
Using multiple short epochs optimises the stability of infant EEG connectivity parameters
Haartsen, R., van der Velde, B., Jones, E. J. H., Johnson, M. H., & Kemner, C. (2020) · Scientific Reports · doi:10.1038/s41598-020-68981-5 · Cited by 52
He, L., & Parikh, N. A. (2015) · Pediatric Neurology · doi:10.1016/j.pediatrneurol.2015.05.001 · Cited by 45
Ballester‐Plané, J., Schmidt, R., Laporta‐Hoyos, O., Junqué, C., Méndez, E. V., Delgado, I., Zubiaurre‐Elorza, L., Macaya, A., Póo, P., Tamargo, E. T., et al. (2017) · Human Brain Mapping · doi:10.1002/hbm.23686 · Cited by 47
Metadata
- Authors
- van den Heuvel, M. P., Kersbergen, K. J., de Reus, M. A., Keunen, K., Kahn, R. S., Groenendaal, F., de Vries, L. S., & Benders, M. J. N. L.
- Affiliations
- University Medical Center Utrecht (NL)
- Venue
- Cerebral Cortex
- Publisher
- Oxford University Press (OUP)
- Published
- 2014-05-15
- Volume
- 25
- Issue
- 9
- Pages
- 3000-3013
- ISSN
- 1047-3211 (ISSN-L)
- 1460-2199
- PMC
- PMC4537441
- OpenAlex
- W2133182819
- Cited by
- 386
- References
- 121
- Citations by year
- 2026: 17 · 2025: 32 · 2024: 29 · 2023: 25 · 2022: 31 · 2021: 37 · 2020: 62 · 2019: 28 · 2018: 38 · 2017: 34 · 2016: 24 · 2015: 20 · 2014: 7
- FWCI
- 15.67
- Type
- journal article
- Language
- en
- Open access
- green
- europepmc.org
- Licence
- cc-by-nc
- Locations
- Cerebral Cortex (publishedVersion)
- Europe PMC (PubMed Central) (publishedVersion, cc-by-nc)
- PubMed Central (publishedVersion, cc-by-nc)
- PubMed (publishedVersion)
- Pure Amsterdam UMC (publishedVersion, cc-by)
- Amsterdam UMC (VU Amsterdam) - Institutional Repository (publishedVersion, other-oa)
- Utrecht University Repository (Utrecht University) (submittedVersion, other-oa)
- Utrecht University Repository (Utrecht University) (submittedVersion)
- Data Archiving and Networked Services (DANS) (submittedVersion, other-oa)
- Funders
- Nederlandse Organisatie voor Wetenschappelijk Onderzoek
- Topics
- Life Sciences › Neuroscience › Cognitive Neuroscience › Functional Brain Connectivity Studies
- Health Sciences › Medicine › Radiology, Nuclear Medicine and Imaging › Advanced Neuroimaging Techniques and Applications
- Physical Sciences › Physics and Astronomy › Statistical and Nonlinear Physics › Complex Network Analysis Techniques
- Keywords
- small-world networks, resting-state functional connectivity, resting-state networks, white matter microstructure, interhemispheric functional connectivity, gestational age, diffusion-weighted imaging, resting-state fMRI
- MeSH terms
- Adult, Brain, Female, Gestational Age, Humans, Image Processing, Computer-Assisted, Infant, Newborn, Magnetic Resonance Imaging, Male, Neural Pathways, Oxygen, Diffusion Magnetic Resonance Imaging, Premature Birth, Young Adult, Connectome, White Matter
About these checks
Registry, retraction, Cites and statistics results are computed, not judged, with one exception: a printed reference that no index lists is read once by a model before it counts as a citation error. Claims are extracted by a model and kept only when their quote appears verbatim in the text; each cited source is then checked, with a model’s help, for whether it says what the claim relies on. Those verdicts can be wrong — read the claim’s quote and the cited source before relying on one.
Statistics and arithmetic are recomputed, not judged.
Confidence bands are shown only for fields calibrated on our annotated test set. None is calibrated yet, so no band is shown.
What counts as a claim ›How we measure confidence ›How we check this ›
Are you an author, or do you see a problem with this page? Request a review
