

Mendelian randomization with invalid instruments: effect estimation and bias detection through Egger regression
Open accessThe DOI matches its Crossref record; 50 of the 50 references it cites were found in a registry or an index.
Abstract
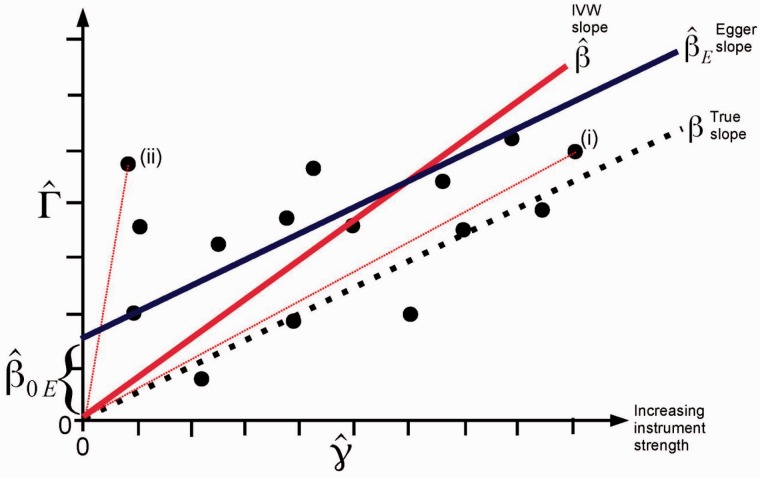
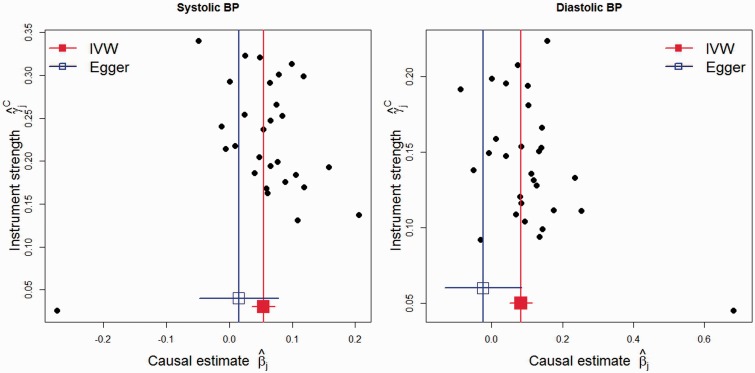
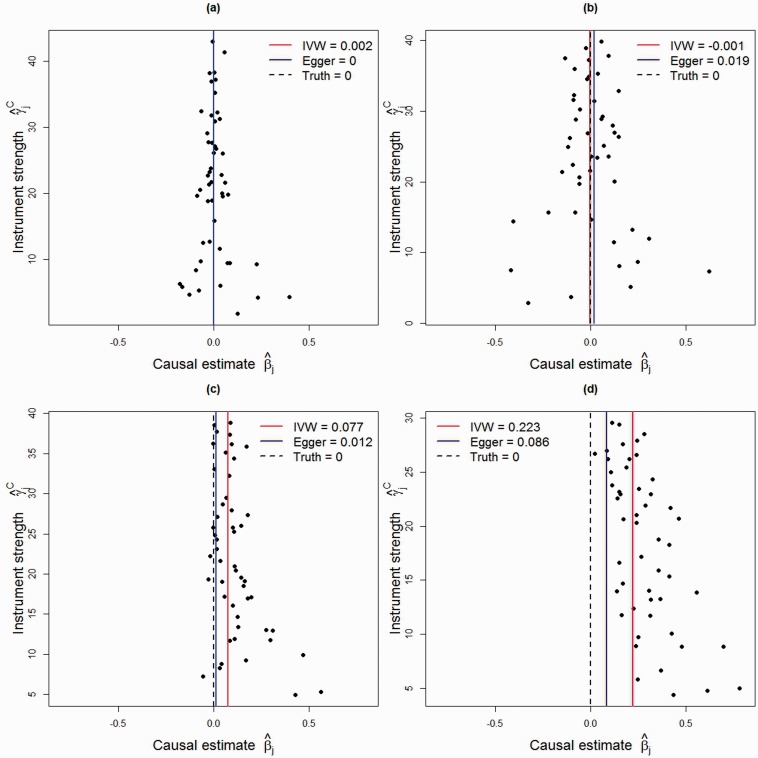
BACKGROUND: The number of Mendelian randomization analyses including large numbers of genetic variants is rapidly increasing. This is due to the proliferation of genome-wide association studies, and the desire to obtain more precise estimates of causal effects. However, some genetic variants may not be valid instrumental variables, in particular due to them having more than one proximal phenotypic correlate (pleiotropy). METHODS: We view Mendelian randomization with multiple instruments as a meta-analysis, and show that bias caused by pleiotropy can be regarded as analogous to small study bias. Causal estimates using each instrument can be displayed visually by a funnel plot to assess potential asymmetry. Egger regression, a tool to detect small study bias in meta-analysis, can be adapted to test for bias from pleiotropy, and the slope coefficient from Egger regression provides an estimate of the causal effect. Under the assumption that the association of each genetic variant with the exposure is independent of the pleiotropic effect of the variant (not via the exposure), Egger's test gives a valid test of the null causal hypothesis and a consistent causal effect estimate even when all the genetic variants are invalid instrumental variables. RESULTS: We illustrate the use of this approach by re-analysing two published Mendelian randomization studies of the causal effect of height on lung function, and the causal effect of blood pressure on coronary artery disease risk. The conservative nature of this approach is illustrated with these examples. CONCLUSIONS: An adaption of Egger regression (which we call MR-Egger) can detect some violations of the standard instrumental variable assumptions, and provide an effect estimate which is not subject to these violations. The approach provides a sensitivity analysis for the robustness of the findings from a Mendelian randomization investigation.
Overview
The claims and statistics of this paper haven’t been checked yet.
Free: it reads the open-access text and checks the first 5 claims that cite a source we can check. Create a free account to check every claim.
Integrity signals
Registry
Cites
Statistics
Figures


Verification
Claims the paper makes
The claims and statistics of this paper haven’t been checked yet.
Free: it reads the open-access text and checks the first 5 claims that cite a source we can check. Create a free account to check every claim.
Claims other papers make about this one
Each is checked against this paper’s own text: does it say what the citing paper says it does?
The cited source doesn’t support the claim as written.
In the citing paper
“These analyses showed no major deviations and did not change conclusions from the main instrumental variable findings.”
From Plasma levels of apolipoprotein E, APOE genotype, and all-cause and cause-specific mortality in 105 949 individuals from a white general population cohort (2019) · cites this paper as [67]
Checked by a reasoning model — may be wrong.
Experimental — accuracy not yet measuredThe source backs part of the claim, not all of it — or backs it for a different population, condition or comparison.
In the citing paper
“Similarly, violation of the ‘exclusion restriction criteria’33–37 could bias causal estimates in IV analyses when used to test effects of intermediates in RCTs or when used in observational data (including MR)”
From Triangulation in aetiological epidemiology (2017) · cites this paper as [36]
Experimental — accuracy not yet measuredThe source backs part of the claim, not all of it — or backs it for a different population, condition or comparison.
In the citing paper
“Furthermore the MR-Egger test, 9 which the authors used to test violation of the exclusion restriction criteria, cannot be used to differentiate effects of adult from child BMI, as Gao and colleagues acknowledge. This is because MR-Egger is only valid if the effect of the genetic instrument on the risk factor of interest is independent of its effect on any other phenotypes that might violate that”
From Commentary: Two-sample Mendelian randomization: opportunities and challenges (2016) · cites this paper as [9]
Experimental — accuracy not yet measuredThe source backs part of the claim, not all of it — or backs it for a different population, condition or comparison.
In the citing paper
“Egger MR was performed to determine the presence of unmeasured pleiotropy70.”
From Integrative genomic analyses identify candidate causal genes for calcific aortic valve stenosis involving tissue-specific regulation (2024) · cites this paper as [70]
Experimental — accuracy not yet measuredThe cited source says what the claim attributes to it.
In the citing paper
“Because MR is relatively novel there has been considerable focus on its limitations and methods for testing and dealing with these, in particular for dealing with violation of the exclusion restriction criteria due to genuine pleiotropy.36,37”
From Triangulation in aetiological epidemiology (2017) · cites this paper as [36]
8 more claims about this paper
Create a free account to see every claim other papers make about this one.
Self-check
Percentages, sums and reported differences re-computed from the paper’s own numbers.
The self-check needs the paper’s full text.
Citations
Cites
Measuring inconsistency in meta-analyses
Higgins, J. P. T., Thompson, S. G., Deeks, J. J., & Altman, D. G. (2003) · BMJ · doi:10.1136/bmj.327.7414.557 · Cited by 63,139
Bias in meta-analysis detected by a simple, graphical test
Egger, M., Smith, G. D., Schneider, M., & Minder, C. (1997) · BMJ · doi:10.1136/bmj.315.7109.629 · Cited by 56,722
Self-citationRegression shrinkage and selection via the lasso
Tibshirani, R. (1996) · Journal of the Royal Statistical Society Series B: Statistical Methodology · doi:10.1111/j.2517-6161.1996.tb02080.x · Cited by 51,482
Duval, S., & Tweedie, R. (2000) · Biometrics · doi:10.1111/j.0006-341x.2000.00455.x · Cited by 14,099
Borenstein, M., Hedges, L. V., Higgins, J. P. T., & Rothstein, H. R. (2021) · doi:10.1002/9781119558378 · Cited by 9,799
Sterne, J. A. C., Sutton, A. J., Ioannidis, J. P. A., Terrin, N., Jones, D. R., Lau, J., Carpenter, J., Rucker, G., Harbord, R. M., Schmid, C. H., et al. (2011) · BMJ · doi:10.1136/bmj.d4002 · Cited by 7,709 · cited 1×
“The general phenomenon is therefore prudently referred to under the umbrella term of ‘small study’ bias.(11,13,14) In the context of Mendelian randomization with multiple instruments, we equate the precision of a single study’s estimate with the strength of a single instrument.”
BackgroundInstrumental Variables Regression with Weak Instruments
Staiger, D., & Stock, J. H. (1997) · Econometrica · doi:10.2307/2171753 · Cited by 7,081
Mendelian Randomization Analysis With Multiple Genetic Variants Using Summarized Data
Burgess, S., Butterworth, A., & Thompson, S. G. (2013) · Genetic Epidemiology · doi:10.1002/gepi.21758 · Cited by 6,050 · cited 1×
“It has been shown that Mendelian randomization analyses based on summarized data are as efficient as those based on individual-level data.(23) Other tools from the meta-analysis literature include methods for bias adjustment, such as the trim-and-fill method,(45) and the use of pseudo-data.”
MethodSelf-citationDavey Smith, G., & Ebrahim, S. (2003) · International Journal of Epidemiology · doi:10.1093/ije/dyg070 · Cited by 5,882 · cited 2×
“We are particularly interested in the coverage properties of the estimators with a null causal effect, and the power of estimators with a positive causal effect, as salient findings from Mendelian randomization investigations are not only the magnitude of the causal effect—or indeed whether such can be estimated—but a…”
BackgroundInstrumental Variables Regression with Weak Instruments
Staiger, D., & Stock, J. (1994) · doi:10.3386/t0151 · Cited by 5,302 · cited 1×
“With many IVs in a one-sample setting (genetic variants, exposure and outcome measured in the same participants), IV estimates (particularly those from the TSLS method) are biased in the direction of the observational association between the exposure and the outcome.(49) This bias depends on the strength of the associ…”
Method
Research works printed but not linked: 12
- 2014, Human Molecular Genetics, 23, 89, 10.1093/hmg/ddu328 · DOI · Paper page
- 2010, Clinical Chemistry, 56, 723, 10.1373/clinchem.2009.141564 · DOI · Paper page
- 2015, International Journal of Epidemiology, 44, 496, 10.1093/ije/dyv071 · DOI · Paper page
- 2013, International Journal of Epidemiology, 42, 1157, 10.1093/ije/dyt110 · DOI · Paper page
- 2013, International Journal of Epidemiology, 42, 1497, 10.1093/ije/dyt179 · DOI · Paper page
- 2013, International Journal of Epidemiology, 42, 1134, 10.1093/ije/dyt093 · DOI · Paper page
- 2015, Statistics in medicine, 34, 454, 10.1002/sim.6358 · DOI · Paper page
- 2013, International Journal of Epidemiology, 42, 111, 10.1093/ije/dys064 · DOI · Paper page
- 2014, Economics and human biology, 13, 99, 10.1016/j.ehb.2013.12.002 · DOI · Paper page
- 2011, International Journal of Epidemiology, 40, 755, 10.1093/ije/dyr036 · DOI · Paper page
- 2013, American Journal of Epidemiology, 178, 1177, 10.1093/aje/kwt084 · DOI · Paper page
- Angrist J Pischke J-S Instrumental variables in action: sometimes you get whatyou need. In: Mostly Harmless Econometrics: An Empiricist’scompanion. Princeton, NJ: Princeton University Press, 2009.
Cited by
Bowden, J., Davey Smith, G., Haycock, P. C., & Burgess, S. (2016) · Genetic Epidemiology · doi:10.1002/gepi.21965 · Cited by 8,922
“We explore the statistical properties of the weighted median estimator in a realistic simulation study, and compare with an alternative summary data analysis method also robust to some violations of the IV assumptions, MR-Egger regression (Bowden et al., 2015).”
BackgroundMethodInfluentialSelf-citationVerbanck, M., Chen, C.-Y., Neale, B., & Do, R. (2018) · Nature Genetics · doi:10.1038/s41588-018-0099-7 · Cited by 8,591
The MR-Base platform supports systematic causal inference across the human phenome
Hemani, G., Zheng, J., Elsworth, B., Wade, K. H., Haberland, V., Baird, D., Laurin, C., Burgess, S., Bowden, J., Langdon, R., et al. (2018) · eLife · doi:10.7554/elife.34408 · Cited by 7,959
“…constraint by allowing the intercept to pass through a value other than zero, returning an unbiased effect estimate if the instrument-exposure and pleiotropic effects are uncorrelated, also known as the InSIDE (Instrument Strength Independent of Direct Effect) assumption ( Bowden et al., 2015 ).”
BackgroundSelf-citationInterpreting findings from Mendelian randomization using the MR-Egger method.
Burgess, S., & Thompson, S. G. (2017) · European Journal of Epidemiology · doi:10.1007/s10654-017-0255-x · Cited by 4,571
“Rather than setting the intercept term to be zero, the term is estimated as part of the analysis [9]:”
MethodInfluentialSelf-citationReading Mendelian randomisation studies: a guide, glossary, and checklist for clinicians
Davies, N. M., Holmes, M. V., & Davey Smith, G. (2018) · BMJ · doi:10.1136/bmj.k601 · Cited by 4,404
Metadata
- Authors
- Bowden, J., Davey Smith, G., & Burgess, S.
- Affiliations
- University of Cambridge (GB)
- Corresponding author
- Bowden, J.
- Venue
- International Journal of Epidemiology
- Publisher
- Oxford University Press (OUP)
- Published
- 2015-04-01
- Volume
- 44
- Issue
- 2
- Pages
- 512-525
- ISSN
- 0300-5771 (ISSN-L)
- 1464-3685
- PMC
- PMC4469799
- OpenAlex
- W2113699335
- Cited by
- 9,816
- References
- 50
- Citations by year
- 2026: 937 · 2025: 1929 · 2024: 2977 · 2023: 1482 · 2022: 797 · 2021: 590 · 2020: 379 · 2019: 283 · 2018: 205 · 2017: 123 · 2016: 88 · 2015: 21
- FWCI
- 100.13
- Type
- journal article
- Language
- en
- Open access
- hybrid
- doi.org
- Licence
- cc-by
- Locations
- International Journal of Epidemiology (publishedVersion, cc-by)
- PubMed Central (publishedVersion, cc-by)
- PubMed (publishedVersion)
- Bristol Research (University of Bristol) (submittedVersion, cc-by)
- Apollo (University of Cambridge) (submittedVersion, cc-by)
- Explore Bristol Research (submittedVersion, cc-by)
- Funders
- Wellcome Trust (MC_UU_12013_8, 100114)
- National Institute for Health and Care Research (NF-SI-0512-10165)
- British Heart Foundation (SP/08/007/23628, RG/08/014/24067)
- University of Bristol (MC_UU_12013/2)
- Medical Research Council (MC_UU_12013_2, MC_UU_12013_5, MR/N501906/1, MC UU 12013/8, MR/L012286/1, MR/L003120/1)
- Topics
- Life Sciences › Biochemistry, Genetics and Molecular Biology › Genetics › Genetic Associations and Epidemiology
- Physical Sciences › Mathematics › Statistics and Probability › Advanced Causal Inference Techniques
- Social Sciences › Decision Sciences › Statistics, Probability and Uncertainty › Meta-analysis and systematic reviews
- Keywords
- Mendelian randomization, invalid instruments, pleiotropy, MR-Egger, small-study bias, multiple instruments, causal effect estimation, bias detection, sensitivity analysis
- MeSH terms
- Blood Pressure, Body Height, Coronary Artery Disease, Humans, Models, Biological, Regression Analysis, Respiration, Statistics as Topic, Genetic Variation, Meta-Analysis as Topic, Bias, Causality, Risk Assessment, Mendelian Randomization Analysis, Genetic Pleiotropy
About these checks
Registry, retraction, Cites and statistics results are computed, not judged, with one exception: a printed reference that no index lists is read once by a model before it counts as a citation error. Claims are extracted by a model and kept only when their quote appears verbatim in the text; each cited source is then checked, with a model’s help, for whether it says what the claim relies on. Those verdicts can be wrong — read the claim’s quote and the cited source before relying on one.
Statistics and arithmetic are recomputed, not judged.
Confidence bands are shown only for fields calibrated on our annotated test set. None is calibrated yet, so no band is shown.
What counts as a claim ›How we measure confidence ›How we check this ›
Are you an author, or do you see a problem with this page? Request a review
Data sources
Bibliographic data: Semantic Scholar, OpenAlex, Crossref.
Contains information from the Semantic Scholar Academic Graph Datasets, made available under the ODC Attribution License (ODC-BY 1.0).
Semantic Scholar’s data is described in: Kinney, R., et al. (2023). The Semantic Scholar Open Data Platform. arXiv:2301.10140.
