Cited by 21

The DOI matches its Crossref record; 1 of the 1 references it cites were found in a registry or an index.

CoolMPS: evaluation of antibody labeling based massively parallel non-coding RNA sequencing

Li, Yongping, Fehlmann, Tobias, Borcherding, Adam, Drmanac, Snezana, Liu, Sophie, Groeger, Laura, Xu, Chongjun, Callow, Matthew, Villarosa, Christian, Jorjorian, Alexander, Kern, Fabian, Grammes, Nadja, Meese, Eckart, Jiang, Hui, Drmanac, Radoje, Ludwig, Nicole, Keller, Andreas·2021·Nucleic Acids Research

Abstract

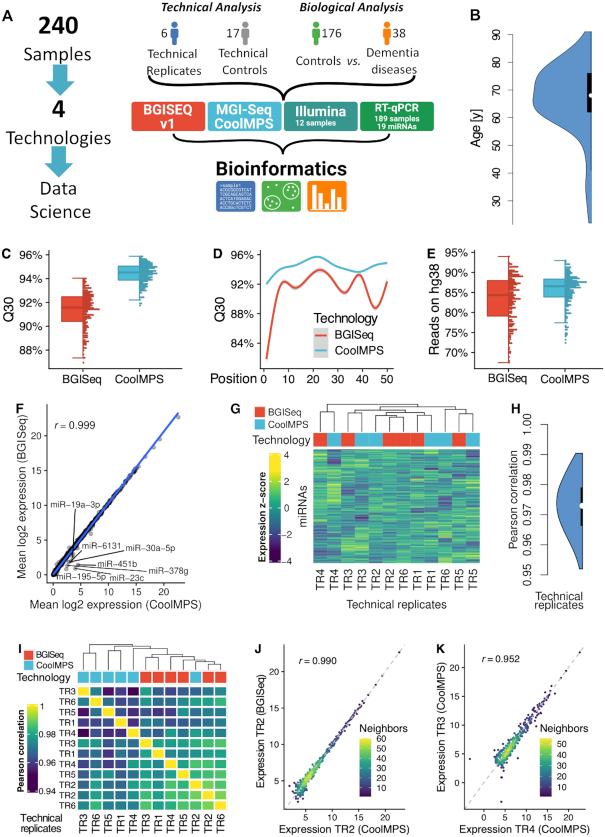
Results of massive parallel sequencing-by-synthesis vary depending on the sequencing approach. CoolMPS™ is a new sequencing chemistry that incorporates bases by labeled antibodies. To evaluate the performance, we sequenced 240 human non-coding RNA samples (dementia patients and controls) with and without CoolMPS. The Q30 value as indicator of the per base sequencing quality increased from 91.8 to 94%. The higher quality was reached across the whole read length. Likewise, the percentage of reads mapping to the human genome increased from 84.9 to 86.2%. For both technologies, we computed similar distributions between different RNA classes (miRNA, piRNA, tRNA, snoRNA and yRNA) and within the classes. While standard sequencing-by-synthesis allowed to recover more annotated miRNAs, CoolMPS yielded more novel miRNAs. The correlation between the two methods was 0.97. Evaluating the diagnostic performance, we observed lower minimal P-values for CoolMPS (adjusted P-value of 0.0006 versus 0.0004) and larger effect sizes (Cohen's d of 0.878 versus 0.9). Validating 19 miRNAs resulted in a correlation of 0.852 between CoolMPS and reverse transcriptase-quantitative polymerase chain reaction. Comparison to data generated with Illumina technology confirmed a known shift in the overall RNA composition. With CoolMPS we evaluated a novel sequencing-by-synthesis technology showing high performance for the analysis of non-coding RNAs.

Overview

The claims and statistics of this paper haven’t been checked yet.

Run the check — free, no account needed. It reads the open-access text and checks the sources it cites.

A few free checks a day · papers already verified open instantly · results are public

Integrity signals

Registry

Crossref · 10.1093/nar/gkaa1122

Cites

1 of 1 references verified0 citation errors · 0 not checkable

Statistics

Figures

Figure 1. Study setup and quality control. (A) In the study we measured 240 individual blood samples using two fundamentally different sequencing approaches and compare the data by bioinformatics approaches before we compute the concordance to RT-qPCR profiles. The 240 samples include one part that has been used only for assessment of technical properties (6 and 17 samples in blue and gray) as well as a second part to evaluate performance related to biomarker discovery (176 controls in green and 38 dementia cases in orange). (B) Distribution of the age of the individuals included in the study, shown as violin plot. The black box spans the first to the third quartile and the white dot shows the median. (C) Distribution of the average Q30 value per sample for the two technologies, shown as boxplot (left) and dotplot (right). Each sample is shown as one dot. The boxes span the first to the third quartile with the horizontal line inside the box representing the median value. The whiskers show the minimum and maximum values or values up to 1.5 times the interquartile range below or above the first or third quartile if outliers are present. (D) Q30 value over all samples per technology as function of the position in the read. The smoothed curve is fitted by a generalized additive model using a cubic regression spline. The gray area represents the confidence interval of the fit. (E) Distribution of the percentage of reads mapping to the human reference genome hg38 without mismatch per technology, shown as boxplot (left) and dotplot (right). Each sample is shown as one dot. The boxes span the first to the third quartile with the horizontal line inside the box representing the median value. The whiskers show the minimum and maximum values or values up to 1.5 times the interquartile range below or above the first or third quartile if outliers are present. (F) Scatter plot of the average expression of all miRNAs in all samples for the two technologies. The blue line is the regression line. The Pearson correlation is shown in the upper left part of the plot. MiRNAs with a fold change larger than two between both technologies are highlighted. (G) Heat map of the clustered expression z-scores of miRNAs (rows) and technical replicates (columns). The color code for the columns represents the technology. The dendrogram shows the hierarchical clustering of the samples with Euclidean distance and complete linkage. (H) Distribution of all 12*11/2 = 66 pairwise Pearson correlation coefficients, shown as violin plot. The black box spans the first to the third quartile and the white dot shows the median. (I) Correlation matrix of the expression values of all miRNAs for all technical replicates. The dendrogram shows the hierarchical clustering of the samples with Euclidean distance and complete linkage. (J) Scatter plot of miRNAs for the best correlation between two technical replicates. The dotted line represents the angle bisector. The Pearson correlation is shown in the upper left part of the plot. The points are colored according to the point density in their neighborhood. (K) Scatter plot of miRNAs for the worst correlation between two technical replicates. The dotted line represents the angle bisector. The Pearson correlation is shown in the upper left part of the plot. The points are colored according to the point density in their neighborhood.
Figure 1. Study setup and quality control. (A) In the study we measured 240 individual blood samples using two fundamentally different sequencing approaches and compare the data by bioinformatics approaches before we compute the concordance to RT-qPCR profiles. The 240 samples include one part that has been used only for assessment of technical properties (6 and 17 samples in blue and gray) as well as a second part to evaluate performance related to biomarker discovery (176 controls in green and 38 dementia cases in orange). (B) Distribution of the age of the individuals included in the study, shown as violin plot. The black box spans the first to the third quartile and the white dot shows the median. (C) Distribution of the average Q30 value per sample for the two technologies, shown as boxplot (left) and dotplot (right). Each sample is shown as one dot. The boxes span the first to the third quartile with the horizontal line inside the box representing the median value. The whiskers show the minimum and maximum values or values up to 1.5 times the interquartile range below or above the first or third quartile if outliers are present. (D) Q30 value over all samples per technology as function of the position in the read. The smoothed curve is fitted by a generalized additive model using a cubic regression spline. The gray area represents the confidence interval of the fit. (E) Distribution of the percentage of reads mapping to the human reference genome hg38 without mismatch per technology, shown as boxplot (left) and dotplot (right). Each sample is shown as one dot. The boxes span the first to the third quartile with the horizontal line inside the box representing the median value. The whiskers show the minimum and maximum values or values up to 1.5 times the interquartile range below or above the first or third quartile if outliers are present. (F) Scatter plot of the average expression of all miRNAs in all samples for the two technologies. The blue line is the regression line. The Pearson correlation is shown in the upper left part of the plot. MiRNAs with a fold change larger than two between both technologies are highlighted. (G) Heat map of the clustered expression z-scores of miRNAs (rows) and technical replicates (columns). The color code for the columns represents the technology. The dendrogram shows the hierarchical clustering of the samples with Euclidean distance and complete linkage. (H) Distribution of all 12*11/2 = 66 pairwise Pearson correlation coefficients, shown as violin plot. The black box spans the first to the third quartile and the white dot shows the median. (I) Correlation matrix of the expression values of all miRNAs for all technical replicates. The dendrogram shows the hierarchical clustering of the samples with Euclidean distance and complete linkage. (J) Scatter plot of miRNAs for the best correlation between two technical replicates. The dotted line represents the angle bisector. The Pearson correlation is shown in the upper left part of the plot. The points are colored according to the point density in their neighborhood. (K) Scatter plot of miRNAs for the worst correlation between two technical replicates. The dotted line represents the angle bisector. The Pearson correlation is shown in the upper left part of the plot. The points are colored according to the point density in their neighborhood.CC BY · PubMed Central
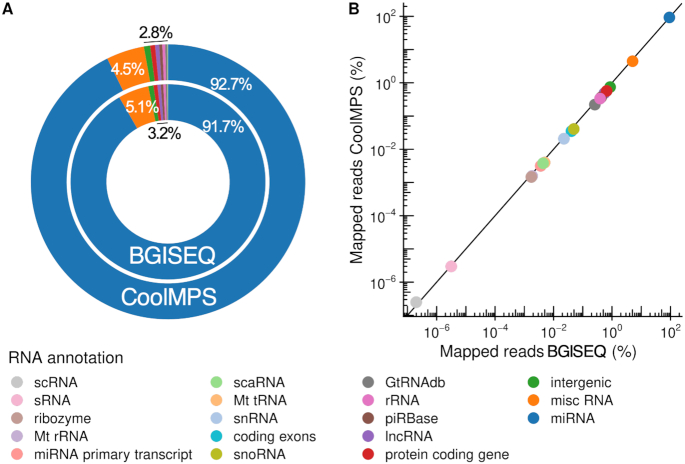
Figure 2. Distribution to the different sncRNAs classes. (A) Donut plot comparing the distribution of all RNA classes and intergenic regions that were covered by reads from CoolMPS and BGISEQ. (B) Scatter plot that shows the percentage of reads mapping to the RNA classes and intergenic regions for BGISEQ (x-axis) and CoolMPS (y-axis) on a logarithmic scale.
Figure 2. Distribution to the different sncRNAs classes. (A) Donut plot comparing the distribution of all RNA classes and intergenic regions that were covered by reads from CoolMPS and BGISEQ. (B) Scatter plot that shows the percentage of reads mapping to the RNA classes and intergenic regions for BGISEQ (x-axis) and CoolMPS (y-axis) on a logarithmic scale.CC BY · PubMed Central
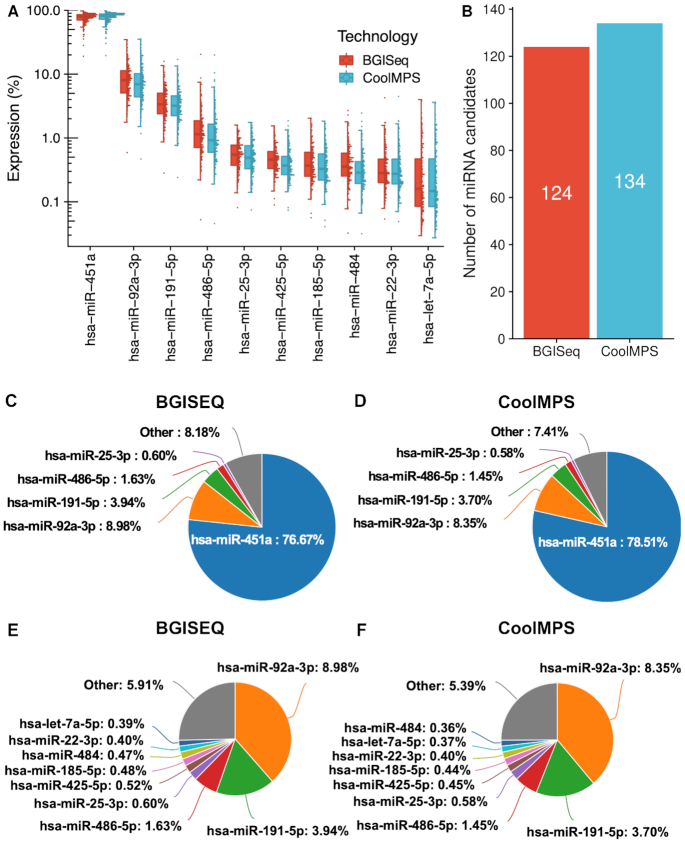
Figure 3. Distribution to microRNAs. (A) Distribution of the read percentage of the 10 most abundant miRNAs in the CoolMPS and BGISEQ data, shown as boxplot (left) and dotplot (right). Each sample is shown as one dot. The boxes span the first to the third quartile with the horizontal line inside the box representing the median value. The whiskers show the minimum and maximum values or values up to 1.5 times the interquartile range below or above the first or third quartile if outliers are present. (B) Number of novel microRNA candidates for both technologies. (C) Pie chart for the top five miRNAs on the BGISEQ. (D) Pie chart for the top five miRNAs on the CoolMPS. (E) Pie chart for the top ten miRNAs on the BGISEQ after exclusion of the most abundant miR-451a. (F) Pie chart for the top ten miRNAs using CoolMPS after exclusion of the most abundant miR-451a.
Figure 3. Distribution to microRNAs. (A) Distribution of the read percentage of the 10 most abundant miRNAs in the CoolMPS and BGISEQ data, shown as boxplot (left) and dotplot (right). Each sample is shown as one dot. The boxes span the first to the third quartile with the horizontal line inside the box representing the median value. The whiskers show the minimum and maximum values or values up to 1.5 times the interquartile range below or above the first or third quartile if outliers are present. (B) Number of novel microRNA candidates for both technologies. (C) Pie chart for the top five miRNAs on the BGISEQ. (D) Pie chart for the top five miRNAs on the CoolMPS. (E) Pie chart for the top ten miRNAs on the BGISEQ after exclusion of the most abundant miR-451a. (F) Pie chart for the top ten miRNAs using CoolMPS after exclusion of the most abundant miR-451a.CC BY · PubMed Central
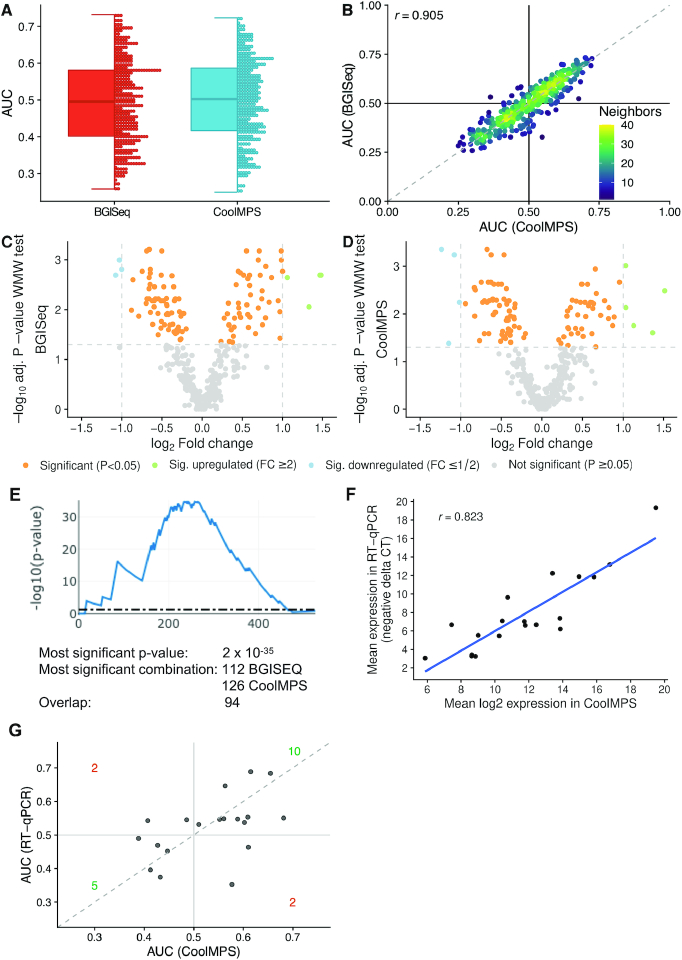
Figure 4. Diagnostic performance on dementia patients. (A) Distribution of the AUC values to differentiate between dementia and controls obtained for both technologies. An AUC of 0.5 means no dys-regulation. A deviation from 0.5 toward one means an upregulation and toward zero a downregulation of the biomarkers. The distribution is shown as boxplot (left) and dotplot (right). Each miRNA is shown as one dot. The boxes span the first to the third quartile with the horizontal line inside the box representing the median value. The whiskers show the minimum and maximum values or values up to 1.5 times the interquartile range below or above the first or third quartile if outliers are present. (B) Scatter plot of the AUC values to differentiate between dementia and controls in CoolMPS (x-axis) versus BGISEQ (y-axis). The black horizontal and vertical line represent the AUC value of 0.5, respectively. The Pearson correlation is shown in the upper left part of the plot. The points are colored according to the point density in their neighborhood. (C) Volcano plot showing the log2 fold change on the x-axis and the FDR adjusted negative log10 of the Wilcoxon–Mann–Whitney (WMW) P-value on the y-axis for BGISEQ. Orange dots are located above the horizontal line and are significant. Blue and green dots above the horizontal and on the left / right of the vertical lines are significant and have a fold-change above 2. (D) Same volcano plot as in Figure 4C, but for CoolMPS. (E) Result of DynaVenn that presents the negative log10 of the overlap between the two miRNA sets dependent on how many miRNAs are included. The peak of the curve represents the most significant overlap. (F) Scatter plot of the log2 CoolMPS expression (x-axis) and the negative delta CT value for the 19 miRNAs included in the validation study. The Pearson correlation coefficient is shown in the upper left part of the plot. (G) Scatter plot of the AUC values to differentiate between dementia and controls in CoolMPS (x-axis) and BGISEQ (y-axis). The dashed line represents the angle bisector.
Figure 4. Diagnostic performance on dementia patients. (A) Distribution of the AUC values to differentiate between dementia and controls obtained for both technologies. An AUC of 0.5 means no dys-regulation. A deviation from 0.5 toward one means an upregulation and toward zero a downregulation of the biomarkers. The distribution is shown as boxplot (left) and dotplot (right). Each miRNA is shown as one dot. The boxes span the first to the third quartile with the horizontal line inside the box representing the median value. The whiskers show the minimum and maximum values or values up to 1.5 times the interquartile range below or above the first or third quartile if outliers are present. (B) Scatter plot of the AUC values to differentiate between dementia and controls in CoolMPS (x-axis) versus BGISEQ (y-axis). The black horizontal and vertical line represent the AUC value of 0.5, respectively. The Pearson correlation is shown in the upper left part of the plot. The points are colored according to the point density in their neighborhood. (C) Volcano plot showing the log2 fold change on the x-axis and the FDR adjusted negative log10 of the Wilcoxon–Mann–Whitney (WMW) P-value on the y-axis for BGISEQ. Orange dots are located above the horizontal line and are significant. Blue and green dots above the horizontal and on the left / right of the vertical lines are significant and have a fold-change above 2. (D) Same volcano plot as in Figure 4C, but for CoolMPS. (E) Result of DynaVenn that presents the negative log10 of the overlap between the two miRNA sets dependent on how many miRNAs are included. The peak of the curve represents the most significant overlap. (F) Scatter plot of the log2 CoolMPS expression (x-axis) and the negative delta CT value for the 19 miRNAs included in the validation study. The Pearson correlation coefficient is shown in the upper left part of the plot. (G) Scatter plot of the AUC values to differentiate between dementia and controls in CoolMPS (x-axis) and BGISEQ (y-axis). The dashed line represents the angle bisector.CC BY · PubMed Central

Verification

Claims the paper makes

The claims and statistics of this paper haven’t been checked yet.

Run the check — free, no account needed. It reads the open-access text and checks the sources it cites.

A few free checks a day · papers already verified open instantly · results are public

Claims other papers make about this one

Each is checked against this paper’s own text: does it say what the citing paper says it does?

Self-check

Percentages, sums and reported differences re-computed from the paper’s own numbers.

The self-check needs the paper’s full text.

Citations

Cites

Research works printed but not linked: 46

  1. Ronaghi, 1996, Real-time DNA sequencing using detection of pyrophosphate release, Anal. Biochem., 242, 84, 10.1006/abio.1996.0432 · DOI
  2. Koboldt, 2013, The next-generation sequencing revolution and its impact on genomics, Cell, 155, 27, 10.1016/j.cell.2013.09.006 · DOI
  3. Benson, 2013, GenBank, Nucleic Acids Res., 41, D36, 10.1093/nar/gks1195 · DOI · Paper page
  4. Slatko, 2018, Overview of next-generation sequencing technologies, Curr. Protoc. Mol. Biol., 122, e59, 10.1002/cpmb.59 · DOI
  5. Senabouth, 2020, Comparative performance of the BGI and Illumina sequencing technology for single-cell RNA-sequencing, NAR Genomics Bioinform., 2, lqaa034, 10.1093/nargab/lqaa034 · DOI
  6. Mathew, 2020, Updates on the current technologies for microRNA profiling, Microrna, 9, 17, 10.2174/2211536608666190628112722 · DOI
  7. Alles, 2019, An estimate of the total number of true human miRNAs, Nucleic Acids Res., 47, 3353, 10.1093/nar/gkz097 · DOI · Paper page
  8. Fehlmann, 2018, A high-resolution map of the human small non-coding transcriptome, Bioinformatics, 34, 1621, 10.1093/bioinformatics/btx814 · DOI · Paper page
  9. Fehlmann, 2019, The sncRNA Zoo: a repository for circulating small noncoding RNAs in animals, Nucleic Acids Res., 47, 4431, 10.1093/nar/gkz227 · DOI
  10. Kozomara, 2019, miRBase: from microRNA sequences to function, Nucleic Acids Res., 47, D155, 10.1093/nar/gky1141 · DOI · Paper page
  11. Griffiths-Jones, 2006, miRBase: microRNA sequences, targets and gene nomenclature, Nucleic Acids Res., 34, D140, 10.1093/nar/gkj112 · DOI · Paper page
  12. Fromm, 2020, MirGeneDB 2.0: the metazoan microRNA complement, Nucleic Acids Res., 48, D132, 10.1093/nar/gkz885 · DOI · Paper page
  13. Backes, 2018, miRCarta: a central repository for collecting miRNA candidates, Nucleic Acids Res., 46, D160, 10.1093/nar/gkx851 · DOI
  14. Fromm, 2020, Quo vadis microRNAs, Trends Genet, 36, 461, 10.1016/j.tig.2020.03.007 · DOI · Paper page
  15. Fehlmann, 2017, Web-based NGS data analysis using miRMaster: a large-scale meta-analysis of human miRNAs, Nucleic Acids Res., 45, 8731, 10.1093/nar/gkx595 · DOI
  16. Friedlander, 2008, Discovering microRNAs from deep sequencing data using miRDeep, Nat. Biotechnol., 26, 407, 10.1038/nbt1394 · DOI
  17. Friedlander, 2012, miRDeep2 accurately identifies known and hundreds of novel microRNA genes in seven animal clades, Nucleic Acids Res., 40, 37, 10.1093/nar/gkr688 · DOI · Paper page
  18. Heinicke, 2020, Systematic assessment of commercially available low-input miRNA library preparation kits, RNA Biol., 17, 75, 10.1080/15476286.2019.1667741 · DOI
  19. Meistertzheim, 2019, Comparative analysis of biochemical biases by ligation- and template-switch-Based small RNA library preparation protocols, Clin. Chem., 65, 1581, 10.1373/clinchem.2019.305045 · DOI
  20. Ludwig, 2018, Small ncRNA-Seq results of human Tissues: Variations depending on sample integrity, Clin. Chem., 64, 1074, 10.1373/clinchem.2017.285767 · DOI
  21. Baroin-Tourancheau, 2019, Evaluating and correcting inherent bias of microRNA expression in Illumina sequencing analysis, Front. Mol. Biosci., 6, 17, 10.3389/fmolb.2019.00017 · DOI
  22. Fehlmann, 2016, cPAS-based sequencing on the BGISEQ-500 to explore small non-coding RNAs, Clin. Epigenet., 8, 123, 10.1186/s13148-016-0287-1 · DOI
  23. Keller, 2016, Validating Alzheimer's disease micro RNAs using next-generation sequencing, Alzheimers Dement, 12, 565, 10.1016/j.jalz.2015.12.012 · DOI
  24. Ludwig, 2019, Machine learning to detect Alzheimer's disease from circulating Non-coding RNAs, Genomics Proteomics Bioinform., 17, 430, 10.1016/j.gpb.2019.09.004 · DOI
  25. Fehlmann, 2017, Exploring ncRNAs in Alzheimer's disease by miRMaster, Oncotarget, 8, 3771, 10.18632/oncotarget.14054 · DOI
  26. Li, 2009, The sequence Alignment/Map format and SAMtools, Bioinformatics, 25, 2078, 10.1093/bioinformatics/btp352 · DOI · Paper page
  27. Langmead, 2009, Ultrafast and memory-efficient alignment of short DNA sequences to the human genome, Genome Biol., 10, R25, 10.1186/gb-2009-10-3-r25 · DOI · Paper page
  28. Liao, 2014, featureCounts: an efficient general purpose program for assigning sequence reads to genomic features, Bioinformatics, 30, 923, 10.1093/bioinformatics/btt656 · DOI · Paper page
  29. Harrow, 2012, GENCODE: the reference human genome annotation for The ENCODE Project, Genome Res., 22, 1760, 10.1101/gr.135350.111 · DOI · Paper page
  30. Wang, 2019, piRBase: a comprehensive database of piRNA sequences, Nucleic Acids Res., 47, D175, 10.1093/nar/gky1043 · DOI
  31. Chan, 2016, GtRNAdb 2.0: an expanded database of transfer RNA genes identified in complete and draft genomes, Nucleic Acids Res., 44, D184, 10.1093/nar/gkv1309 · DOI
  32. Backes, 2016, Prioritizing and selecting likely novel miRNAs from NGS data, Nucleic Acids Res., 44, e53, 10.1093/nar/gkv1335 · DOI
  33. Robin, 2011, pROC: an open-source package for R and S+ to analyze and compare ROC curves, BMC Bioinformatics, 12, 77, 10.1186/1471-2105-12-77 · DOI · Paper page
  34. Gu, 2016, Complex heatmaps reveal patterns and correlations in multidimensional genomic data, Bioinformatics, 32, 2847, 10.1093/bioinformatics/btw313 · DOI
  35. Amand, 2019, DynaVenn: web-based computation of the most significant overlap between ordered sets, BMC Bioinformatics, 20, 743, 10.1186/s12859-019-3320-5 · DOI
  36. Kern, 2020, miEAA 2.0: integrating multi-species microRNA enrichment analysis and workflow management systems, Nucleic Acids Res., 48, W521, 10.1093/nar/gkaa309 · DOI
  37. Backes, 2016, miEAA: microRNA enrichment analysis and annotation, Nucleic Acids Res., 44, W110, 10.1093/nar/gkw345 · DOI
  38. Amrhein, 2019, Scientists rise up against statistical significance, Nature, 567, 305, 10.1038/d41586-019-00857-9 · DOI · Paper page
  39. Zhang, 2020, miR-16-5p and miR-19b-3p prevent amyloid beta-induced injury by targeting BACE1 in SH-SY5Y cells, Neuroreport, 31, 205, 10.1097/WNR.0000000000001379 · DOI
  40. Gui, 2015, Altered microRNA profiles in cerebrospinal fluid exosome in Parkinson disease and Alzheimer disease, Oncotarget, 6, 37043, 10.18632/oncotarget.6158 · DOI · Paper page
  41. Lugli, 2015, Plasma exosomal miRNAs in persons with and without Alzheimer Disease: Altered expression and prospects for biomarkers, PLoS One, 10, e0139233, 10.1371/journal.pone.0139233 · DOI · Paper page
  42. Satoh, 2015, MicroRNA-seq data analysis pipeline to identify blood biomarkers for Alzheimer's disease from public data, Biomark Insights, 10, 21, 10.4137/BMI.S25132 · DOI
  43. Kumar, 2013, Circulating miRNA biomarkers for Alzheimer's disease, PLoS One, 8, e69807, 10.1371/journal.pone.0069807 · DOI
  44. Wu, 2020, Differential blood miRNA expression in brain amyloid imaging-defined Alzheimer's disease and controls, Alzheimers Res. Ther., 12, 59, 10.1186/s13195-020-00627-0 · DOI
  45. Liu, 2019, miR-15b-5p targeting amyloid precursor protein is involved in the anti-amyloid eflect of curcumin in swAPP695-HEK293 cells, Neural. Regen. Res., 14, 1603, 10.4103/1673-5374.255979 · DOI
  46. Wang, 2020, MiR-335-5p Inhibits beta-Amyloid (Abeta) accumulation to attenuate cognitive deficits through targeting c-jun-N-terminal kinase 3 in Alzheimer's disease, Curr. Neurovasc. Res., 17, 93, 10.2174/1567202617666200128141938 · DOI

Cited by

Sorted by citations

See all 21

Metadata

Authors
Li, Y., Fehlmann, T., Borcherding, A., Drmanac, S., Liu, S., Groeger, L., Xu, C., Callow, M., Villarosa, C., Jorjorian, A., Kern, F., Grammes, N., Meese, E., Jiang, H., Drmanac, R., Ludwig, N., & Keller, A.
Affiliations
  • Chair for Clinical Bioinformatics, Saarland University, 66123 Saarbrücken, Germany
  • Complete Genomics Incorporated, San Jose, CA 95134, USA
  • Department of Human Genetics, Saarland University, 66421 Homburg, Germany
  • MGI, BGI-Shenzhen, Shenzhen 518083, China
Venue
Nucleic Acids Research
Published
2020-12-08
Volume
49
Issue
2
Pages
e10-e10
ISSN
  • 0305-1048
  • 1362-4962
Cited by
21
References
1
Language
en
Funders
  • Saarland University
  • Michael J. Fox Foundation for Parkinson's Research (14446)
  • Complete Genomics

About these checks

Registry, retraction, Cites and statistics results are computed, not judged, with one exception: a printed reference that no index lists is read once by a model before it counts as a citation error. Claims are extracted by a model and kept only when their quote appears verbatim in the text; each cited source is then checked, with a model’s help, for whether it says what the claim relies on. Those verdicts can be wrong — read the claim’s quote and the cited source before relying on one.

Statistics and arithmetic are recomputed, not judged.

Confidence bands are shown only for fields calibrated on our annotated test set. None is calibrated yet, so no band is shown.

What counts as a claim ›How we measure confidence ›How we check this ›

Are you an author, or do you see a problem with this page? Request a review