

The DOI matches its Crossref record; 8 of the 8 references it cites were found in a registry or an index.
RBPmap: a web server for mapping binding sites of RNA-binding proteins
Overview
The claims and statistics of this paper haven’t been checked yet.
Run the check — free, no account needed. It reads the open-access text and checks the sources it cites.
Integrity signals
Registry
Cites
Statistics
Figures
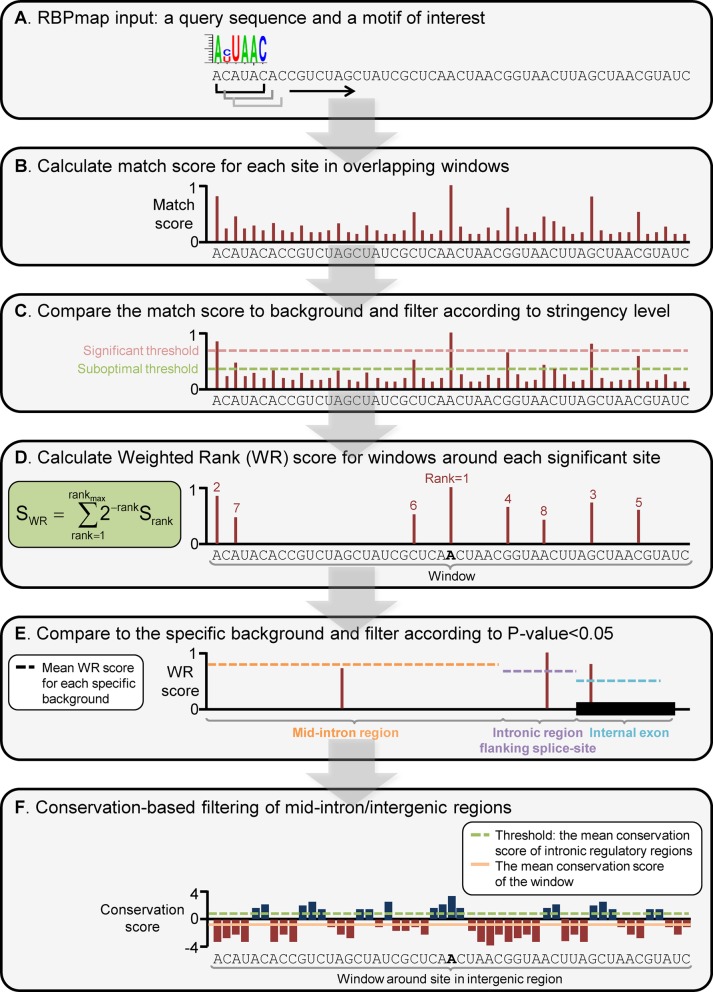
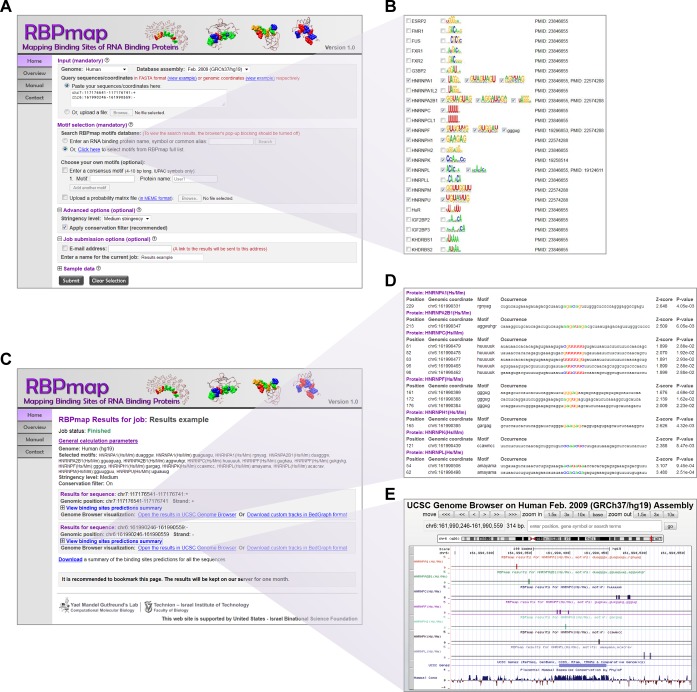
Verification
Claims the paper makes
The claims and statistics of this paper haven’t been checked yet.
Run the check — free, no account needed. It reads the open-access text and checks the sources it cites.
Claims other papers make about this one
Each is checked against this paper’s own text: does it say what the citing paper says it does?
In the citing paper
“Risk enrichments for schizophrenia, bipolar disorder, and autism spectrum disorder30,31 were most enriched in 5’-Del iGLUT neurons and 3’-Del iGABA neurons (Extended Data Fig. 2).”
From Phenotypic complexities of rare heterozygous neurexin-1 deletions (2025) · cites this paper as [30]
Self-check
Percentages, sums and reported differences re-computed from the paper’s own numbers.
The self-check needs the paper’s full text.
Citations
Cites
<tt>BLAT</tt> —The <tt>BLAST</tt> -Like Alignment Tool
Kent, W. J. (2002) · Genome Research · doi:10.1101/gr.229202 · Cited by 8,480
Evolutionarily conserved elements in vertebrate, insect, worm, and yeast genomes
Siepel, A., Bejerano, G., Pedersen, J. S., Hinrichs, A. S., Hou, M., Rosenbloom, K., Clawson, H., Spieth, J., Hillier, L. W., Richards, S., et al. (2005) · Genome Research · doi:10.1101/gr.3715005 · Cited by 3,971 · cited 2×
“For Drosophila sequences we use the phastCons insect conservation table (28).”
MethodA compendium of RNA-binding motifs for decoding gene regulation
Ray, D., Kazan, H., Cook, K. B., Weirauch, M. T., Najafabadi, H. S., Li, X., Gueroussov, S., Albu, M., Zheng, H., Yang, A., et al. (2013) · Nature · doi:10.1038/nature12311 · Cited by 1,480 · cited 1×
“Recently, Ray et al. have used thousands of short designed RNA oligos to determine the binding preferences of 207 different RBPs, mainly from human and Drosophila melanogaster (3).”
BackgroundHITS-CLIP yields genome-wide insights into brain alternative RNA processing
Licatalosi, D. D., Mele, A., Fak, J. J., Ule, J., Kayikci, M., Chi, S. W., Clark, T. A., Schweitzer, A. C., Blume, J. E., Wang, X., et al. (2008) · Nature · doi:10.1038/nature07488 · Cited by 1,352 · cited 1×
“Among them are the Ribonucleoprotein immunoprecipitation (RIP) method (4) and the more advanced RIP-chip (5), as well as several cross-linking based methods such as CLIP (cross-linking immunoprecipitation) (6), CLIP-seq / HITS-CLIP (7), iCLIP (8) and PAR-CLIP (9).”
MethodiCLIP reveals the function of hnRNP particles in splicing at individual nucleotide resolution
König, J., Zarnack, K., Rot, G., Curk, T., Kayikci, M., Zupan, B., Turner, D. J., Luscombe, N. M., & Ule, J. (2010) · Nature Structural & Molecular Biology · doi:10.1038/nsmb.1838 · Cited by 1,126
CLIP Identifies Nova-Regulated RNA Networks in the Brain
Ule, J., Jensen, K. B., Ruggiu, M., Mele, A., Ule, A., & Darnell, R. B. (2003) · Science · doi:10.1126/science.1090095 · Cited by 1,120
Xue, Y., Zhou, Y., Wu, T., Zhu, T., Ji, X., Kwon, Y.-S., Zhang, C., Yeo, G., Black, D. L., Sun, H., et al. (2009) · Molecular Cell · doi:10.1016/j.molcel.2009.12.003 · Cited by 469
SFmap: a web server for motif analysis and prediction of splicing factor binding sites
Paz, I., Akerman, M., Dror, I., Kosti, I., & Mandel-Gutfreund, Y. (2010) · Nucleic Acids Research · doi:10.1093/nar/gkq444 · Cited by 102
Self-citation
Research works printed but not linked: 27
- Li, 2014, Finding the target sites of RNA-binding proteins, Wiley Interdiscip. Rev. RNA, 5, 111, 10.1002/wrna.1201 · DOI
- Ray, 2009, Rapid and systematic analysis of the RNA recognition specificities of RNA-binding proteins, Nat. Biotechnol., 27, 667, 10.1038/nbt.1550 · DOI
- Tenenbaum, 2000, Identifying mRNA subsets in messenger ribonucleoprotein complexes by using cDNA arrays, PNAS, 97, 14085, 10.1073/pnas.97.26.14085 · DOI
- Keene, 2006, RIP-Chip: the isolation and identification of mRNAs, microRNAs and protein components of ribonucleoprotein complexes from cell extracts, Nat. Protoc., 1, 302, 10.1038/nprot.2006.47 · DOI
- Hafner, 2010, Transcriptome-wide identification of RNA-binding protein and microRNA target sites by PAR-CLIP, Cell, 141, 129, 10.1016/j.cell.2010.03.009 · DOI · Paper page
- Khorshid, 2011, CLIPZ: a database and analysis environment for experimentally determined binding sites of RNA-binding proteins, Nucleic Acids Res., 39, D245, 10.1093/nar/gkq940 · DOI
- Anders, 2011, doRiNA: a database of RNA interactions in post-transcriptional regulation, Nucleic Acids Res., 40, D180, 10.1093/nar/gkr1007 · DOI
- Yao, 2006, CMfinder–a covariance model based RNA motif finding algorithm, Bioinformatics, 22, 445, 10.1093/bioinformatics/btk008 · DOI
- Hiller, 2006, Using RNA secondary structures to guide sequence motif finding towards single-stranded regions, Nucleic Acids Res., 34, e117, 10.1093/nar/gkl544 · DOI
- Bailey, 1994, Fitting a mixture model by expectation maximization to discover motifs in biopolymers, Proc. Int. Conf. Intell. Syst. Mol. Biol., 2, 28
- Linhart, 2008, Transcription factor and microRNA motif discovery: The Amadeus platform and a compendium of metazoan target sets, Genome Res., 18, 1180, 10.1101/gr.076117.108 · DOI
- Georgiev, 2010, Evidence-ranked motif identification, Genome Biol., 11, R19, 10.1186/gb-2010-11-2-r19 · DOI
- Leibovich, 2013, DRIMust: a web server for discovering rank imbalanced motifs using suffix trees, Nucleic Acids Res., 41, W174, 10.1093/nar/gkt407 · DOI
- Grillo, 2010, UTRdb and UTRsite (RELEASE 2010): a collection of sequences and regulatory motifs of the untranslated regions of eukaryotic mRNAs, Nucleic Acids Res., 38, D75, 10.1093/nar/gkp902 · DOI
- Pesole, 2000, UTRdb and UTRsite: specialized databases of sequences and functional elements of 5’ and 3’ untranslated regions of eukaryotic mRNAs, Nucleic Acids Res., 28, 193, 10.1093/nar/28.1.193 · DOI
- Cook, 2011, RBPDB: a database of RNA-binding specificities, Nucleic Acids Res., 39, D301, 10.1093/nar/gkq1069 · DOI · Paper page
- Cartegni, 2003, ESEfinder: a web resource to identify exonic splicing enhancers, Nucl. Acids Res., 31, 3568, 10.1093/nar/gkg616 · DOI
- Huang, 2006, RegRNA: an integrated web server for identifying regulatory RNA motifs and elements, Nucleic Acids Res., 34, W429, 10.1093/nar/gkl333 · DOI
- Akerman, 2009, A computational approach for genome-wide mapping of splicing factor binding sites, Genome Biol., 10, R30, 10.1186/gb-2009-10-3-r30 · DOI
- Kosti, 2012, An Integrated Regulatory Network Reveals Pervasive Cross-Regulation among Transcription and Splicing Factors, PLoS Comput. Biol., 8, e1002603, 10.1371/journal.pcbi.1002603 · DOI
- Cereda, 2014, RNAmotifs: prediction of multivalent RNA motifs that control alternative splicing, Genome Biol., 15, R20, 10.1186/gb-2014-15-1-r20 · DOI
- Zhang, 2013, Prediction of clustered RNA-binding protein motif sites in the mammalian genome, Nucleic Acids Res., 41, 6793, 10.1093/nar/gkt421 · DOI
- Grillo, 2003, PatSearch: A program for the detection of patterns and structural motifs in nucleotide sequences, Nucleic Acids Res., 31, 3608, 10.1093/nar/gkg548 · DOI
- Jacobs, 2006, Transterm—extended search facilities and improved integration with other databases, Nucl. Acids Res., 34, D37, 10.1093/nar/gkj159 · DOI
- Huelga, 2012, Integrative genome-wide analysis reveals cooperative regulation of alternative splicing by hnRNP proteins, Cell Rep., 1, 167, 10.1016/j.celrep.2012.02.001 · DOI · Paper page
- Tollervey, 2011, Characterizing the RNA targets and position-dependent splicing regulation by TDP-43, Nat. Neurosci., 14, 452, 10.1038/nn.2778 · DOI · Paper page
- Corcoran, 2011, PARalyzer: definition of RNA binding sites from PAR-CLIP short-read sequence data, Genome Biol., 12, R79, 10.1186/gb-2011-12-8-r79 · DOI
Cited by
Biallelic expansion of an intronic repeat in RFC1 is a common cause of late-onset ataxia
Cortese, A., Simone, R., Sullivan, R., Vandrovcova, J., Tariq, H., Yau, W. Y., Humphrey, J., Jaunmuktane, Z., Sivakumar, P., Polke, J., et al. (2019) · Nature Genetics · doi:10.1038/s41588-019-0372-4 · Cited by 575
Yurdagul, A., Subramanian, M., Wang, X., Crown, S. B., Ilkayeva, O. R., Darville, L., Kolluru, G. K., Rymond, C. C., Gerlach, B. D., Zheng, Z., et al. (2020) · Cell Metabolism · doi:10.1016/j.cmet.2020.01.001 · Cited by 525
Nuclear Retention of mRNA in Mammalian Tissues
Bahar Halpern, K., Caspi, I., Lemze, D., Levy, M., Landen, S., Elinav, E., Ulitsky, I., & Itzkovitz, S. (2015) · Cell Reports · doi:10.1016/j.celrep.2015.11.036 · Cited by 258
3′ UTR lengthening as a novel mechanism in regulating cellular senescence.
Chen, M., Lyu, G., Han, M., Nie, H., Shen, T., Chen, W., Niu, Y., Song, Y., Li, X., Li, H., et al. (2018) · Genome Research · doi:10.1101/gr.224451.117 · Cited by 111
Gain-of-function mutation of microRNA-140 in human skeletal dysplasia
Grigelioniene, G., Suzuki, H. I., Taylan, F., Mirzamohammadi, F., Borochowitz, Z. U., Ayturk, U. M., Tzur, S., Horemuzova, E., Lindstrand, A., Weis, M. A., et al. (2019) · Nature Medicine · doi:10.1038/s41591-019-0353-2 · Cited by 103
“1) and predicted all possible bindings sites of 94 human/mouse RBPs using RBPmap (http://rbpmap.technion.ac.il/) and a high stringency option 59 .”
Caggiano, C., Pieraccioli, M., Panzeri, V., Sette, C., & Bielli, P. (2019) · Nucleic Acids Research · doi:10.1093/nar/gkz344 · Cited by 44
“il/) (41) prediction tools (Supplementary Figure S6A).”
Untranslated Region Sequences and the Efficacy of mRNA Vaccines against Tuberculosis
Reshetnikov, V., Terenin, I., Shepelkova, G., Yeremeev, V., Kolmykov, S., Nagornykh, M., Kolosova, E., Sokolova, T., Zaborova, O., Kukushkin, I., et al. (2024) · International Journal of Molecular Sciences · doi:10.3390/ijms25020888 · Cited by 33
Phenotypic complexities of rare heterozygous neurexin-1 deletions
Fernando, M. B., Fan, Y., Zhang, Y., Tokolyi, A., Murphy, A. N., Kammourh, S., Deans, P. J. M., Ghorbani, S., Onatzevitch, R., Pero, A., et al. (2025) · Nature · doi:10.1038/s41586-025-08864-9 · Cited by 30
Rapone, R., Del Maestro, L., Bouyioukos, C., Albini, S., Cruz-Tapias, P., Joliot, V., Cosson, B., & Ait-Si-Ali, S. (2023) · iScience · doi:10.1016/j.isci.2023.107386 · Cited by 14
O’Reilly, M. E., Ho, S., Coronel, J., Zhu, L., Liu, W., Xue, C., Kim, E., Cynn, E., Matias, C. V., Soni, R. K., et al. (2024) · Cell Reports · doi:10.1016/j.celrep.2024.114240 · Cited by 7
CYFIP1 governs the development of cortical axons by modulating calcium availability
Ricci, C., Midroit, M. J., Caicci, F., Achsel, T., Domínguez-Iturza, N., & Bagni, C. (2025) · Nature Communications · doi:10.1038/s41467-025-65801-0 · Cited by 1
Metadata
- Authors
- Paz, I., Kosti, I., Ares, M., Cline, M., & Mandel-Gutfreund, Y.
- Venue
- Nucleic Acids Research
- Publisher
- Oxford University Press (OUP)
- Published
- 2014-05-14
- Volume
- 42
- Issue
- W1
- Pages
- W361-W367
- ISSN
- 1362-4962
- 0305-1048
- PMC
- PMC4086114
- Cited by
- 579
- References
- 8
- Language
- en
About these checks
Registry, retraction, Cites and statistics results are computed, not judged, with one exception: a printed reference that no index lists is read once by a model before it counts as a citation error. Claims are extracted by a model and kept only when their quote appears verbatim in the text; each cited source is then checked, with a model’s help, for whether it says what the claim relies on. Those verdicts can be wrong — read the claim’s quote and the cited source before relying on one.
Statistics and arithmetic are recomputed, not judged.
Confidence bands are shown only for fields calibrated on our annotated test set. None is calibrated yet, so no band is shown.
What counts as a claim ›How we measure confidence ›How we check this ›
Are you an author, or do you see a problem with this page? Request a review
Data sources
Bibliographic data: Semantic Scholar, OpenAlex, Crossref.
Contains information from the Semantic Scholar Academic Graph Datasets, made available under the ODC Attribution License (ODC-BY 1.0).
Semantic Scholar’s data is described in: Kinney, R., et al. (2023). The Semantic Scholar Open Data Platform. arXiv:2301.10140.
