

IW-Scoring: an Integrative Weighted Scoring framework for annotating and prioritizing genetic variations in the noncoding genome
Open accessPublished version of a preprint
The DOI matches its Crossref record; 50 of the 50 references it cites were found in a registry or an index.
Abstract
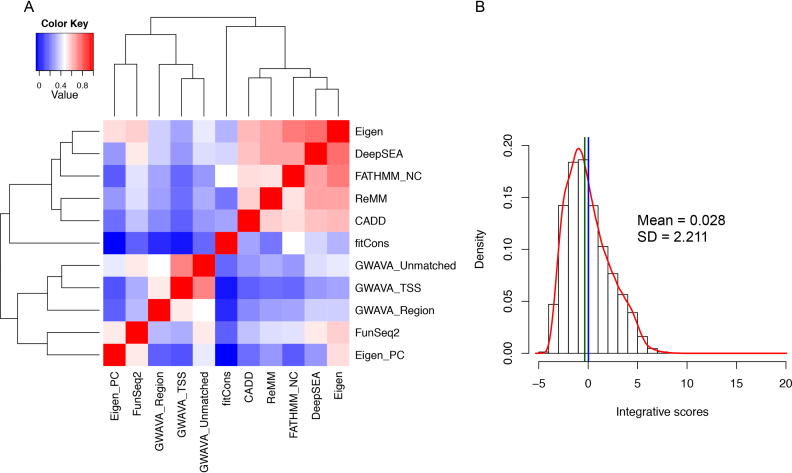
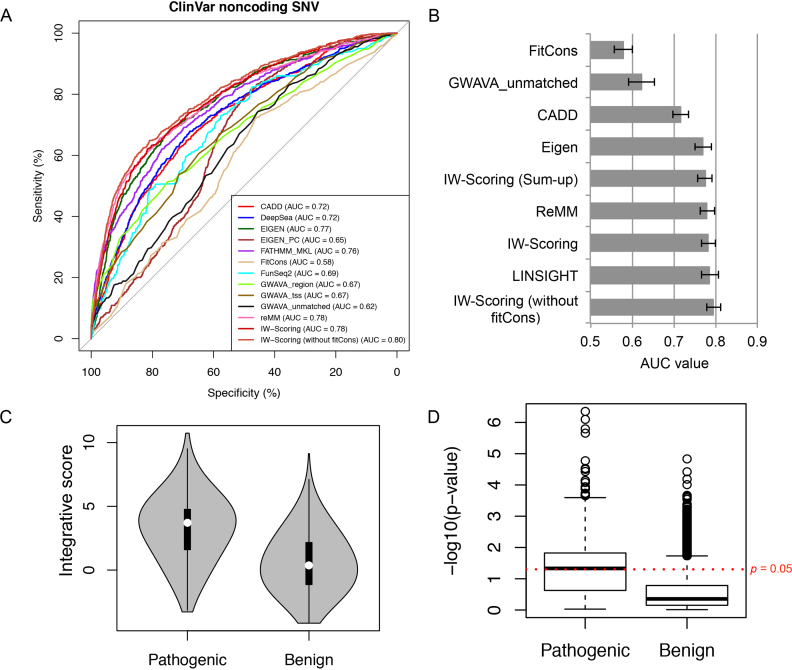
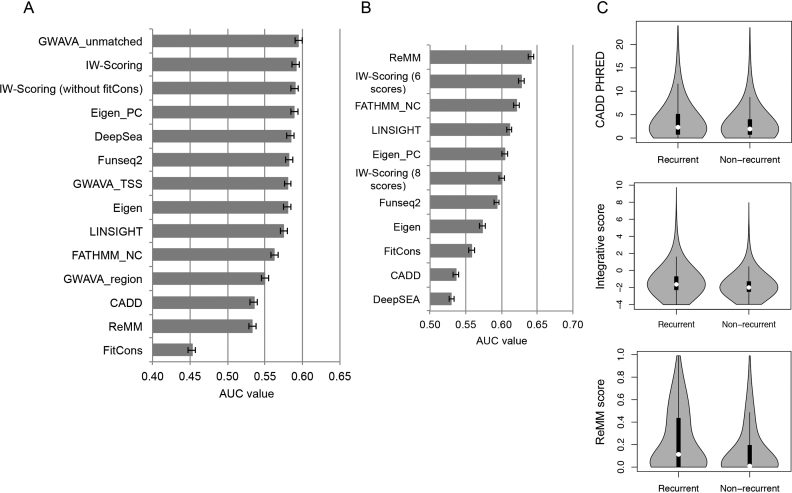
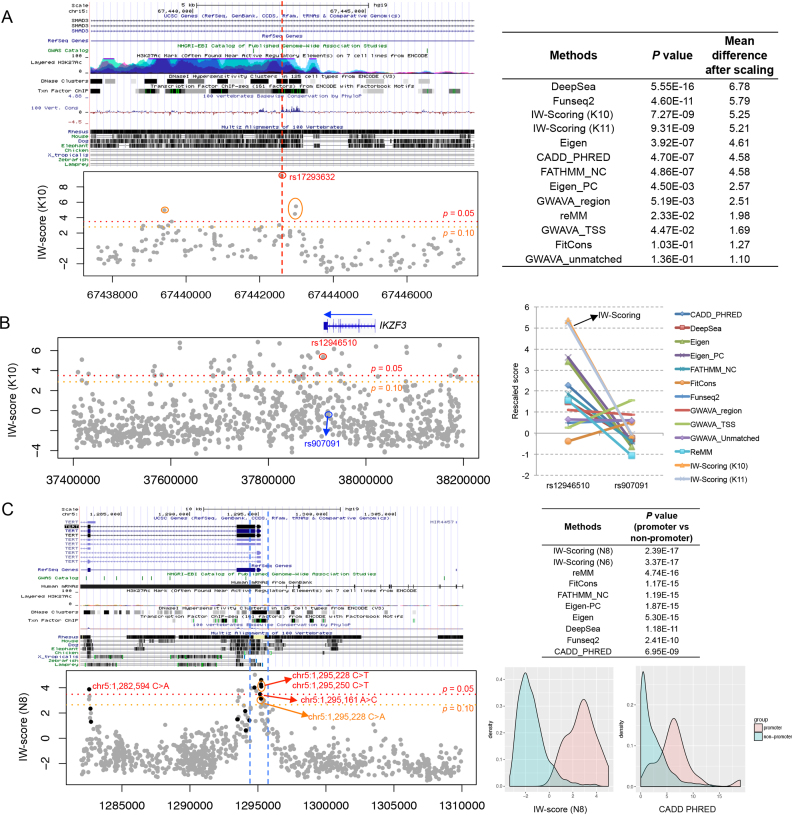
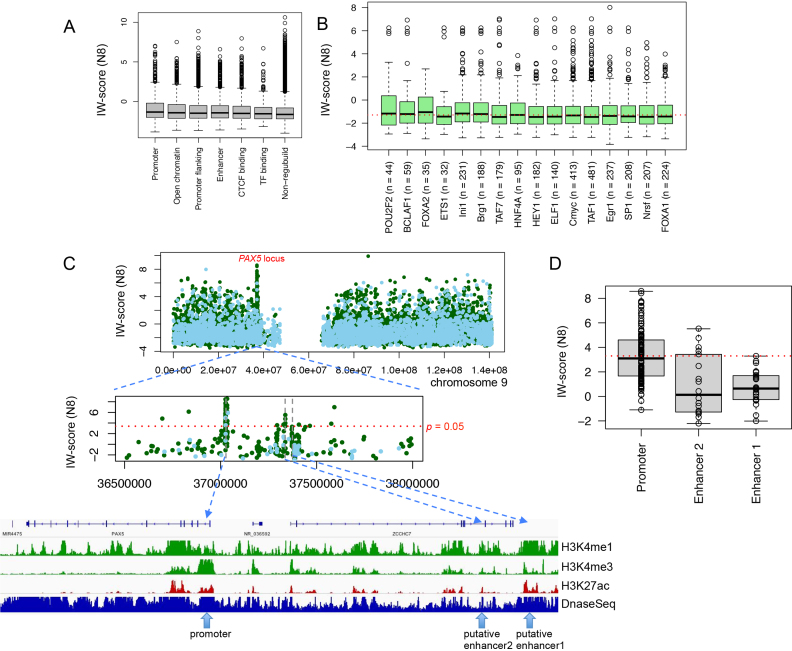
The vast majority of germline and somatic variations occur in the noncoding part of the genome, only a small fraction of which are believed to be functional. From the tens of thousands of noncoding variations detectable in each genome, identifying and prioritizing driver candidates with putative functional significance is challenging. To address this, we implemented IW-Scoring, a new Integrative Weighted Scoring model to annotate and prioritise functionally relevant noncoding variations. We evaluate 11 scoring methods, and apply an unsupervised spectral approach for subsequent selective integration into two linear weighted functional scoring schemas for known and novel variations. IW-Scoring produces stable high-quality performance as the best predictors for three independent data sets. We demonstrate the robustness of IW-Scoring in identifying recurrent functional mutations in the TERT promoter, as well as disease SNPs in proximity to consensus motifs and with gene regulatory effects. Using follicular lymphoma as a paradigmatic cancer model, we apply IW-Scoring to locate 11 recurrently mutated noncoding regions in 14 follicular lymphoma genomes, and validate 9 of these regions in an extension cohort, including the promoter and enhancer regions of PAX5. Overall, IW-Scoring demonstrates greater versatility in identifying trait- and disease-associated noncoding variants. Scores from IW-Scoring as well as other methods are freely available from http://www.snp-nexus.org/IW-Scoring/.
Overview
The claims and statistics of this paper haven’t been checked yet.
Free: it reads the open-access text and checks the first 5 claims that cite a source we can check. Create a free account to check every claim.
Integrity signals
Registry
Cites
Statistics
Figures

Verification
Claims the paper makes
The claims and statistics of this paper haven’t been checked yet.
Free: it reads the open-access text and checks the first 5 claims that cite a source we can check. Create a free account to check every claim.
Self-check
Percentages, sums and reported differences re-computed from the paper’s own numbers.
The self-check needs the paper’s full text.
Citations
Cites
An integrated encyclopedia of DNA elements in the human genome
The ENCODE Project Consortium (2012) · Nature · doi:10.1038/nature11247 · Cited by 18,072
pROC: an open-source package for R and S+ to analyze and compare ROC curves
Robin, X., Turck, N., Hainard, A., Tiberti, N., Lisacek, F., Sanchez, J.-C., & Müller, M. (2011) · BMC Bioinformatics · doi:10.1186/1471-2105-12-77 · Cited by 13,697 · cited 1×
“The performance of each scoring method differentiating functional from non-functional variants was assessed using the average receiver operating characteristic (ROC) curves and the area under curve (AUC) using pROC R package (33).”
MethodShrestha, S., & Offer, S. M. (2016) · Medical Epigenetics · doi:10.1159/000444713 · Cited by 8,914
Ensemble methods in machine learning
Dietterich, T. G. (2000) · Lecture Notes in Computer Science · doi:10.1007/3-540-45014-9_1 · Cited by 8,408
An integrated map of genetic variation from 1,092 human genomes
The 1000 Genomes Project Consortium (2012) · Nature · doi:10.1038/nature11632 · Cited by 7,711 · cited 1×
“For the training set, we extracted all variants from the 1000 Genomes Project data set (28) that were not present in dbNSFP (29) v3.”
MethodIntegrative analysis of 111 reference human epigenomes
Roadmap Epigenomics Consortium, Kundaje, A., Meuleman, W., Ernst, J., Bilenky, M., Yen, A., Heravi-Moussavi, A., Kheradpour, P., Zhang, Z., Wang, J., et al. (2015) · Nature · doi:10.1038/nature14248 · Cited by 6,368 · cited 4×
“(2) Data rescaling: we use the training data set as a reference for all queried variants to be rescaled to.”
BackgroundMethodInfluentialSelf-citationA general framework for estimating the relative pathogenicity of human genetic variants
Kircher, M., Witten, D. M., Jain, P., O'Roak, B. J., Cooper, G. M., & Shendure, J. (2014) · Nature Genetics · doi:10.1038/ng.2892 · Cited by 6,183 · cited 16×
“Next, noncoding functional scores of 11 different scoring systems derived from eight studies, including CADD v1.”
BackgroundMethodInfluentialClinVar: public archive of interpretations of clinically relevant variants
Landrum, M. J., Lee, J. M., Benson, M., Brown, G., Chao, C., Chitipiralla, S., Gu, B., Hart, J., Hoffman, D., Hoover, J., et al. (2016) · Nucleic Acids Research · doi:10.1093/nar/gkv1222 · Cited by 2,758 · cited 1×
“These data sets included noncoding variants from the ClinVar database (31) version 2016/11/01 and National Human Genome Research Institute (NHGRI)-EBI GWAS Catalog (http://www.”
MethodAmelia II: A Program for Missing Data
Honaker, J., King, G., & Blackwell, M. (2011) · Journal of Statistical Software · doi:10.18637/jss.v045.i07 · Cited by 2,552 · cited 1×
“We imputed missing values in the rescaled scoring matrix using the Amelia R package (30).”
MethodAn atlas of active enhancers across human cell types and tissues
The FANTOM Consortium, Andersson, R., Gebhard, C., Miguel-Escalada, I., Hoof, I., Bornholdt, J., Boyd, M., Chen, Y., Zhao, X., Schmidl, C., et al. (2014) · Nature · doi:10.1038/nature12787 · Cited by 2,550 · cited 3×
“(4) Weight estimation via eigendecomposition: the estimated weights for the individual scoring systems were calculated using the eigendecomposition of the covariance matrix.”
BackgroundMethodPredicting effects of noncoding variants with deep learning–based sequence model
Zhou, J., & Troyanskaya, O. G. (2015) · Nature Methods · doi:10.1038/nmeth.3547 · Cited by 2,338 · cited 2×
“3 (17), DeepSEA (21), Eigen (Eigen and Eigen-PC) (25), fitCons (23), FunSeq2 (24), FATHMM-MKL (19), GWAVA (region, TSS and unmatched scores) (18) and ReMM (20) (Supplemental Table S1), are extracted for all noncoding variants allowing missing values for some scores.”
BackgroundMethodCOSMIC: exploring the world's knowledge of somatic mutations in human cancer
Forbes, S. A., Beare, D., Gunasekaran, P., Leung, K., Bindal, N., Boutselakis, H., Ding, M., Bamford, S., Cole, C., Ward, S., et al. (2015) · Nucleic Acids Research · doi:10.1093/nar/gku1075 · Cited by 2,283 · cited 2×
“For cancer data set, we selected noncoding variants curated in the COSMIC database (32) Version 79.”
MethodResultA promoter-level mammalian expression atlas
The FANTOM Consortium and the RIKEN PMI and CLST (DGT) (2014) · Nature · doi:10.1038/nature13182 · Cited by 1,982
Genetic and epigenetic fine mapping of causal autoimmune disease variants
Farh, K. K.-H., Marson, A., Zhu, J., Kleinewietfeld, M., Housley, W. J., Beik, S., Shoresh, N., Whitton, H., Ryan, R. J. H., Shishkin, A. A., et al. (2015) · Nature · doi:10.1038/nature13835 · Cited by 1,956
Highly Recurrent TERT Promoter Mutations in Human Melanoma
Huang, F. W., Hodis, E., Xu, M. J., Kryukov, G. V., Chin, L., & Garraway, L. A. (2013) · Science · doi:10.1126/science.1229259 · Cited by 1,816 · cited 1×
“For example the prevalence of TERT promoter mutations has been established in melanoma (5,6), gliomas and a subset of tumours in tissues with low rates of self-renewal (7).”
BackgroundTERT Promoter Mutations in Familial and Sporadic Melanoma
Horn, S., Figl, A., Rachakonda, P. S., Fischer, C., Sucker, A., Gast, A., Kadel, S., Moll, I., Nagore, E., Hemminki, K., et al. (2013) · Science · doi:10.1126/science.1230062 · Cited by 1,799 · cited 1×
“For example the prevalence of TERT promoter mutations has been established in melanoma (5,6), gliomas and a subset of tumours in tissues with low rates of self-renewal (7).”
BackgroundKillela, P. J., Reitman, Z. J., Jiao, Y., Bettegowda, C., Agrawal, N., Diaz, L. A., Friedman, A. H., Friedman, H., Gallia, G. L., Giovanella, B. C., et al. (2013) · Proceedings of the National Academy of Sciences · doi:10.1073/pnas.1303607110 · Cited by 1,368 · cited 1×
“For example the prevalence of TERT promoter mutations has been established in melanoma (5,6), gliomas and a subset of tumours in tissues with low rates of self-renewal (7).”
BackgroundLiu, X., Wu, C., Li, C., & Boerwinkle, E. (2016) · Human Mutation · doi:10.1002/humu.22932 · Cited by 983
Non-coding recurrent mutations in chronic lymphocytic leukaemia
Puente, X. S., Beà, S., Valdés-Mas, R., Villamor, N., Gutiérrez-Abril, J., Martín-Subero, J. I., Munar, M., Rubio-Pérez, C., Jares, P., Aymerich, M., et al. (2015) · Nature · doi:10.1038/nature14666 · Cited by 829 · cited 12×
“For example, we found in total 64 functional mutations in PAX5 5' upstream/UTR and first intron, and only 7 of these were within the usual aSHM target regions (Additional file 11: Table S8).”
BackgroundInfluentialAn oncogenic super-enhancer formed through somatic mutation of a noncoding intergenic element
Mansour, M. R., Abraham, B. J., Anders, L., Berezovskaya, A., Gutierrez, A., Durbin, A. D., Etchin, J., Lawton, L., Sallan, S. E., Silverman, L. B., et al. (2014) · Science · doi:10.1126/science.1259037 · Cited by 801
Shihab, H. A., Rogers, M. F., Gough, J., Mort, M., Cooper, D. N., Day, I. N. M., Gaunt, T. R., & Campbell, C. (2015) · Bioinformatics · doi:10.1093/bioinformatics/btv009 · Cited by 697 · cited 5×
“These 11 scores were derived from eight studies, CADD, DeepSEA, Eigen, fitCons, FunSeq2, FATHMM-MKL, GWAVA and ReMM (Additional file 1: Table S1).”
BackgroundMethodInfluentialA spectral approach integrating functional genomic annotations for coding and noncoding variants
Ionita-Laza, I., McCallum, K., Xu, B., & Buxbaum, J. D. (2016) · Nature Genetics · doi:10.1038/ng.3477 · Cited by 607 · cited 3×
“Additional methods, like FunSeq2 (24) and Eigen (25), developed a weighted scoring system to combine the relative importance of various annotation features to separate functional and non-functional variants.”
BackgroundMethodGenetics of Follicular Lymphoma Transformation
Pasqualucci, L., Khiabanian, H., Fangazio, M., Vasishtha, M., Messina, M., Holmes, A. B., Ouillette, P., Trifonov, V., Rossi, D., Tabbò, F., et al. (2014) · Cell Reports · doi:10.1016/j.celrep.2013.12.027 · Cited by 573 · cited 1×
“We chose to examine WGS datasets in a haematological cancer, follicular lymphoma (FL) where the landscape of the coding mutations has been extensively studied recently [11, 35-37].”
MethodNon-coding recurrent mutations in chronic lymphocytic leukaemia
Puente, X. S., Beà, S., Valdés-Mas, R., Villamor, N., Gutiérrez-Abril, J., Martín-Subero, J. I., Munar, M., Rubio-Pérez, C., Jares, P., Aymerich, M., et al. (2016) · Nature · doi:10.1038/nature18910 · Cited by 546
Yan, H., Killela, P. J., Reitman, Z. J., Jiao, Y., Bettegowda, C., Agrawal, N., Diaz, L. A., Friedman, A. H., Friedman, H., Gallia, G. L., et al. (2014) · Neuro-Oncology · doi:10.1093/neuonc/nou206.18 · Cited by 529
Functional annotation of noncoding sequence variants
Ritchie, G. R. S., Dunham, I., Zeggini, E., & Flicek, P. (2014) · Nature Methods · doi:10.1038/nmeth.2832 · Cited by 520
A Review of Ensemble Methods in Bioinformatics
Yang, P., Hwa Yang, Y., B. Zhou, B., & Y. Zomaya, A. (2010) · Current Bioinformatics · doi:10.2174/157489310794072508 · Cited by 503 · cited 1×
“Such ensemble based approach with different estimated weights has been shown to perform better than any single component classifier (26), and has been widely used in various bioinformatics problems (44,45).”
MethodGenome-wide analysis of noncoding regulatory mutations in cancer
Weinhold, N., Jacobsen, A., Schultz, N., Sander, C., & Lee, W. (2014) · Nature Genetics · doi:10.1038/ng.3101 · Cited by 484 · cited 1×
“Whole-genome sequencing (WGS) data is increasingly available, especially through TCGA (The Cancer Genome Atlas) and ICGC (International Cancer Genome Consortium), prompting more pan-cancer style studies to look for significantly mutated regulatory elements across cancer types [12-15].”
BackgroundRole of non-coding sequence variants in cancer
Khurana, E., Fu, Y., Chakravarty, D., Demichelis, F., Rubin, M. A., & Gerstein, M. (2016) · Nature Reviews Genetics · doi:10.1038/nrg.2015.17 · Cited by 468 · cited 1×
“However, identifying potential noncoding pathogenic/driver/functional variants and distinguishing them from benign/passenger/non-functional variants, remains challenging, due to their abundance, cell/tissue type specificity and complex modes of action (16).”
BackgroundA method to predict the impact of regulatory variants from DNA sequence
Lee, D., Gorkin, D. U., Baker, M., Strober, B. J., Asoni, A. L., McCallion, A. S., & Beer, M. A. (2015) · Nature Genetics · doi:10.1038/ng.3331 · Cited by 436 · cited 3×
“Other methods, such as DeepSEA [21] and DeltaSVM [22], chose to directly learn regulatory sequence codes from large-scale chromatin-profiling data generated from ENCODE, while FitCons [23] opted to estimate the selective pressure for those functionally important genomic regions on the basis of patterns of polymorphism…”
MethodTargeting of somatic hypermutation
Odegard, V. H., & Schatz, D. G. (2006) · Nature Reviews Immunology · doi:10.1038/nri1896 · Cited by 377 · cited 11×
“For example, we found in total 64 functional mutations in PAX5 5' upstream/UTR and first intron, and only 7 of these were within the usual aSHM target regions (Additional file 11: Table S8).”
BackgroundInfluentialGreen, M. R., Kihira, S., Liu, C. L., Nair, R. V., Salari, R., Gentles, A. J., Irish, J., Stehr, H., Vicente-Dueñas, C., Romero-Camarero, I., et al. (2015) · Proceedings of the National Academy of Sciences · doi:10.1073/pnas.1501199112 · Cited by 355 · cited 1×
“We chose to examine WGS datasets in a haematological cancer, follicular lymphoma (FL) where the landscape of the coding mutations has been extensively studied recently [11, 35-37].”
MethodFunSeq2: A framework for prioritizing noncoding regulatory variants in cancer
Fu, Y., Liu, Z., Lou, S., Bedford, J., Mu, X., Yip, K. Y., Khurana, E., & Gerstein, M. (2014) · Genome Biology · doi:10.1186/preaccept-1739683221127290 · Cited by 352 · cited 10×
“These 11 scores were derived from eight studies, CADD, DeepSEA, Eigen, fitCons, FunSeq2, FATHMM-MKL, GWAVA and ReMM (Additional file 1: Table S1).”
BackgroundMethodInfluentialHuang, Y.-F., Gulko, B., & Siepel, A. (2017) · Nature Genetics · doi:10.1038/ng.3810 · Cited by 344 · cited 1×
“We also benchmarked variant distinguishing performances between IW-Scoring and LINSIGHT (35), a very recent noncoding variant scoring method based on the existing INSIGHT-fitCons evolutionary conservation framework but with vastly improved prediction power.”
MethodRachakonda, P. S., Hosen, I., de Verdier, P. J., Fallah, M., Heidenreich, B., Ryk, C., Wiklund, N. P., Steineck, G., Schadendorf, D., Hemminki, K., et al. (2013) · Proceedings of the National Academy of Sciences · doi:10.1073/pnas.1310522110 · Cited by 340 · cited 1×
“Moreover, TERT promoter mutations significantly correlate with survival and disease recurrence in bladder cancer, demonstrating the clinical significance for noncoding mutations (8).”
BackgroundRecurrent and functional regulatory mutations in breast cancer
Rheinbay, E., Parasuraman, P., Grimsby, J., Tiao, G., Engreitz, J. M., Kim, J., Lawrence, M. S., Taylor-Weiner, A., Rodriguez-Cuevas, S., Rosenberg, M., et al. (2017) · Nature · doi:10.1038/nature22992 · Cited by 307 · cited 2×
“First we used a cohort of 14 WGS cancer samples from six FL patients from our previous study (11).”
BackgroundMethodA statistical consideration in psychological research.
Wilkinson, B. (1951) · Psychological Bulletin · doi:10.1037/h0059111 · Cited by 287 · cited 1×
“Overall, Pvalues for pathogenic variants were much more significant than those for benign variants (combined P-value using Wilkinson’s method (15), P = 0.”
Smedley, D., Schubach, M., Jacobsen, J. O. B., Köhler, S., Zemojtel, T., Spielmann, M., Jäger, M., Hochheiser, H., Washington, N. L., McMurry, J. A., et al. (2016) · The American Journal of Human Genetics · doi:10.1016/j.ajhg.2016.07.005 · Cited by 283 · cited 19×
“The extent of this difference was the highest for ReMM and IW-Scoring compared to others (Fig.”
BackgroundMethodInfluentialGulko, B., Hubisz, M. J., Gronau, I., & Siepel, A. (2015) · Nature Genetics · doi:10.1038/ng.3196 · Cited by 279 · cited 4×
“Other methods, such as DeepSEA [21] and DeltaSVM [22], chose to directly learn regulatory sequence codes from large-scale chromatin-profiling data generated from ENCODE, while FitCons [23] opted to estimate the selective pressure for those functionally important genomic regions on the basis of patterns of polymorphism…”
BackgroundMethodInfluentialRecurrent somatic mutations in regulatory regions of human cancer genomes
Melton, C., Reuter, J. A., Spacek, D. V., & Snyder, M. (2015) · Nature Genetics · doi:10.1038/ng.3332 · Cited by 236 · cited 1×
“Whole-genome sequencing (WGS) data is increasingly available, especially through TCGA (The Cancer Genome Atlas) and ICGC (International Cancer Genome Consortium), prompting more pan-cancer style studies to look for significantly mutated regulatory elements across cancer types [12-15].”
BackgroundEvidence of Abundant Purifying Selection in Humans for Recently Acquired Regulatory Functions
Ward, L. D., & Kellis, M. (2012) · Science · doi:10.1126/science.1225057 · Cited by 209 · cited 1×
“Our impression is that evolution and conservation based measures, like fitCons, may not be appropriate choice to score functional noncoding variants, as the regulatory elements are often lineage/species-specific (34).”
BackgroundDayem Ullah, A. Z., Lemoine, N. R., & Chelala, C. (2012) · Nucleic Acids Research · doi:10.1093/nar/gks364 · Cited by 185 · cited 3×
“Data Sources Gene coding annotation source We use Ensembl (version 75) gene annotation model to annotate variants with SNPnexus and select noncoding variations.”
MethodInfluentialSelf-citationRecurrent somatic mutations affecting B-cell receptor signaling pathway genes in follicular lymphoma
Krysiak, K., Gomez, F., White, B. S., Matlock, M., Miller, C. A., Trani, L., Fronick, C. C., Fulton, R. S., Kreisel, F., Cashen, A. F., et al. (2017) · Blood · doi:10.1182/blood-2016-07-729954 · Cited by 183 · cited 1×
“We chose to examine WGS datasets in a haematological cancer, follicular lymphoma (FL) where the landscape of the coding mutations has been extensively studied recently [11, 35-37].”
MethodRecurrent targets of aberrant somatic hypermutation in lymphoma
Hadj Khodabakhshi, A., Morin, R. D., Fejes, A. P., Mungall, A. J., Mungall, K. L., Bolger-Munro, M., Johnson, N. A., Connors, J. M., Gascoyne, R. D., Marra, M. A., et al. (2012) · Oncotarget · doi:10.18632/oncotarget.653 · Cited by 155 · cited 11×
“For example, we found in total 64 functional mutations in PAX5 5' upstream/UTR and first intron, and only 7 of these were within the usual aSHM target regions (Additional file 11: Table S8).”
BackgroundInfluentialTERT promoter mutations and monoallelic activation of TERT in cancer
Huang, F. W., Bielski, C. M., Rinne, M. L., Hahn, W. C., Sellers, W. R., Stegmeier, F., Garraway, L. A., & Kryukov, G. V. (2015) · Oncogenesis · doi:10.1038/oncsis.2015.39 · Cited by 97 · cited 1×
“(37), as well as the known SNPs in this region, including ∼15 kb up- and downstream flanking regions.”
BackgroundAraya, C. L., Cenik, C., Reuter, J., Kiss, G., Pande, V. S., Snyder, M. P., & Greenleaf, W. J. (2015) · Nature Genetics · doi:10.1038/ng.3471 · Cited by 89
Chen, L., Jin, P., & Qin, Z. S. (2016) · Genome biology · doi:10.1186/s13059-016-1112-z · Cited by 73 · cited 2×
“Such ensemble based approach with different estimated weights has been shown to perform better than any single component classifier (26), and has been widely used in various bioinformatics problems (44,45).”
MethodRecurrent noncoding regulatory mutations in pancreatic ductal adenocarcinoma
Feigin, M. E., Garvin, T., Bailey, P., Waddell, N., Chang, D. K., Kelley, D. R., Shuai, S., Gallinger, S., McPherson, J. D., Grimmond, S. M., et al. (2017) · Nature Genetics · doi:10.1038/ng.3861 · Cited by 61 · cited 1×
“This combinational approach has recently been applied to identify recurrent noncoding regulatory mutations in pancreatic cancer (47).”
BackgroundEpigenetic Dysregulation in Follicular Lymphoma
Araf, S., Okosun, J., Koniali, L., Fitzgibbon, J., & Heward, J. A. (2015) · Epigenomics · doi:10.2217/epi.15.96 · Cited by 25 · cited 1×
“More than 90% of the tumours have mutations in genes encoding epigenetic regulators suggests that these tumours rely on epigenetic deregulation (41).”
BackgroundKnecht, C., Mort, M. E., Junge, O., Cooper, D. N., Krawczak, M., & Caliebe, A. (2016) · Nucleic Acids Research · doi:10.1093/nar/gkw886 · Cited by 16
Cited by
Genome-wide Association Analysis in Humans Links Nucleotide Metabolism to Leukocyte Telomere Length
Li, C., Stoma, S., Lotta, L. A., Warner, S., Albrecht, E., Allione, A., Arp, P. P., Broer, L., Buxton, J. L., Da Silva Couto Alves, A., et al. (2020) · The American Journal of Human Genetics · doi:10.1016/j.ajhg.2020.02.006 · Cited by 162
“For non-coding variants, we performed integrated analysis with SNP Nexus IW scoring.(40) Transcriptomic Data Integration (1) With summary statistics, we performed a gene-level analysis,”
MethodOperational excellence in a green supply chain for environmental management: A case study
Kazançoğlu, Y., Sağnak, M., Kayıkçı, Y., & Mangla, S. K. (2020) · Business Strategy and the Environment · doi:10.1002/bse.2451 · Cited by 74
Zhang, S., He, Y., Liu, H., Zhai, H., Huang, D., Yi, X., Dong, X., Wang, Z., Zhao, K., Zhou, Y., et al. (2019) · Nucleic Acids Research · doi:10.1093/nar/gkz774 · Cited by 58
“We compared our composite models with integrated tools and two existing ensemble methods (PRVCS (11) and IW-Scoring (12)) using above six independent testing datasets.”
MethodSelf-citationAbbas, S. R., Abbas, Z., Zahir, A., & Lee, S. W. (2025) · Briefings in Bioinformatics · doi:10.1093/bib/bbaf329 · Cited by 30
“Figure 8 compares the current focus and future potential across six key directions in genomic research and ML [14, 146– 149].”
Ostinelli, G., Vijay, J., Vohl, M., Grundberg, E., & Tchernof, A. (2021) · Molecular and Cellular Endocrinology · doi:10.1016/j.mce.2021.111220 · Cited by 32
“We prioritized variants in high LD using scoring algorithms such as RegulomeDB (Boyle et al., 2012; Dong and Boyle, 2019) and IW scoring system (Wang et al., 2018).”
MethodInfluential
Metadata
- Authors
- Wang, J., Dayem Ullah, A. Z., & Chelala, C.
- Affiliations
- Queen Mary University of London (GB)
- Centre for Molecular Oncology, Barts Cancer Institute, Queen Mary University of London, Charterhouse Square, London EC1M 6BQ, UK
- Corresponding author
- Wang, Jun
- Venue
- Nucleic Acids Research
- Publisher
- Oxford University Press (OUP)
- Published
- 2018-01-30
- Volume
- 46
- Issue
- 8
- Pages
- e47-e47
- ISSN
- 0305-1048 (ISSN-L)
- 1362-4962
- PMC
- PMC5934661
- OpenAlex
- W2951354947
- Cited by
- 35
- References
- 50
- Citations by year
- 2026: 2 · 2025: 4 · 2024: 1 · 2023: 4 · 2022: 6 · 2021: 6 · 2020: 6 · 2019: 5 · 2018: 1
- FWCI
- 2.75
- Type
- journal article
- Language
- en
- Open access
- gold
- doi.org
- Licence
- Locations
- Nucleic Acids Research (publishedVersion, cc-by)
- bioRxiv (Cold Spring Harbor Laboratory) (acceptedVersion, cc-by-nc-nd)
- Europe PMC (PubMed Central) (publishedVersion, cc-by)
- PubMed Central (publishedVersion, cc-by)
- PubMed (publishedVersion)
- Queen Mary Research Online (Queen Mary University of London) (submittedVersion, cc-by)
- Funders
- Cancer Research UK (C16420/A18066)
- Barts and The London Charity (MGU0344)
- Topics
- Life Sciences › Biochemistry, Genetics and Molecular Biology › Genetics › Genomics and Rare Diseases
- Life Sciences › Biochemistry, Genetics and Molecular Biology › Genetics › Genetic Associations and Epidemiology
- Life Sciences › Biochemistry, Genetics and Molecular Biology › Molecular Biology › Genomics and Chromatin Dynamics
- Keywords
- non-coding variants, variant prioritization, variant annotation, weighted scoring model, spectral clustering, TERT promoter mutation, follicular lymphoma, recurrent mutations, disease-associated SNPs, regulatory motifs, somatic mutations
- MeSH terms
- Whole Genome Sequencing, Humans, Lymphoma, Follicular, Models, Genetic, Mutation, Neoplasms, Promoter Regions, Genetic, Regulatory Sequences, Nucleic Acid, Genetic Variation, Genome, Human, Telomerase, Computational Biology, Polymorphism, Single Nucleotide, DNA, Intergenic, Databases, Nucleic Acid, Genome-Wide Association Study
About these checks
Registry, retraction, Cites and statistics results are computed, not judged, with one exception: a printed reference that no index lists is read once by a model before it counts as a citation error. Claims are extracted by a model and kept only when their quote appears verbatim in the text; each cited source is then checked, with a model’s help, for whether it says what the claim relies on. Those verdicts can be wrong — read the claim’s quote and the cited source before relying on one.
Statistics and arithmetic are recomputed, not judged.
Confidence bands are shown only for fields calibrated on our annotated test set. None is calibrated yet, so no band is shown.
What counts as a claim ›How we measure confidence ›How we check this ›
Are you an author, or do you see a problem with this page? Request a review
Data sources
Bibliographic data: Semantic Scholar, OpenAlex, Crossref.
Contains information from the Semantic Scholar Academic Graph Datasets, made available under the ODC Attribution License (ODC-BY 1.0).
Semantic Scholar’s data is described in: Kinney, R., et al. (2023). The Semantic Scholar Open Data Platform. arXiv:2301.10140.
