

The best practice for microbiome analysis using R
Open accessThe DOI matches its Crossref record; 64 of the 65 references it cites were found in a registry or an index.
Abstract
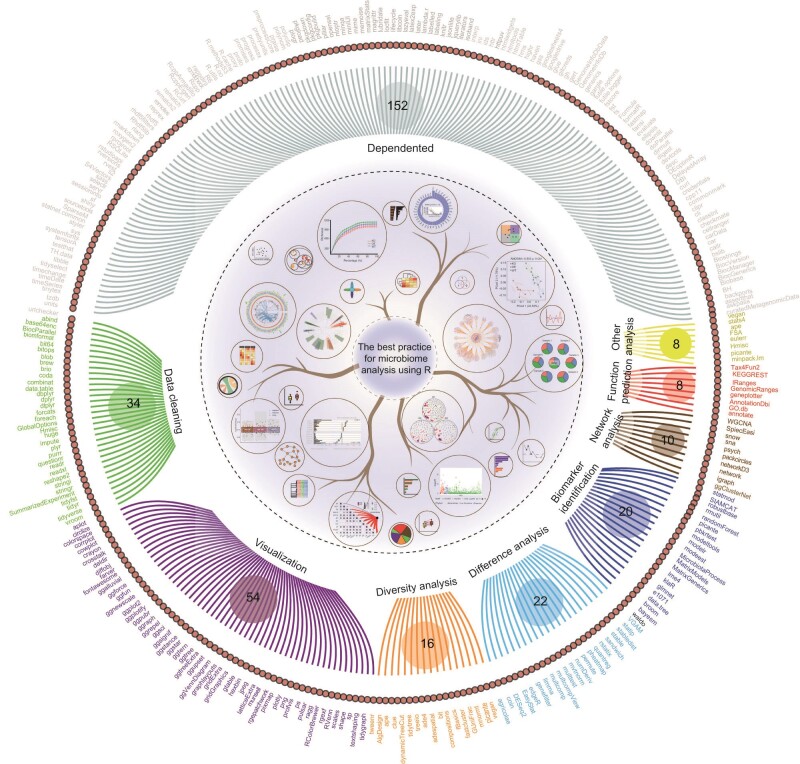
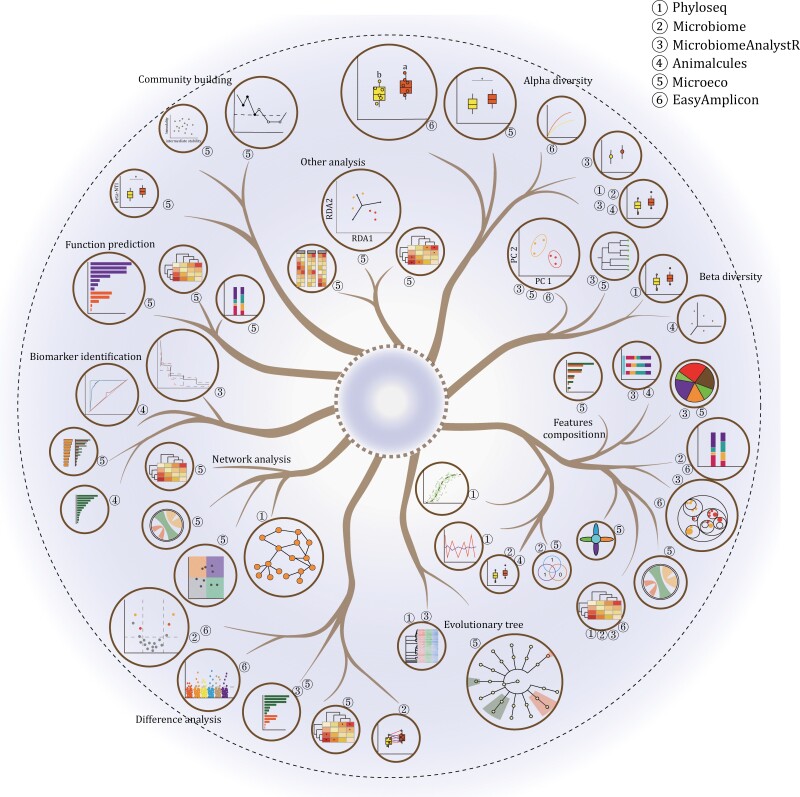
With the gradual maturity of sequencing technology, many microbiome studies have published, driving the emergence and advance of related analysis tools. R language is the widely used platform for microbiome data analysis for powerful functions. However, tens of thousands of R packages and numerous similar analysis tools have brought major challenges for many researchers to explore microbiome data. How to choose suitable, efficient, convenient, and easy-to-learn tools from the numerous R packages has become a problem for many microbiome researchers. We have organized 324 common R packages for microbiome analysis and classified them according to application categories (diversity, difference, biomarker, correlation and network, functional prediction, and others), which could help researchers quickly find relevant R packages for microbiome analysis. Furthermore, we systematically sorted the integrated R packages (phyloseq, microbiome, MicrobiomeAnalystR, Animalcules, microeco, and amplicon) for microbiome analysis, and summarized the advantages and limitations, which will help researchers choose the appropriate tools. Finally, we thoroughly reviewed the R packages for microbiome analysis, summarized most of the common analysis content in the microbiome, and formed the most suitable pipeline for microbiome analysis. This paper is accompanied by hundreds of examples with 10,000 lines codes in GitHub, which can help beginners to learn, also help analysts compare and test different tools. This paper systematically sorts the application of R in microbiome, providing an important theoretical basis and practical reference for the development of better microbiome tools in the future. All the code is available at GitHub github.com/taowenmicro/EasyMicrobiomeR.
Overview
The claims and statistics of this paper haven’t been checked yet.
Free: it reads the open-access text and checks the first 5 claims that cite a source we can check. Create a free account to check every claim.
Integrity signals
Registry
Cites
Statistics
Figures



Verification
Claims the paper makes
The claims and statistics of this paper haven’t been checked yet.
Free: it reads the open-access text and checks the first 5 claims that cite a source we can check. Create a free account to check every claim.
Claims other papers make about this one
Each is checked against this paper’s own text: does it say what the citing paper says it does?
The source backs part of the claim, not all of it — or backs it for a different population, condition or comparison.
In the citing paper
“The main technologies in the microbiome field are metagenomic sequencing and 16 S rRNA sequencing [148–150]”
From Single-cell sequencing to multi-omics: technologies and applications (2024) · cites this paper as [149]
Experimental — accuracy not yet measured
Self-check
Percentages, sums and reported differences re-computed from the paper’s own numbers.
The self-check needs the paper’s full text.
Citations
Cites
Moderated estimation of fold change and dispersion for RNA-seq data with DESeq2
Love, M. I., Huber, W., & Anders, S. (2014) · Genome Biology · doi:10.1186/s13059-014-0550-8 · Cited by 95,106
Robinson, M. D., McCarthy, D. J., & Smyth, G. K. (2010) · Bioinformatics · doi:10.1093/bioinformatics/btp616 · Cited by 41,364
DADA2: High–resolution sample inference from Illumina amplicon data
Callahan, B. J., McMurdie, P. J., Rosen, M. J., Han, A. W., Johnson, A. J. A., & Holmes, S. P. (2016) · Nature Methods · doi:10.1038/nmeth.3869 · Cited by 35,698
QIIME allows analysis of high-throughput community sequencing data
Caporaso, J. G., Kuczynski, J., Stombaugh, J., Bittinger, K., Bushman, F. D., Costello, E. K., Fierer, N., Peña, A. G., Goodrich, J. K., Gordon, J. I., et al. (2010) · Nature Methods · doi:10.1038/nmeth.f.303 · Cited by 34,887
WGCNA: an R package for weighted correlation network analysis
Langfelder, P., & Horvath, S. (2008) · BMC Bioinformatics · doi:10.1186/1471-2105-9-559 · Cited by 27,252
Reproducible, interactive, scalable and extensible microbiome data science using QIIME 2
Bolyen, E., Rideout, J. R., Dillon, M. R., Bokulich, N. A., Abnet, C. C., Al-Ghalith, G. A., Alexander, H., Alm, E. J., Arumugam, M., Asnicar, F., et al. (2019) · Nature Biotechnology · doi:10.1038/s41587-019-0209-9 · Cited by 23,742
Self-citationphyloseq: An R Package for Reproducible Interactive Analysis and Graphics of Microbiome Census Data
McMurdie, P. J., & Holmes, S. (2013) · PLoS ONE · doi:10.1371/journal.pone.0061217 · Cited by 21,322
Search and clustering orders of magnitude faster than BLAST
Edgar, R. C. (2010) · Bioinformatics · doi:10.1093/bioinformatics/btq461 · Cited by 20,826
Schloss, P. D., Westcott, S. L., Ryabin, T., Hall, J. R., Hartmann, M., Hollister, E. B., Lesniewski, R. A., Oakley, B. B., Parks, D. H., Robinson, C. J., et al. (2009) · Applied and Environmental Microbiology · doi:10.1128/aem.01541-09 · Cited by 19,549
Classification and Regression by randomForest
Liaw, A. I., & Wiener, M. C. (2007) · Cited by 18,594
THE USE OF MULTIPLE MEASUREMENTS IN TAXONOMIC PROBLEMS
FISHER, R. A. (1936) · Annals of Eugenics · doi:10.1111/j.1469-1809.1936.tb02137.x · Cited by 15,227
pROC: an open-source package for R and S+ to analyze and compare ROC curves
Robin, X., Turck, N., Hainard, A., Tiberti, N., Lisacek, F., Sanchez, J.-C., & Müller, M. (2011) · BMC Bioinformatics · doi:10.1186/1471-2105-12-77 · Cited by 13,697
R: A Language for Data Analysis and Graphics
Ihaka, R., & Gentleman, R. (1996) · Journal of Computational and Graphical Statistics · doi:10.1080/10618600.1996.10474713 · Cited by 11,220
VSEARCH: a versatile open source tool for metagenomics
(2016) · doi:10.7717/peerj.2584 · Cited by 10,773
Building Predictive Models in R Using the caret Package
Kuhn, M. (2008) · Journal of Statistical Software · doi:10.18637/jss.v028.i05 · Cited by 8,863
Picante: R tools for integrating phylogenies and ecology
Kembel, S. W., Cowan, P. D., Helmus, M. R., Cornwell, W. K., Morlon, H., Ackerly, D. D., Blomberg, S. P., & Webb, C. O. (2010) · Bioinformatics · doi:10.1093/bioinformatics/btq166 · Cited by 6,243
The ade4 Package: Implementing the Duality Diagram for Ecologists
Dray, S., & Dufour, A.-B. (2007) · Journal of Statistical Software · doi:10.18637/jss.v022.i04 · Cited by 6,211
FUNGuild: An open annotation tool for parsing fungal community datasets by ecological guild
Nguyen, N. H., Song, Z., Bates, S. T., Branco, S., Tedersoo, L., Menke, J., Schilling, J. S., & Kennedy, P. G. (2016) · Fungal Ecology · doi:10.1016/j.funeco.2015.06.006 · Cited by 4,530
Kraken: ultrafast metagenomic sequence classification using exact alignments
Wood, D. E., & Salzberg, S. L. (2014) · Genome Biology · doi:10.1186/gb-2014-15-3-r46 · Cited by 4,521
Wickham, H. (2011) · WIREs Computational Statistics · doi:10.1002/wics.147 · Cited by 4,304
circlize implements and enhances circular visualization in R
Gu, Z., Gu, L., Eils, R., Schlesner, M., & Brors, B. (2014) · Bioinformatics · doi:10.1093/bioinformatics/btu393 · Cited by 4,246
UpSetR: an R package for the visualization of intersecting sets and their properties
Conway, J. R., Lex, A., & Gehlenborg, N. (2017) · Bioinformatics · doi:10.1093/bioinformatics/btx364 · Cited by 3,586
Decoupling function and taxonomy in the global ocean microbiome
Louca, S., Parfrey, L. W., & Doebeli, M. (2016) · Science · doi:10.1126/science.aaf4507 · Cited by 3,510
MEGAN analysis of metagenomic data
Huson, D. H., Auch, A. F., Qi, J., & Schuster, S. C. (2007) · Genome Research · doi:10.1101/gr.5969107 · Cited by 3,312
VennDiagram: a package for the generation of highly-customizable Venn and Euler diagrams in R
Chen, H., & Boutros, P. C. (2011) · BMC Bioinformatics · doi:10.1186/1471-2105-12-35 · Cited by 3,131
Reshaping Data with the reshape Package
Wickham, H. (2007) · Journal of Statistical Software · doi:10.18637/jss.v021.i12 · Cited by 2,880
Fast Genome-Wide Functional Annotation through Orthology Assignment by eggNOG-Mapper
Huerta-Cepas, J., Forslund, K., Coelho, L. P., Szklarczyk, D., Jensen, L. J., von Mering, C., & Bork, P. (2017) · Molecular Biology and Evolution · doi:10.1093/molbev/msx148 · Cited by 2,709
The Split-Apply-Combine Strategy for Data Analysis
Wickham, H. (2011) · Journal of Statistical Software · doi:10.18637/jss.v040.i01 · Cited by 2,705
A communal catalogue reveals Earth's multiscale microbial diversity
Thompson, L. R., Sanders, J. G., McDonald, D., Amir, A., Ladau, J., Locey, K. J., Prill, R. J., Tripathi, A., Gibbons, S. M., Ackermann, G., et al. (2017) · Nature · doi:10.1038/nature24621 · Cited by 2,684
Self-citationQuantifying community assembly processes and identifying features that impose them
Stegen, J. C., Lin, X., Fredrickson, J. K., Chen, X., Kennedy, D. W., Murray, C. J., Rockhold, M. L., & Konopka, A. (2013) · The ISME Journal · doi:10.1038/ismej.2013.93 · Cited by 2,535
MetaPhlAn2 for enhanced metagenomic taxonomic profiling
Truong, D. T., Franzosa, E. A., Tickle, T. L., Scholz, M., Weingart, G., Pasolli, E., Tett, A., Huttenhower, C., & Segata, N. (2015) · Nature Methods · doi:10.1038/nmeth.3589 · Cited by 2,185
Gu, Z. (2022) · iMeta · doi:10.1002/imt2.43 · Cited by 1,885
Deblur Rapidly Resolves Single-Nucleotide Community Sequence Patterns
Amir, A., McDonald, D., Navas-Molina, J. A., Kopylova, E., Morton, J. T., Zech Xu, Z., Kightley, E. P., Thompson, L. R., Hyde, E. R., Gonzalez, A., et al. (2017) · mSystems · doi:10.1128/msystems.00191-16 · Cited by 1,881
Bayesian community-wide culture-independent microbial source tracking
Knights, D., Kuczynski, J., Charlson, E. S., Zaneveld, J., Mozer, M. C., Collman, R. G., Bushman, F. D., Knight, R., & Kelley, S. T. (2011) · Nature Methods · doi:10.1038/nmeth.1650 · Cited by 1,856
Sparse and Compositionally Robust Inference of Microbial Ecological Networks
Kurtz, Z. D., Müller, C. L., Miraldi, E. R., Littman, D. R., Blaser, M. J., & Bonneau, R. A. (2015) · PLOS Computational Biology · doi:10.1371/journal.pcbi.1004226 · Cited by 1,799
Chong, J., Liu, P., Zhou, G., & Xia, J. (2020) · Nature Protocols · doi:10.1038/s41596-019-0264-1 · Cited by 1,702
Species-level functional profiling of metagenomes and metatranscriptomes
Franzosa, E. A., McIver, L. J., Rahnavard, G., Thompson, L. R., Schirmer, M., Weingart, G., Lipson, K. S., Knight, R., Caporaso, J. G., Segata, N., et al. (2018) · Nature Methods · doi:10.1038/s41592-018-0176-y · Cited by 1,693
microeco: an R package for data mining in microbial community ecology
Liu, C., Cui, Y., Li, X., & Yao, M. (2021) · FEMS Microbiology Ecology · doi:10.1093/femsec/fiaa255 · Cited by 1,655
Tax4Fun: predicting functional profiles from metagenomic 16S rRNA data
Aßhauer, K. P., Wemheuer, B., Daniel, R., & Meinicke, P. (2015) · Bioinformatics · doi:10.1093/bioinformatics/btv287 · Cited by 1,578
Ning, D., Yuan, M., Wu, L., Zhang, Y., Guo, X., Zhou, X., Yang, Y., Arkin, A. P., Firestone, M. K., & Zhou, J. (2020) · Nature Communications · doi:10.1038/s41467-020-18560-z · Cited by 1,409
The Integrative Human Microbiome Project
The Integrative HMP (iHMP) Research Network Consortium, Proctor, L. M., Creasy, H. H., Fettweis, J. M., Lloyd-Price, J., Mahurkar, A., Zhou, W., Buck, G. A., Snyder, M. P., Strauss, J. F., et al. (2019) · Nature · doi:10.1038/s41586-019-1238-8 · Cited by 1,381
Error filtering, pair assembly and error correction for next-generation sequencing reads
Edgar, R. C., & Flyvbjerg, H. (2015) · Bioinformatics · doi:10.1093/bioinformatics/btv401 · Cited by 1,275
Pathogen-induced activation of disease-suppressive functions in the endophytic root microbiome
Carrión, V. J., Perez-Jaramillo, J., Cordovez, V., Tracanna, V., de Hollander, M., Ruiz-Buck, D., Mendes, L. W., van Ijcken, W. F. J., Gomez-Exposito, R., Elsayed, S. S., et al. (2019) · Science · doi:10.1126/science.aaw9285 · Cited by 1,147
Microbiome differential abundance methods produce different results across 38 datasets
Nearing, J. T., Douglas, G. M., Hayes, M. G., MacDonald, J., Desai, D. K., Allward, N., Jones, C. M. A., Wright, R. J., Dhanani, A. S., Comeau, A. M., et al. (2022) · Nature Communications · doi:10.1038/s41467-022-28034-z · Cited by 992
A practical guide to amplicon and metagenomic analysis of microbiome data
Liu, Y.-X., Qin, Y., Chen, T., Lu, M., Qian, X., Guo, X., & Bai, Y. (2021) · Protein & Cell · doi:10.1007/s13238-020-00724-8 · Cited by 864
Self-citationWemheuer, F., Taylor, J. A., Daniel, R., Johnston, E., Meinicke, P., Thomas, T., & Wemheuer, B. (2020) · Environmental Microbiome · doi:10.1186/s40793-020-00358-7 · Cited by 749
FEAST: fast expectation-maximization for microbial source tracking
Shenhav, L., Thompson, M., Joseph, T. A., Briscoe, L., Furman, O., Bogumil, D., Mizrahi, I., Pe’er, I., & Halperin, E. (2019) · Nature Methods · doi:10.1038/s41592-019-0431-x · Cited by 644
Microbial community assembly and metabolic function during mammalian corpse decomposition
Metcalf, J. L., Xu, Z. Z., Weiss, S., Lax, S., Van Treuren, W., Hyde, E. R., Song, S. J., Amir, A., Larsen, P., Sangwan, N., et al. (2016) · Science · doi:10.1126/science.aad2646 · Cited by 551
microViz: an R package for microbiome data visualization and statistics
Barnett, D., Arts, I., & Penders, J. (2021) · Journal of Open Source Software · doi:10.21105/joss.03201 · Cited by 519
Accessible, curated metagenomic data through ExperimentHub
Pasolli, E., Schiffer, L., Manghi, P., Renson, A., Obenchain, V., Truong, D. T., Beghini, F., Malik, F., Ramos, M., Dowd, J. B., et al. (2017) · Nature Methods · doi:10.1038/nmeth.4468 · Cited by 514
Ggtree : A serialized data object for visualization of a phylogenetic tree and annotation data
Xu, S., Li, L., Luo, X., Chen, M., Tang, W., Zhan, L., Dai, Z., Lam, T. T., Guan, Y., & Yu, G. (2022) · iMeta · doi:10.1002/imt2.56 · Cited by 489
ggtern: Ternary Diagrams Using ggplot2
Hamilton, N. E., & Ferry, M. (2018) · Journal of Statistical Software · doi:10.18637/jss.v087.c03 · Cited by 488
Wen, T., Xie, P., Yang, S., Niu, G., Liu, X., Ding, Z., Xue, C., Liu, Y., Shen, Q., & Yuan, J. (2022) · iMeta · doi:10.1002/imt2.32 · Cited by 478
Self-citationBiosynthetic potential of the global ocean microbiome
Paoli, L., Ruscheweyh, H.-J., Forneris, C. C., Hubrich, F., Kautsar, S., Bhushan, A., Lotti, A., Clayssen, Q., Salazar, G., Milanese, A., et al. (2022) · Nature · doi:10.1038/s41586-022-04862-3 · Cited by 384
EVenn: Easy to create repeatable and editable Venn diagrams and Venn networks online
Chen, T., Zhang, H., Liu, Y., Liu, Y.-X., & Huang, L. (2021) · Journal of Genetics and Genomics · doi:10.1016/j.jgg.2021.07.007 · Cited by 362
Self-citationAnalysis of microbial compositions: a review of normalization and differential abundance analysis
Lin, H., & Peddada, S. D. (2020) · npj Biofilms and Microbiomes · doi:10.1038/s41522-020-00160-w · Cited by 341
MicrobiotaProcess: A comprehensive R package for deep mining microbiome
Xu, S., Zhan, L., Tang, W., Wang, Q., Dai, Z., Zhou, L., Feng, T., Chen, M., Wu, T., Hu, E., et al. (2023) · The Innovation · doi:10.1016/j.xinn.2023.100388 · Cited by 308
Liu, Y., Chen, L., Ma, T., Li, X., Zheng, M., Zhou, X., Chen, L., Qian, X., Xi, J., Lu, H., et al. (2023) · iMeta · doi:10.1002/imt2.83 · Cited by 273
Self-citationWirbel, J., Zych, K., Essex, M., Karcher, N., Kartal, E., Salazar, G., Bork, P., Sunagawa, S., & Zeller, G. (2021) · Genome Biology · doi:10.1186/s13059-021-02306-1 · Cited by 269
Model-based boosting in R: a hands-on tutorial using the R package mboost
Hofner, B., Mayr, A., Robinzonov, N., & Schmid, M. (2014) · Computational Statistics · doi:10.1007/s00180-012-0382-5 · Cited by 258
Parallel‐Meta Suite: Interactive and rapid microbiome data analysis on multiple platforms
Chen, Y., Li, J., Zhang, Y., Zhang, M., Sun, Z., Jing, G., Huang, S. W., & Su, X. (2022) · iMeta · doi:10.1002/imt2.1 · Cited by 56
animalcules: interactive microbiome analytics and visualization in R
Zhao, Y., Federico, A. N., Faits, T., Manimaran, S., Segrè, D., Monti, S., & Johnson, W. E. (2021) · Microbiome · doi:10.1186/s40168-021-01013-0 · Cited by 50
GGraph: An Efficient Structure-Aware Approach for Iterative Graph Processing
Si, B., Liang, Y., Zhao, J., Zhang, Y., Liao, X., Jin, H., Liu, H., & Gu, L. (2020) · IEEE Transactions on Big Data · doi:10.1109/tbdata.2020.3019641 · Cited by 26
Li, W.-J., Wang, L., Li, X., Zheng, X. S., Cohen, M. F., & Liu, Y. (2022) · Genomics Proteomics & Bioinformatics · doi:10.1016/j.gpb.2022.08.006 · Cited by 20
Self-citation
Research works printed but not linked: 7
- Dimitriadou E, Hornik K, Leisch F et al. Misc functions of the Department of Statistics (e1071), TU Wien. R Package 2008; 1: 5– 24.
- Dray S, Blanchet G, Borcard D et al. Package ‘adespatial’. R Package 2018; 1: 3– 8.
- Harrell Jr FE, Harrell Jr MFE. Package ‘hmisc’. CRAN2018 2019; 2019: 235– 236.
- Oksanen J, Kindt R, Legendre P et al. The vegan package. Community Ecol Package 2007; 10: 719.
- Pages H, Aboyoun P, Gentleman R et al. Biostrings: string objects representing biological sequences, and matching algorithms. R Package Version 2016; 2: 10.18129.
- Revelle W, Revelle MW. Package ‘psych’. The Compr R Archive Netw 2015; 337: 338.
- Ripley B, Venables B, Bates DM et al. Package ‘mass’. Cran R 2013; 538: 113– 120.
Cited by
Wekemo Bioincloud: A user‐friendly platform for meta‐omics data analyses
Gao, Y., Zhang, G., Jiang, S., & Liu, Y. (2024) · iMeta · doi:10.1002/imt2.175 · Cited by 293
Self-citationSingle-cell sequencing to multi-omics: technologies and applications
Wu, X., Yang, X., Dai, Y., Zhao, Z., Zhu, J., Guo, H., & Yang, R. (2024) · Biomarker Research · doi:10.1186/s40364-024-00643-4 · Cited by 222
Visualizing set relationships: EVenn's comprehensive approach to Venn diagrams
Yang, M., Chen, T., Liu, Y., & Huang, L. (2024) · iMeta · doi:10.1002/imt2.184 · Cited by 163
Self-citationNanopore sequencing: flourishing in its teenage years
Zhang, T., Li, H., Jiang, M., Hou, H., Gao, Y., Li, Y., Wang, F., Wang, J., Peng, K., & Liu, Y. (2024) · Journal of genetics and genomics/Journal of Genetics and Genomics · doi:10.1016/j.jgg.2024.09.007 · Cited by 134
Self-citationZhong, S. S., Sun, Y., Huo, J., Xu, W., Yang, Y., Yang, J., Wu, W., Liu, Y., Wu, C., & Li, Y. (2024) · iMeta · doi:10.1002/imt2.180 · Cited by 126
Self-citation
Metadata
- Authors
- Wen, T., Niu, G., Chen, T., Shen, Q., Yuan, J., & Liu, Y.-X.
- Affiliations
- Nanjing Agricultural University (CN)
- China Academy of Chinese Medical Sciences (CN)
- Shenzhen Branch, Guangdong Laboratory of Lingnan Modern Agriculture, Genome Analysis Laboratory of the Ministry of Agriculture and Rural Affairs, Agricultural Genomics Institute at Shenzhen, Chinese Academy of Agricultural Sciences , Shenzhen 518120 , China
- Corresponding author
- Yuan, Jun
- Venue
- Protein & Cell
- Publisher
- Oxford University Press (OUP)
- Published
- 2023-05-02
- Volume
- 14
- Issue
- 10
- Pages
- 713-725
- ISSN
- 1674-800X (ISSN-L)
- 1674-8018
- PMC
- PMC10599642
- OpenAlex
- W4367669005
- Cited by
- 139
- References
- 65
- Citations by year
- 2026: 37 · 2025: 52 · 2024: 43 · 2023: 7
- FWCI
- 12.39
- Type
- journal article
- Language
- en
- Open access
- gold
- doi.org
- Licence
- Locations
- Protein & Cell (publishedVersion, cc-by)
- PubMed Central (publishedVersion, cc-by)
- PubMed (publishedVersion)
- Funders
- Agricultural Science and Technology Innovation Program (CAAS-ZDRW202308)
- Natural Science Foundation of China (42277297, 42090060, U21A20182)
- Jiangsu Funding Program for Excellent Postdoctoral Talent (2022ZB325)
- Scientific and Technology Innovation Project
- China Academy of Chinese Medical Sciences (C12021A04115)
- Fundamental Research Funds
- Central Public Welfare Research Institutes (ZZ13-YQ-095)
- Topics
- Life Sciences › Biochemistry, Genetics and Molecular Biology › Molecular Biology › Genomics and Phylogenetic Studies
- Life Sciences › Biochemistry, Genetics and Molecular Biology › Molecular Biology › Gut microbiota and health
- Physical Sciences › Environmental Science › Ecology › Microbial Community Ecology and Physiology
- Keywords
- microbiome analysis, R package, phyloseq, diversity analysis, biomarker discovery, microbial network analysis, functional prediction
- MeSH terms
- Language, Software, Sequence Analysis, DNA, Microbiota
About these checks
Registry, retraction, Cites and statistics results are computed, not judged, with one exception: a printed reference that no index lists is read once by a model before it counts as a citation error. Claims are extracted by a model and kept only when their quote appears verbatim in the text; each cited source is then checked, with a model’s help, for whether it says what the claim relies on. Those verdicts can be wrong — read the claim’s quote and the cited source before relying on one.
Statistics and arithmetic are recomputed, not judged.
Confidence bands are shown only for fields calibrated on our annotated test set. None is calibrated yet, so no band is shown.
What counts as a claim ›How we measure confidence ›How we check this ›
Are you an author, or do you see a problem with this page? Request a review
Data sources
Bibliographic data: Semantic Scholar, OpenAlex, Crossref.
Contains information from the Semantic Scholar Academic Graph Datasets, made available under the ODC Attribution License (ODC-BY 1.0).
Semantic Scholar’s data is described in: Kinney, R., et al. (2023). The Semantic Scholar Open Data Platform. arXiv:2301.10140.
