

The DOI matches its Crossref record; 133 of the 140 references it cites were found in a registry or an index, and 7 are not checked yet.
The macroevolutionary consequences of phenotypic integration: from development to deep time
Open accessAbstract
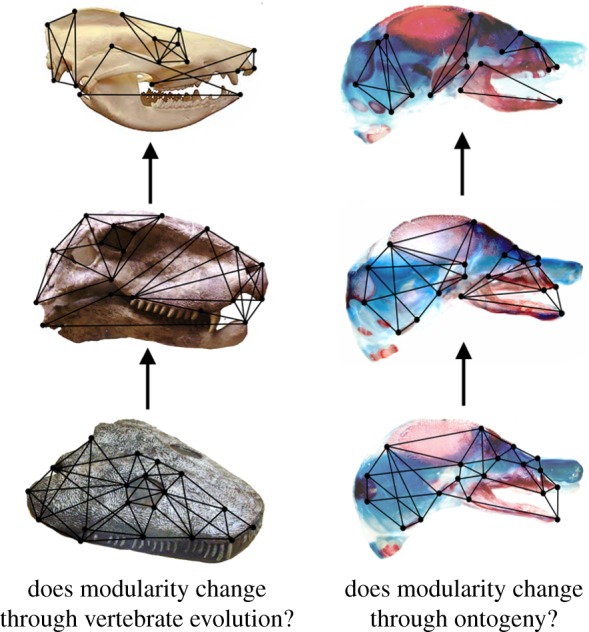
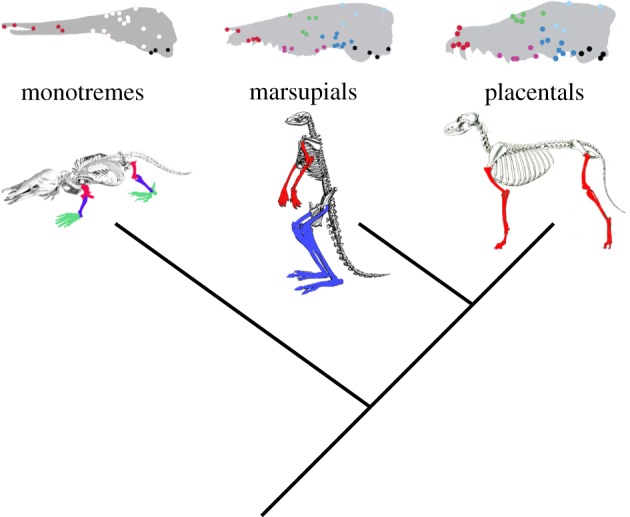
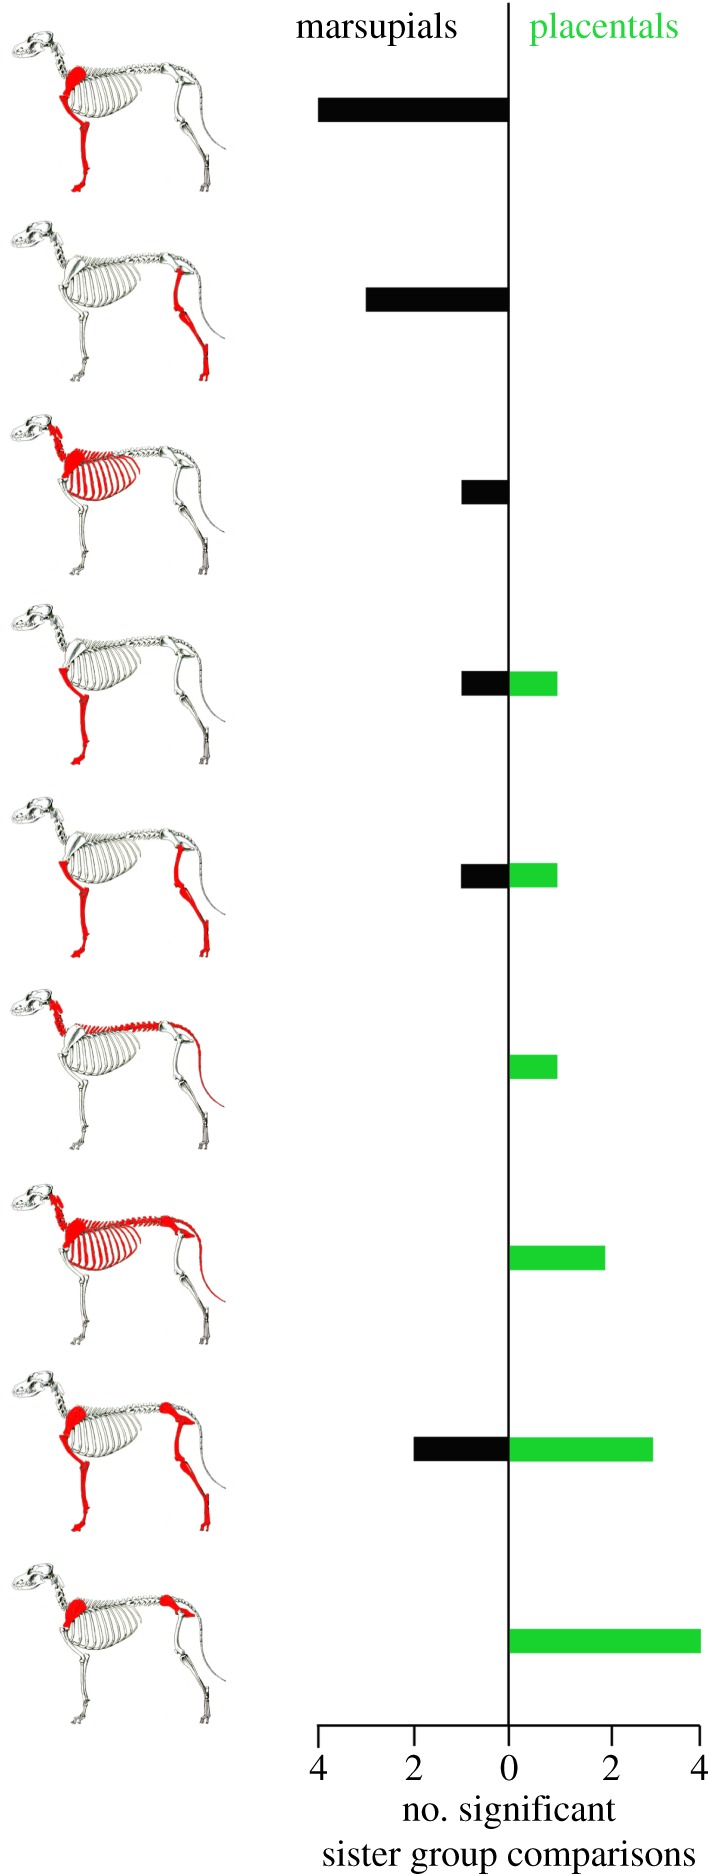
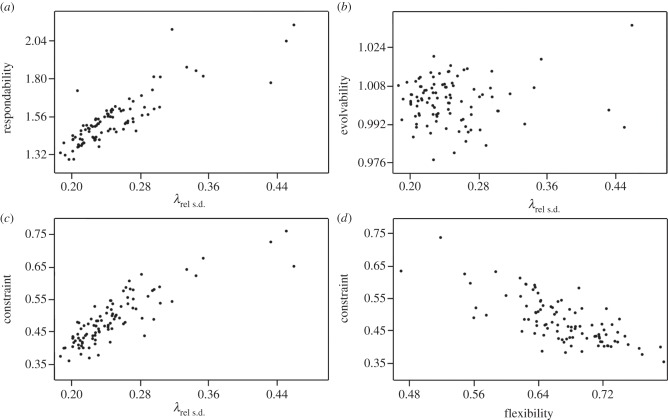
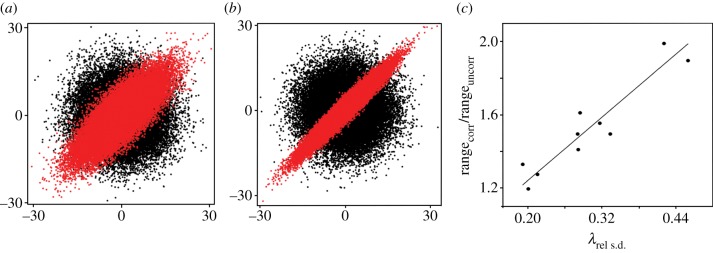
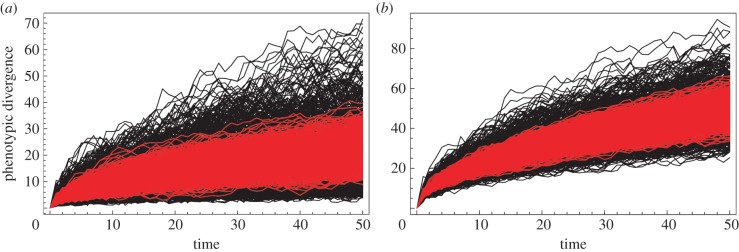
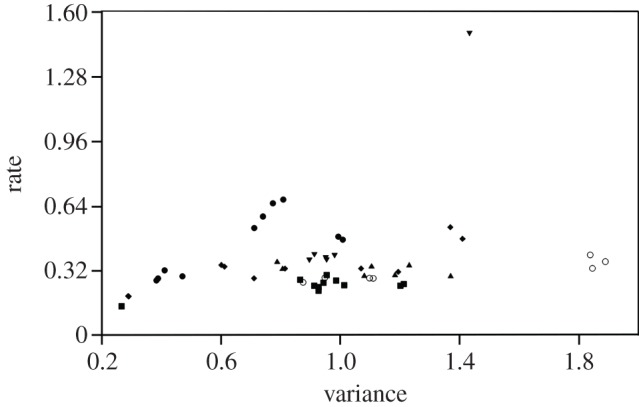
Phenotypic integration is a pervasive characteristic of organisms. Numerous analyses have demonstrated that patterns of phenotypic integration are conserved across large clades, but that significant variation also exists. For example, heterochronic shifts related to different mammalian reproductive strategies are reflected in postcranial skeletal integration and in coordination of bone ossification. Phenotypic integration and modularity have been hypothesized to shape morphological evolution, and we extended simulations to confirm that trait integration can influence both the trajectory and magnitude of response to selection. We further demonstrate that phenotypic integration can produce both more and less disparate organisms than would be expected under random walk models by repartitioning variance in preferred directions. This effect can also be expected to favour homoplasy and convergent evolution. New empirical analyses of the carnivoran cranium show that rates of evolution, in contrast, are not strongly influenced by phenotypic integration and show little relationship to morphological disparity, suggesting that phenotypic integration may shape the direction of evolutionary change, but not necessarily the speed of it. Nonetheless, phenotypic integration is problematic for morphological clocks and should be incorporated more widely into models that seek to accurately reconstruct both trait and organismal evolution.
Overview
The claims and statistics of this paper haven’t been checked yet.
Run the check — free, no account needed. It reads the open-access text and checks the sources it cites.
Integrity signals
Registry
Cites
Statistics
Figures
Verification
Claims the paper makes
The claims and statistics of this paper haven’t been checked yet.
Run the check — free, no account needed. It reads the open-access text and checks the sources it cites.
Claims other papers make about this one
Each is checked against this paper’s own text: does it say what the citing paper says it does?
The source backs part of the claim, not all of it — or backs it for a different population, condition or comparison.
In the citing paper
“Rather, the macroevolutionary consequences of integration are likely to be highly dependent on the direction and magnitude of selection on each module (13).”
From Developmental origins of mosaic evolution in the avian cranium (2018) · cites this paper as [13]
Experimental — accuracy not yet measuredThe source backs part of the claim, not all of it — or backs it for a different population, condition or comparison.
In the citing paper
“Taken together, these results support the fundamental prediction that macroevolutionary patterns are shaped by phenotypic modularity and integration, which are in turn determined by developmental processes (7, 11, 13, 16, 23).”
From Developmental origins of mosaic evolution in the avian cranium (2018) · cites this paper as [13]
Experimental — accuracy not yet measured
Self-check
Percentages, sums and reported differences re-computed from the paper’s own numbers.
The self-check needs the paper’s full text.
Citations
Cites
(1977) · Cited by 4,052
Løvtrup, S., & Gould, S. J. (1978) · Systematic Zoology · doi:10.2307/2412825 · Cited by 2,359
PERSPECTIVE: COMPLEX ADAPTATIONS AND THE EVOLUTION OF EVOLVABILITY
Wagner, G. P., & Altenberg, L. (1996) · Evolution · doi:10.1111/j.1558-5646.1996.tb02339.x · Cited by 2,118
The delayed rise of present-day mammals
Bininda-Emonds, O. R. P., Cardillo, M., Jones, K. E., MacPhee, R. D. E., Beck, R. M. D., Grenyer, R., Price, S. A., Vos, R. A., Gittleman, J. L., & Purvis, A. (2007) · Nature · doi:10.1038/nature05634 · Cited by 2,082
Martins, E. P., & Hansen, T. F. (1997) · The American Naturalist · doi:10.1086/286013 · Cited by 1,718
The Development of the Vertebrate Skull
(1938) · Nature · doi:10.1038/142004a0 · Cited by 1,425
Raff, R. A. (1996) · University of Chicago Press eBooks · doi:10.7208/chicago/9780226256573.001.0001 · Cited by 1,262
The shape of life: genes, development, and the evolution of animal form
(1996) · Choice Reviews Online · doi:10.5860/choice.34-1536 · Cited by 1,003
Perspective: Complex Adaptations and the Evolution of Evolvability
Wagner, G. P., & Altenberg, L. (1996) · Evolution · doi:10.2307/2410639 · Cited by 884
PHENOTYPIC, GENETIC, AND ENVIRONMENTAL MORPHOLOGICAL INTEGRATION IN THE CRANIUM
Cheverud, J. M. (1982) · Evolution · doi:10.1111/j.1558-5646.1982.tb05070.x · Cited by 859
PHYLOGENIES AND QUANTITATIVE CHARACTERS
Felsenstein, J. (1988) · Annual Review of Ecology and Systematics · doi:10.1146/annurev.es.19.110188.002305 · Cited by 831
Developmental Integration and the Evolution of Pleiotropy
Cheverud, J. M. (1996) · American Zoologist · doi:10.1093/icb/36.1.44 · Cited by 759
Felsenstein, J. (1973) · Systematic Biology · doi:10.1093/sysbio/22.3.240 · Cited by 723
Measuring and comparing evolvability and constraint in multivariate characters
Hansen, T. F., & Houle, D. (2008) · Journal of Evolutionary Biology · doi:10.1111/j.1420-9101.2008.01573.x · Cited by 714
Evolution and development of shape: integrating quantitative approaches
Klingenberg, C. P. (2010) · Nature Reviews Genetics · doi:10.1038/nrg2829 · Cited by 706
THE GENETIC COVARIANCE BETWEEN CHARACTERS MAINTAINED BY PLEIOTROPIC MUTATIONS
Lande, R. (1980) · Genetics · doi:10.1093/genetics/94.1.203 · Cited by 685
The Evolution of Morphological Diversity
Foote, M. (1997) · Annual Review of Ecology and Systematics · doi:10.1146/annurev.ecolsys.28.1.129 · Cited by 655
A Biologist's Guide to Mathematical Modeling in Ecology and Evolution
Otto, S. P., & Day, T. (2007) · Princeton University Press eBooks · doi:10.1515/9781400840915 · Cited by 630
Molecular origins of rapid and continuous morphological evolution
Fondon, J. W., & Garner, H. R. (2004) · Proceedings of the National Academy of Sciences · doi:10.1073/pnas.0408118101 · Cited by 614
The primate cranial base: Ontogeny, function, and integration
Lieberman, D. E., Ross, C. F., & Ravosa, M. J. (2000) · American Journal of Physical Anthropology · doi:10.1002/1096-8644(2000)43:31+ · Cited by 535
Klingenberg, C. P. (2009) · Evolution & Development · doi:10.1111/j.1525-142x.2009.00347.x · Cited by 511
Hallgrímsson, B., Jamniczky, H. A., Young, N. M., Rolian, C., Parsons, T. E., Boughner, J. C., & Marcucio, R. (2009) · Evolutionary Biology · doi:10.1007/s11692-009-9076-5 · Cited by 472
Large‐Scale Diversification of Skull Shape in Domestic Dogs: Disparity and Modularity
Drake, A. G., & Klingenberg, C. P. (2010) · The American Naturalist · doi:10.1086/650372 · Cited by 429
Felsenstein, J. (1973) · Systematic Zoology · doi:10.2307/2412304 · Cited by 423
Klingenberg, C. P., & Marugán-Lobón, J. (2013) · Systematic Biology · doi:10.1093/sysbio/syt025 · Cited by 415
Canalization, developmental stability, and morphological integration in primate limbs
Hallgrímsson, B., Willmore, K. E., & Hall, B. K. (2002) · American Journal of Physical Anthropology · doi:10.1002/ajpa.10182 · Cited by 391
Flynn, J. J., Finarelli, J. A., Zehr, S. M., Hsu, J., & Nedbal, M. A. (2005) · Systematic Biology · doi:10.1080/10635150590923326 · Cited by 364
A biologist's guide to mathematical modeling in ecology and evolution
Otto, S. P., & Day, T. (2007) · Choice Reviews Online · doi:10.5860/choice.44-6894 · Cited by 350
Porto, A., de Oliveira, F. B., Shirai, L. T., Conto, V. D., & Marroig, G. (2008) · Evolutionary Biology · doi:10.1007/s11692-008-9038-3 · Cited by 350
A computational model of teeth and the developmental origins of morphological variation
Salazar‐Ciudad, I., & Jernvall, J. (2010) · Nature · doi:10.1038/nature08838 · Cited by 346
Morphological Integration in the Saddle-Back Tamarin (Saguinus fuscicollis) Cranium
Cheverud, J. M. (1995) · The American Naturalist · doi:10.1086/285728 · Cited by 336
Phenotypic, Genetic, and Environmental Morphological Integration in the Cranium
Cheverud, J. M. (1982) · Evolution · doi:10.2307/2408096 · Cited by 336
Klingenberg, C. P., Mebus, K., & Auffray, J. (2003) · Evolution & Development · doi:10.1046/j.1525-142x.2003.03057.x · Cited by 333
SERIAL HOMOLOGY AND THE EVOLUTION OF MAMMALIAN LIMB COVARIATION STRUCTURE
Young, N. M., & Hallgrímsson, B. (2005) · Evolution · doi:10.1111/j.0014-3820.2005.tb00980.x · Cited by 324
Deja vu: the evolution of feeding morphologies in the Carnivora
Valkenburgh, B. V. (2007) · Integrative and Comparative Biology · doi:10.1093/icb/icm016 · Cited by 324
MAJOR PATTERNS IN THE HISTORY OF CARNIVOROUS MAMMALS
Valkenburgh, B. V. (1999) · Annual Review of Earth and Planetary Sciences · doi:10.1146/annurev.earth.27.1.463 · Cited by 293
Cranial modularity shifts during mammalian evolution
Goswami, A. (2006) · The American Naturalist · doi:10.1086/505758 · Cited by 280
Self-citationThe Influence of Modularity on Cranial Morphological Disparity in Carnivora and Primates (Mammalia)
Goswami, A., & Polly, P. D. (2010) · PLoS ONE · doi:10.1371/journal.pone.0009517 · Cited by 271
Self-citationDual origin of tribosphenic mammals
Luo, Z., Cifelli, R. L., & Kielan‐Jaworowska, Z. (2001) · Nature · doi:10.1038/35051023 · Cited by 267
Development and the evolvability of human limbs
Young, N. M., Wagner, G. P., & Hallgrímsson, B. (2010) · Proceedings of the National Academy of Sciences · doi:10.1073/pnas.0911856107 · Cited by 264
The Evolution of Modularity in the Mammalian Skull II: Evolutionary Consequences
Marroig, G., Shirai, L. T., Porto, A., de Oliveira, F. B., & Conto, V. D. (2009) · Evolutionary Biology · doi:10.1007/s11692-009-9051-1 · Cited by 258
Klingenberg, C. P., Badyaev, A. V., Sowry, S. M., & Beckwith, N. J. (2001) · The American Naturalist · doi:10.1086/317002 · Cited by 257
Klingenberg, C. P., Leamy, L. J., & Cheverud, J. M. (2004) · Genetics · doi:10.1534/genetics.166.4.1909 · Cited by 249
Measuring Morphological Integration Using Eigenvalue Variance
Pavličev, M., Cheverud, J. M., & Wagner, G. P. (2009) · Evolutionary Biology · doi:10.1007/s11692-008-9042-7 · Cited by 242
Klingenberg, C. P., Leamy, L. J., Routman, E. J., & Cheverud, J. M. (2001) · Genetics · doi:10.1093/genetics/157.2.785 · Cited by 239
The Rise of placental mammals: origins and relationships of the major extant clades
(2006) · Choice Reviews Online · doi:10.5860/choice.43-2801 · Cited by 233
QUANTITATIVE GENETICS OF GEOMETRIC SHAPE IN THE MOUSE MANDIBLE
Klingenberg, C. P., & Leamy, L. J. (2001) · Evolution · doi:10.1111/j.0014-3820.2001.tb00747.x · Cited by 228
COMPARATIVE PATTERNS OF CRANIOFACIAL DEVELOPMENT IN EUTHERIAN AND METATHERIAN MAMMALS
Smith, K. K. (1997) · Evolution · doi:10.1111/j.1558-5646.1997.tb01489.x · Cited by 217
NEW TOOLS FOR STUDYING INTEGRATION AND MODULARITY
Magwene, P. M. (2001) · Evolution · doi:10.1111/j.0014-3820.2001.tb00823.x · Cited by 213
Modification of Estimates of Parameters in the Construction of Genetic Selection Indices ('Bending')
Hayes, J. F., & Hill, W. G. (1981) · Biometrics · doi:10.2307/2530561 · Cited by 199
Cranial integration and modularity: insights into evolution and development from morphometric data
(2013) · Bollettino del CILEA (CILEA) · doi:10.4404/hystrix-24.1-6367 · Cited by 199
Hierarchical nature of morphological integration and modularity in the human posterior face
Bastir, M., & Rosas, A. (2005) · American Journal of Physical Anthropology · doi:10.1002/ajpa.20191 · Cited by 194
Wagner, G. P. (1988) · Journal of Evolutionary Biology · doi:10.1046/j.1420-9101.1988.1010045.x · Cited by 192
Developmental regulation of skull morphology. I. Ontogenetic dynamics of variance
Zelditch, M. L., Lundrigan, B. L., & Garland, T. (2004) · Evolution & Development · doi:10.1111/j.1525-142x.2004.04025.x · Cited by 188
Beyond heterochrony : the evolution of development
Zelditch, M. L. (2001) · Cited by 171
Testing Character Correlation using Pairwise Comparisons on a Phylogeny
Maddison, W. P. (2000) · Journal of Theoretical Biology · doi:10.1006/jtbi.1999.1050 · Cited by 170
Methods for Studying Morphological Integration and Modularity
Goswami, A., & Polly, P. D. (2010) · The Paleontological Society Papers · doi:10.1017/s1089332600001881 · Cited by 163
Self-citationMORPHOLOGICAL INTEGRATION IN THE CARNIVORAN SKULL
Goswami, A. (2006) · Evolution · doi:10.1111/j.0014-3820.2006.tb01091.x · Cited by 163
Self-citationGoswami, A., Milne, N., & Wroe, S. (2010) · Proceedings of the Royal Society B Biological Sciences · doi:10.1098/rspb.2010.2031 · Cited by 159
Self-citationDavid, F. N., Olson, E. C., & Miller, R. L. (1959) · Biometrika · doi:10.2307/2332851 · Cited by 156
ONTOGENY OF INTEGRATED SKULL GROWTH IN THE COTTON RATSIGMODON FULVIVENTER
Zelditch, M. L., Bookstein, F. L., & Lundrigan, B. L. (1992) · Evolution · doi:10.1111/j.1558-5646.1992.tb00626.x · Cited by 154
Ontogenetic integration of the hominoid face
ACKERMANN, R. (2005) · Journal of Human Evolution · doi:10.1016/j.jhevol.2004.11.001 · Cited by 150
Integration of Craniofacial Structures During Development in Mammals
Smith, K. K. (1996) · American Zoologist · doi:10.1093/icb/36.1.70 · Cited by 142
ONTOGENETIC VARIATION IN PATTERNS OF PHENOTYPIC INTEGRATION IN THE LABORATORY RAT
Zelditch, M. L. (1988) · Evolution · doi:10.1111/j.1558-5646.1988.tb04105.x · Cited by 141
Trabecular Bone Structure Correlates with Hand Posture and Use in Hominoids
Tsegai, Z. J., Kivell, T. L., Gross, T. J., Nguyễn, H. N., Pahr, D. H., Smaers, J. B., & Skinner, M. M. (2013) · PLoS ONE · doi:10.1371/journal.pone.0078781 · Cited by 134
Self-citationCraniofacial variability and modularity in macaques and mice
Hallgrímsson, B., Willmore, K., Dorval, C., & Cooper, D. M. L. (2004) · Journal of Experimental Zoology Part B Molecular and Developmental Evolution · doi:10.1002/jez.b.21002 · Cited by 134
Sequence Heterochrony and the Evolution of Development
Smith, K. K. (2002) · Journal of Morphology · doi:10.1002/jmor.10014 · Cited by 129
Nunn, C. L., & Smith, K. K. (1998) · The American Naturalist · doi:10.1086/286151 · Cited by 128
Mitterœcker, P., & Bookstein, F. L. (2008) · Evolution · doi:10.1111/j.1558-5646.2008.00587.x · Cited by 123
Zelditch, M. L., & Carmichael, C. (1989) · Evolution · doi:10.1111/j.1558-5646.1989.tb05179.x · Cited by 114
Cheverud, J. M., Ehrich, T. H., Vaughn, T. T., Koreishi, S. F., Linsey, R. B., & Pletscher, L. S. (2004) · Journal of Experimental Zoology Part B Molecular and Developmental Evolution · doi:10.1002/jez.b.21008 · Cited by 112
Brain reorganization, not relative brain size, primarily characterizes anthropoid brain evolution
Smaers, J. B., & Soligo, C. (2013) · Proceedings of the Royal Society B: Biological Sciences · doi:10.1098/rspb.2013.0269 · Cited by 112
Self-citationComparative Patterns of Craniofacial Development in Eutherian and Metatherian Mammals
Smith, K. K. (1997) · Evolution · doi:10.2307/2411218 · Cited by 112
Zelditch, M. L., Wood, A. R., & Swiderski, D. L. (2008) · Evolutionary Biology · doi:10.1007/s11692-008-9034-7 · Cited by 108
Sears, K. E., Goswami, A., Flynn, J. J., & Niswander, L. A. (2007) · Evolution & Development · doi:10.1111/j.1525-142x.2007.00196.x · Cited by 106
Self-citationCONSTRAINTS ON THE MORPHOLOGICAL EVOLUTION OF MARSUPIAL HOULDER GIRDLES
Sears, K. E. (2004) · Evolution · doi:10.1111/j.0014-3820.2004.tb01609.x · Cited by 102
Cheverud, J. M., Ehrich, T. H., Vaughn, T. T., Koreishi, S. F., Linsey, R. B., & Pletscher, L. S. (2004) · Journal of Experimental Zoology · doi:10.1002/jez.21008 · Cited by 100
Developmental modularity and the marsupial–placental dichotomy
Goswami, A., Weisbecker, V., & Sánchez-Villagra, M. R. (2009) · Journal of Experimental Zoology Part B Molecular and Developmental Evolution · doi:10.1002/jez.b.21283 · Cited by 99
Self-citationA likelihood approach for evaluating estimates of phylogenetic relationships among fossil taxa
Wagner, P. J. (1998) · Paleobiology · doi:10.1017/s0094837300020091 · Cited by 98
Inference from binary comparative data
Read, A. F., & Nee, S. (1995) · Journal of Theoretical Biology · doi:10.1006/jtbi.1995.0047 · Cited by 98
Cranial modularity and sequence heterochrony in mammals
Goswami, A. (2007) · Evolution & Development · doi:10.1111/j.1525-142x.2007.00161.x · Cited by 97
Self-citationSkull ontogeny: developmental patterns of fishes conserved across major tetrapod clades
Schoch, R. R. (2006) · Evolution & Development · doi:10.1111/j.1525-142x.2006.00125.x · Cited by 93
Germain, D., & Laurin, M. (2009) · Evolution & Development · doi:10.1111/j.1525-142x.2009.00318.x · Cited by 92
Evolution of Morphological Integration: Developmental Accommodation of Stress-Induced Variation
Badyaev, A. V., Foresman, K. R., & Young, R. L. (2005) · The American Naturalist · doi:10.1086/432559 · Cited by 90
Developmental regulation of skull morphology II: ontogenetic dynamics of covariance
Zelditch, M. L., Mezey, J. G., Sheets, H. D., Lundrigan, B. L., & Garland, T. (2006) · Evolution & Development · doi:10.1111/j.1525-142x.2006.05074.x · Cited by 87
von Baer's law for the ages: lost and found principles of developmental evolution
Abzhanov, A. (2013) · Trends in Genetics · doi:10.1016/j.tig.2013.09.004 · Cited by 86
Willmore, K. E., Leamy, L. J., & Hallgrímsson, B. (2006) · Evolution & Development · doi:10.1111/j.1525-142x.2006.00127.x · Cited by 85
On morphological clocks and paleophylogeography: Towards a timescale for Sorex hybrid zones
Polly, P. D. (2001) · Contemporary issues in genetics and evolution · doi:10.1007/978-94-010-0585-2_21 · Cited by 85
Self-citationInferring and Testing Hypotheses of Cladistic Character Dependence by Using Character Compatibility
O'Keefe, F. R., & Wagner, P. J. (2001) · Systematic Biology · doi:10.1080/106351501753328794 · Cited by 84
Badyaev, A. V., & Foresman, K. R. (2004) · The American Naturalist · doi:10.1086/386551 · Cited by 81
Harrison, L. B., & Larsson, H. C. E. (2008) · Systematic Biology · doi:10.1080/10635150802164421 · Cited by 80
Ontogeny of Integrated Skull Growth in the Cotton Rat Sigmodon fulviventer
Zelditch, M. L., Bookstein, F. L., & Lundrigan, B. L. (1992) · Evolution · doi:10.2307/2409763 · Cited by 80
Smaers, J. B., Dechmann, D. K. N., Goswami, A., Soligo, C., & Safi, K. (2012) · Proceedings of the National Academy of Sciences · doi:10.1073/pnas.1212181109 · Cited by 79
Self-citationWagner, P. J. (2011) · Biology Letters · doi:10.1098/rsbl.2011.0523 · Cited by 76
Cranial shape and correlated characters in crocodilian evolution
Sadleir, R. W., & Makovicky, P. J. (2008) · Journal of Evolutionary Biology · doi:10.1111/j.1420-9101.2008.01602.x · Cited by 75
Development and phenotypic correlations: the evolution of tooth shape in Sorex araneus
Polly, P. D. (2005) · Evolution & Development · doi:10.1111/j.1525-142x.2005.05004.x · Cited by 74
Self-citationCheverud, J. M., Hartman, S. E., Richtsmeier, J. T., & Atchley, W. R. (1991) · PubMed · Cited by 73
On morphological clocks and paleophylogeography: towards a timescale for Sorex hybrid zones
Polly, P. D. (2001) · Genetica · doi:10.1023/a:1013395907225 · Cited by 72
Self-citationCONSTRAINTS ON THE MORPHOLOGICAL EVOLUTION OF MARSUPIAL SHOULDER GIRDLES
Sears, K. E. (2004) · Evolution · doi:10.1554/03-669 · Cited by 72
A COMPARISON OF COVARIANCE STRUCTURE IN WILD AND LABORATORY MUROID CRANIA
Jamniczky, H. A., & Hallgrímsson, B. (2009) · Evolution · doi:10.1111/j.1558-5646.2009.00651.x · Cited by 71
Morphological Correlations in Evolution: Consequences for Phylogenetic Analysis
Emerson, S. B., & Hastings, P. A. (1998) · The Quarterly Review of Biology · doi:10.1086/420182 · Cited by 70
Heterochrony, disparity, and macroevolution
McNamara, K. J., & McKinney, M. L. (2005) · Paleobiology · doi:10.1666/0094-8373(2005)031[0017:hdam]2.0.co;2 · Cited by 70
Reno, P. L., McCollum, M. A., Cohn, M. J., Meindl, R. S., Hamrick, M. W., & Lovejoy, C. O. (2007) · Journal of Experimental Zoology Part B Molecular and Developmental Evolution · doi:10.1002/jez.b.21207 · Cited by 69
Statistical support for the hypothesis of developmental constraint in marsupial skull evolution
Bennett, V., & Goswami, A. (2013) · BMC Biology · doi:10.1186/1741-7007-11-52 · Cited by 67
Self-citationNaylor, G. J. P., & Adams, D. C. (2001) · Systematic Biology · doi:10.1080/10635150118184 · Cited by 67
Shape, variance and integration during craniogenesis: contrasting marsupial and placental mammals
Goswami, A., Polly, P. D., Mock, O. B., & Sánchez-Villagra, M. R. (2012) · Journal of Evolutionary Biology · doi:10.1111/j.1420-9101.2012.02477.x · Cited by 66
Self-citationHeterochrony and developmental modularity of cranial osteogenesis in lipotyphlan mammals
Koyabu, D. B., Endo, H., Mitgutsch, C., Suwa, G., Catania, K. C., Zollikofer, C. P., Oda, S., Koyasu, K., Andō, M., & Sánchez-Villagra, M. R. (2011) · EvoDevo · doi:10.1186/2041-9139-2-21 · Cited by 63
Bell, E. J. D. H., Andres, B., & Goswami, A. (2011) · Journal of Evolutionary Biology · doi:10.1111/j.1420-9101.2011.02381.x · Cited by 61
Self-citationMorphological integration versus ecological plasticity in the avian pelvic limb skeleton
Stoessel, A., Kilbourne, B. M., & Fischer, M. S. (2013) · Journal of Morphology · doi:10.1002/jmor.20109 · Cited by 58
Morphological Integration Primate Evolution
Ackermann, R., & Cheverud, J. M. (2004) · doi:10.1093/oso/9780195160437.003.0014 · Cited by 57
Testing the inhibitory cascade model in Mesozoic and Cenozoic mammaliaforms
Halliday, T. J. D., & Goswami, A. (2013) · BMC Evolutionary Biology · doi:10.1186/1471-2148-13-79 · Cited by 57
Self-citationAgutter, P. S., & Wheatley, D. N. (2000) · BioEssays · doi:10.1002/1521-1878(200011)22:11 · Cited by 56
MONOTREME OSSIFICATION SEQUENCES AND THE RIDDLE OF MAMMALIAN SKELETAL DEVELOPMENT
Weisbecker, V. (2011) · Evolution · doi:10.1111/j.1558-5646.2011.01234.x · Cited by 56
Reduced phenotypic covariation in marsupial limbs and the implications for mammalian evolution
KELLY, E. M., & Sears, K. E. (2010) · Biological Journal of the Linnean Society · doi:10.1111/j.1095-8312.2010.01561.x · Cited by 53
Zelditch, M. L., & Carmichael, A. C. (1989) · Evolution · doi:10.2307/2409309 · Cited by 49
Effect of Nonindependent Substitution on Phylogenetic Accuracy
Huelsenbeck, J. P., & Nielsen, R. (1999) · Systematic Biology · doi:10.1080/106351599260319 · Cited by 48
Growth and Intensity of Integration through Postnatal Growth in the Skull of Sigmodon fulviventer
Zelditch, M. L., & Carmichael, A. C. (1989) · Journal of Mammalogy · doi:10.2307/1381419 · Cited by 47
Marroig, G., & Cheverud, J. M. (2004) · American Journal of Physical Anthropology · doi:10.1002/ajpa.10421 · Cited by 46
Does developmental strategy drive limb integration in marsupials and monotremes?
Bennett, V., & Goswami, A. (2010) · Mammalian Biology · doi:10.1016/j.mambio.2010.01.004 · Cited by 45
Self-citationPhylogeny, Diet, and Cranial Integration in Australodelphian Marsupials
Goswami, A. (2007) · PLoS ONE · doi:10.1371/journal.pone.0000995 · Cited by 42
Self-citationFischer‐Rousseau, L., Cloutier, R., & Zelditch, M. L. (2009) · Evolution & Development · doi:10.1111/j.1525-142x.2009.00381.x · Cited by 40
Different evolutionary pathways underlie the morphology of wrist bones in hominoids
Kivell, T. L., Barros, A. P., & Smaers, J. B. (2013) · BMC Evolutionary Biology · doi:10.1186/1471-2148-13-229 · Cited by 39
Self-citationArchibald, J. D. (2011) · Johns Hopkins University Press eBooks · doi:10.56021/9780801898051 · Cited by 38
The Evolutionary and Developmental Basis of Parallel Reduction in Mammalian Zeugopod Elements
Sears, K. E., Behringer, R. R., Rasweiler, J. J., & Niswander, L. A. (2006) · The American Naturalist · doi:10.1086/510259 · Cited by 35
Testing a developmental model in the fossil record: molar proportions in South American ungulates
Wilson, L. A. B., Madden, R. H., Kay, R. F., & Sánchez-Villagra, M. R. (2012) · Paleobiology · doi:10.1666/11001.1 · Cited by 35
Harris, S. R., Gower, D. J., & Wilkinson, M. (2003) · Systematic Biology · doi:10.1080/10635150309341 · Cited by 35
Naylor, G. A. J. P., & Adams, D. C. (2001) · Systematic Biology · doi:10.1080/106351501300318030 · Cited by 35
Villmoare, B. A. (2012) · Evolutionary Biology · doi:10.1007/s11692-012-9186-3 · Cited by 33
Marcot, J. D., & McShea, D. W. (2007) · Paleobiology · doi:10.1666/06028.1 · Cited by 33
Lawler, R. R. (2008) · American Journal of Physical Anthropology · doi:10.1002/ajpa.20795 · Cited by 29
A TEST FOR PATTERNS OF MODULARITY IN SEQUENCES OF DEVELOPMENTAL EVENTS
Poe, S. (2004) · Evolution · doi:10.1111/j.0014-3820.2004.tb00468.x · Cited by 28
Covariation in the skull modules of cats: the challenge of growing saber-like canines
Meloro, C., & Slater, G. J. (2012) · Journal of Vertebrate Paleontology · doi:10.1080/02724634.2012.649328 · Cited by 26
Goswami, A., & Polly, P. D. (2010) · Cambridge University Press eBooks · doi:10.1017/cbo9781139193436.006 · Cited by 26
Self-citationInferring macro-evolutionary patterns using an adaptive peak model of evolution
Smaers, J. B., & Vinicius, L. (2009) · UCL Discovery (University College London) · Cited by 21
Self-citationCranial Suture Closure Patterns in Sciuridae: Heterochrony and Modularity
Wilson, L. A. B. (2013) · Journal of Mammalian Evolution · doi:10.1007/s10914-013-9242-5 · Cited by 16
Maxwell, E. E., & Dececchi, T. A. (2013) · Paleobiology · doi:10.1666/0094-8373-39.1.123 · Cited by 14
Extinction and radiation: how the fall of the dinosaurs led to the rise of mammals
Morris, P. (2012) · Zoological Journal of the Linnean Society · doi:10.1111/j.1096-3642.2012.00807.x · Cited by 12
The correlated evolution of Runx2 tandem repeats and facial length in Carnivora
Sears, K. E., Goswami, A., Flynn, J., & Niswander, L. A. (2007) · UCL Discovery (University College London) · Cited by 6
Self-citationLarsson, H. C. E., Dececchi, T. A., & Harrison, L. B. (2012) · Cambridge University Press eBooks · doi:10.1017/cbo9780511760174.004 · Cited by 3
(2014) · Institutional Repository University of Antioquia (University of Antioquia) · doi:10.1371/journal.pone
Research works printed but not linked: 11
- Schlosser G, 2004, Modularity in development and evolution
- Atchley WR, 1993, The skull. 1 Development, 207
- Cheverud JM, 2004, Modularity in development and evolution, 132
- Goswami A, 2010, Quantitative methods in paleobiology, 213
- 10.1002/1096-8644(2000)43:31 <117::AID-AJPA5>3.3.CO;2-9 · DOI
- Klingenberg CP, 2008, MorphoJ
- Schlosser G, 2005, Modularity in development and evolution, 519
- Shubin N, 2004, Modularity in development and evolution, 429
- Zelditch ML, 2001, Beyond heterochrony: the evolution of development, 145
- Polly PD, 2012, Phylogenetics for mathematica, 2.1 edn
- Polly PD, 2004, On the simulation of the evolution of morphological shape: multivariate shape under selection and drift, Palaeontol. Electron., 7, 1
Cited by
Sorted by citations
mv morph : an r package for fitting multivariate evolutionary models to morphometric data
Clavel, J., Escarguel, G., & Merceron, G. (2015) · Methods in Ecology and Evolution · doi:10.1111/2041-210x.12420 · Cited by 524
Analyzing Fluctuating Asymmetry with Geometric Morphometrics: Concepts, Methods, and Applications
Klingenberg, C. P. (2015) · Symmetry · doi:10.3390/sym7020843 · Cited by 456
Integrated phenotypes: understanding trait covariation in plants and animals
Armbruster, W. S., Pélabon, C., Bolstad, G. H., & Hansen, T. F. (2014) · Philosophical Transactions of the Royal Society B Biological Sciences · doi:10.1098/rstb.2013.0245 · Cited by 311
Developmental origins of mosaic evolution in the avian cranium
Felice, R. N., & Goswami, A. (2018) · Proceedings of the National Academy of Sciences · doi:10.1073/pnas.1716437115 · Cited by 249
“Rather, the macroevolutionary consequences of integration are likely to be highly dependent on the direction and magnitude of selection on each module (13).”
BackgroundInfluentialSelf-citationAdams, D. C. (2016) · Methods in Ecology and Evolution · doi:10.1111/2041-210x.12511 · Cited by 257
Metadata
- Authors
- Goswami, A., Smaers, J. B., Soligo, C., & Polly, P. D.
- Affiliations
- University College London (GB)
- Indiana University Bloomington (US)
- Corresponding author
- Goswami, A.
- Venue
- Philosophical Transactions of the Royal Society B: Biological Sciences
- Publisher
- The Royal Society
- Published
- 2014-08-19
- Volume
- 369
- Issue
- 1649
- Pages
- 20130254
- ISSN
- 0962-8436 (ISSN-L)
- 1471-2970
- PMC
- PMC4084539
- OpenAlex
- W2158213278
- Cited by
- 359
- References
- 133
- Citations by year
- 2026: 20 · 2025: 30 · 2024: 27 · 2023: 39 · 2022: 30 · 2021: 40 · 2020: 30 · 2019: 42 · 2018: 34 · 2017: 19 · 2016: 26 · 2015: 17 · 2014: 5
- FWCI
- 31.00
- Type
- journal article
- Language
- en
- Open access
- hybrid
- doi.org
- Locations
- Philosophical Transactions of the Royal Society B Biological Sciences (publishedVersion, cc-by)
- Europe PMC (PubMed Central) (publishedVersion, cc-by)
- PubMed Central (publishedVersion, cc-by)
- PubMed (publishedVersion)
- UCL Discovery (University College London) (submittedVersion)
- Funders
- National Science Foundation (0308765, 0502186)
- American Museum of Natural History
- University of Chicago
- Field Museum
- Royal Society
- University of New South Wales
- National Museum of Natural History
- Natural Environment Research Council (NE/J012432/1, NE/H022937/1)
- Office of International Science and Engineering
- University of California Museum of Paleontology
- Topics
- Life Sciences › Agricultural and Biological Sciences › Ecology, Evolution, Behavior and Systematics › Morphological variations and asymmetry
- Physical Sciences › Earth and Planetary Sciences › Paleontology › Evolution and Paleontology Studies
- Life Sciences › Biochemistry, Genetics and Molecular Biology › Genetics › Evolution and Genetic Dynamics
- Keywords
- phenotypic integration, modularity, morphological evolution, heterochrony, postcranial skeleton, ossification, selection response, morphological disparity, homoplasy, convergent evolution, evolutionary rates, random walks
- MeSH terms
- Animals, Biological Evolution, Models, Biological, Phenotype, Phylogeny, Selection, Genetic, Time Factors, Vertebrates, Developmental Biology, Body Patterning, Biodiversity, Systems Biology
About these checks
Registry, retraction, Cites and statistics results are computed, not judged, with one exception: a printed reference that no index lists is read once by a model before it counts as a citation error. Claims are extracted by a model and kept only when their quote appears verbatim in the text; each cited source is then checked, with a model’s help, for whether it says what the claim relies on. Those verdicts can be wrong — read the claim’s quote and the cited source before relying on one.
Statistics and arithmetic are recomputed, not judged.
Confidence bands are shown only for fields calibrated on our annotated test set. None is calibrated yet, so no band is shown.
What counts as a claim ›How we measure confidence ›How we check this ›
Are you an author, or do you see a problem with this page? Request a review
