

The DOI matches its Crossref record; 69 of the 69 references it cites were found in a registry or an index.
SARS-CoV-2 growth, furin-cleavage-site adaptation and neutralization using serum from acutely infected hospitalized COVID-19 patients
Open accessPublished version of a preprint
Abstract
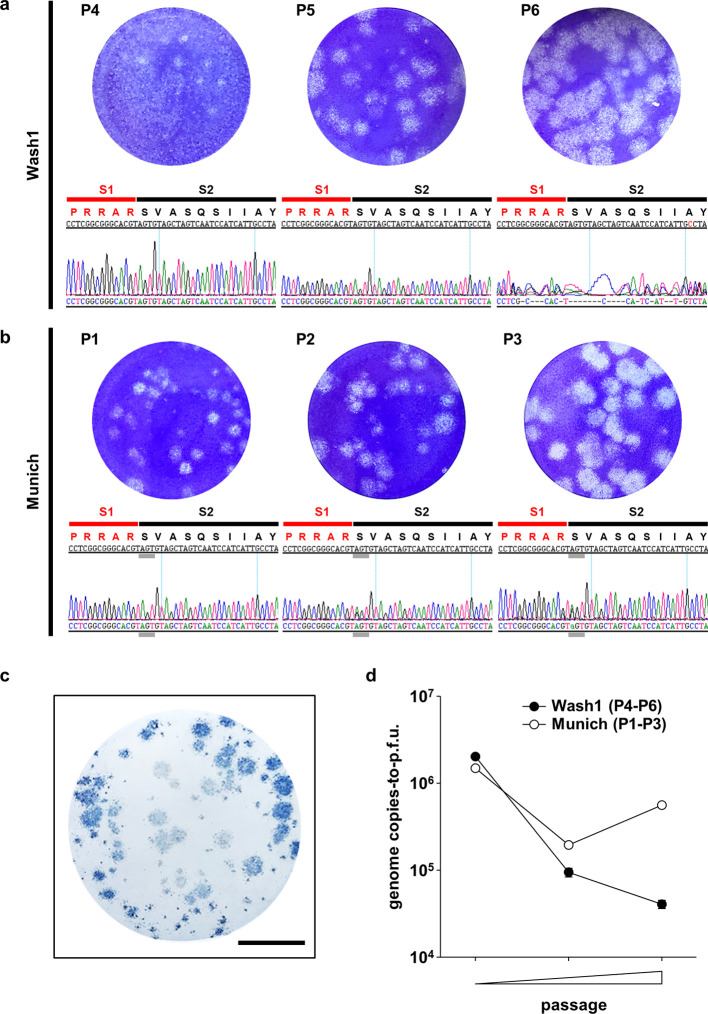
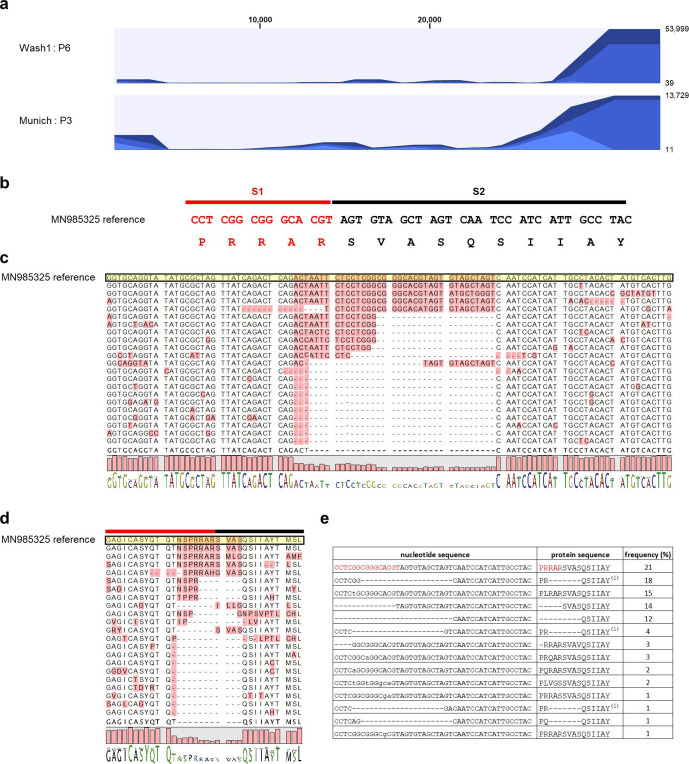
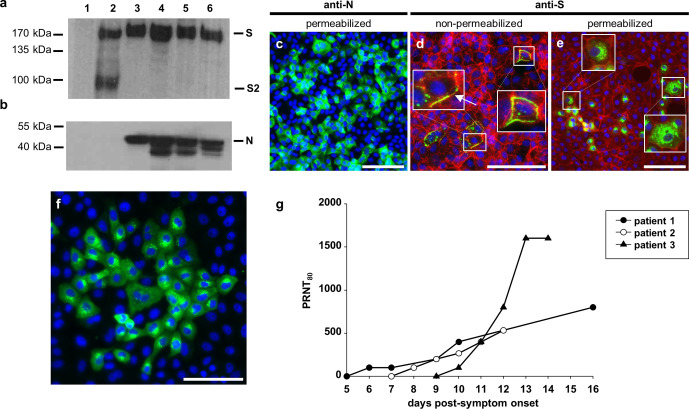
Severe acute respiratory syndrome coronavirus 2 (SARS-CoV-2), the causative agent of coronavirus disease 2019 (COVID-19), emerged at the end of 2019 and by mid-June 2020 the virus had spread to at least 215 countries, caused more than 8 000 000 confirmed infections and over 450 000 deaths, and overwhelmed healthcare systems worldwide. Like severe acute respiratory syndrome coronavirus (SARS-CoV), which emerged in 2002 and caused a similar disease, SARS-CoV-2 is a betacoronavirus. Both viruses use human angiotensin-converting enzyme 2 (hACE2) as a receptor to enter cells. However, the SARS-CoV-2 spike (S) glycoprotein has a novel insertion that generates a putative furin cleavage signal and this has been postulated to expand the host range. Two low-passage (P) strains of SARS-CoV-2 (Wash1 : P4 and Munich : P1) were cultured twice in Vero E6 cells and characterized virologically. Sanger and MinION sequencing demonstrated significant deletions in the furin cleavage signal of Wash1 : P6 and minor variants in the Munich : P3 strain. Cleavage of the S glycoprotein in SARS-CoV-2-infected Vero E6 cell lysates was inefficient even when an intact furin cleavage signal was present. Indirect immunofluorescence demonstrated that the S glycoprotein reached the cell surface. Since the S protein is a major antigenic target for the development of neutralizing antibodies, we investigated the development of neutralizing antibody titres in serial serum samples obtained from COVID-19 human patients. These were comparable regardless of the presence of an intact or deleted furin cleavage signal. These studies illustrate the need to characterize virus stocks meticulously prior to performing either in vitro or in vivo pathogenesis studies.
Overview
The claims and statistics of this paper haven’t been checked yet.
Run the check — free, no account needed. It reads the open-access text and checks the sources it cites.
Integrity signals
Registry
Cites
Statistics
Figures
Verification
Claims the paper makes
The claims and statistics of this paper haven’t been checked yet.
Run the check — free, no account needed. It reads the open-access text and checks the sources it cites.
Claims other papers make about this one
Each is checked against this paper’s own text: does it say what the citing paper says it does?
The source backs part of the claim, not all of it — or backs it for a different population, condition or comparison.
In the citing paper
“Recombinant viruses and B.1.1.7 were propagated in Vero-TMPRSS2 and Vero-hACE2-TMPRSS2 cells expressing transmembrane protease serine 2 (TMPRSS2) and human angiotensin converting enzyme 2 (hACE2) to prevent the development of adventitious mutations in the spike, especially at or near the furin cleavage site”
From Resistance of SARS-CoV-2 variants to neutralization by monoclonal and serum-derived polyclonal antibodies (2021) · cites this paper as [15]
Experimental — accuracy not yet measured
Self-check
Percentages, sums and reported differences re-computed from the paper’s own numbers.
The self-check needs the paper’s full text.
Citations
Cites
A novel coronavirus from patients with pneumonia in China, 2019
Zhu, N., Zhang, D., Wang, W., Li, X., Yang, B., Song, J., Zhao, X., Huang, B., Shi, W., Lu, R., et al. (2020) · New England Journal of Medicine · doi:10.1056/nejmoa2001017 · Cited by 28,244
A pneumonia outbreak associated with a new coronavirus of probable bat origin
Zhou, P., Yang, X.-L., Wang, X.-G., Hu, B., Zhang, L., Zhang, W., Si, H.-R., Zhu, Y., Li, B., Huang, C.-L., et al. (2020) · Nature · doi:10.1038/s41586-020-2012-7 · Cited by 21,969
Hoffmann, M., Kleine-Weber, H., Schroeder, S., Krüger, N., Herrler, T., Erichsen, S., Schiergens, T. S., Herrler, G., Wu, N.-H., Nitsche, A., et al. (2020) · Cell · doi:10.1016/j.cell.2020.02.052 · Cited by 20,286
Gorbalenya, A. E., Baker, S. C., Baric, R. S., de Groot, R. J., Drosten, C., Gulyaeva, A. A., Haagmans, B. L., Lauber, C., Leontovich, A. M., Neuman, B. W., et al. (2020) · Nature Microbiology · doi:10.1038/s41564-020-0695-z · Cited by 8,745
Structure, function and antigenicity of the SARS-CoV-2 spike glycoprotein
Walls, A. C., Park, Y.-J., Tortorici, M. A., Wall, A., McGuire, A. T., & Veesler, D. (2020) · doi:10.1101/2020.02.19.956581 · Cited by 8,586
Virological assessment of hospitalized patients with COVID-2019
Wölfel, R., Corman, V. M., Guggemos, W., Seilmaier, M., Zange, S., Müller, M. A., Niemeyer, D., Jones, T. C., Vollmar, P., Rothe, C., et al. (2020) · Nature · doi:10.1038/s41586-020-2196-x · Cited by 6,661
Isolation of a Novel Coronavirus from a Man with Pneumonia in Saudi Arabia
Zaki, A. M., van Boheemen, S., Bestebroer, T. M., Osterhaus, A. D. M. E., & Fouchier, R. A. M. (2012) · New England Journal of Medicine · doi:10.1056/nejmoa1211721 · Cited by 5,677
The proximal origin of SARS-CoV-2
Andersen, K. G., Rambaut, A., Lipkin, W. I., Holmes, E. C., & Garry, R. F. (2020) · Nature Medicine · doi:10.1038/s41591-020-0820-9 · Cited by 5,081
Identification of a novel coronavirus in patients with severe acute respiratory syndrome
Drosten, C., Günther, S., Preiser, W., van der Werf, S., Brodt, H.-R., Becker, S., Rabenau, H., Panning, M., Kolesnikova, L., Fouchier, R. A. M., et al. (2003) · New England Journal of Medicine · doi:10.1056/nejmoa030747 · Cited by 4,574
A Novel Coronavirus Associated with Severe Acute Respiratory Syndrome
Tg, K., Erdman, D. D., Cs, G., Zaki, Peret, T. C. T., Emery, S. L., Tong, S., Urbani, C., Comer, J. A., Lim, W., et al. (2003) · New England Journal of Medicine · doi:10.1056/nejmoa030781 · Cited by 4,353
Research works printed but not linked: 1
- 10.1016/j.cell.2020.02.058 · DOI · Paper page
Cited by
Sorted by citations
Grifoni, A., Weiskopf, D., Ramirez, S. I., Mateus, J., Dan, J. M., Moderbacher, C. R., Rawlings, S. A., Sutherland, A., Premkumar, L., Jadi, R. S., et al. (2020) · Cell · doi:10.1016/j.cell.2020.05.015 · Cited by 3,595
Mechanisms of SARS-CoV-2 entry into cells
Jackson, C. B., Farzan, M., Chen, B., & Choe, H. (2022) · Nature Reviews Molecular Cell Biology · doi:10.1038/s41580-021-00418-x · Cited by 3,022
Opportunities and challenges in long-read sequencing data analysis
Amarasinghe, S. L., Su, S., Dong, X., Zappia, L., Ritchie, M. E., & Gouil, Q. (2020) · Genome Biology · doi:10.1186/s13059-020-1935-5 · Cited by 2,530
Lamers, M. M., & Haagmans, B. L. (2022) · Nature Reviews Microbiology · doi:10.1038/s41579-022-00713-0 · Cited by 1,066
Chen, R. E., Zhang, X., Case, J. B., Winkler, E. S., Liu, Y., VanBlargan, L. A., Liu, J., Errico, J. M., Xie, X., Suryadevara, N., et al. (2021) · Nature Medicine · doi:10.1038/s41591-021-01294-w · Cited by 881
The furin cleavage site in the SARS-CoV-2 spike protein is required for transmission in ferrets
Peacock, T. P., Goldhill, D. H., Zhou, J., Baillon, L., Frise, R., Swann, O. C., Kugathasan, R., Penn, R., Brown, J. C., Sanchez-David, R. Y., et al. (2021) · Nature Microbiology · doi:10.1038/s41564-021-00908-w · Cited by 802
Loss of furin cleavage site attenuates SARS-CoV-2 pathogenesis
Johnson, B. A., Xie, X., Bailey, A. L., Kalveram, B., Lokugamage, K. G., Muruato, A., Zou, J., Zhang, X., Juelich, T., Smith, J. K., et al. (2021) · Nature · doi:10.1038/s41586-021-03237-4 · Cited by 694
Deng, X., Garcia-Knight, M. A., Khalid, M. M., Servellita, V., Wang, C., Morris, M. K., Sotomayor-González, A., Glasner, D. R., Reyes, K. R., Gliwa, A. S., et al. (2021) · doi:10.1101/2021.03.07.21252647 · Cited by 651
Transmission, infectivity, and neutralization of a spike L452R SARS-CoV-2 variant
Deng, X., Garcia-Knight, M. A., Khalid, M. M., Servellita, V., Wang, C., Morris, M. K., Sotomayor-González, A., Glasner, D. R., Reyes, K. R., Gliwa, A. S., et al. (2021) · Cell · doi:10.1016/j.cell.2021.04.025 · Cited by 651
Escape of SARS-CoV-2 501Y.V2 from neutralization by convalescent plasma
Network for Genomic Surveillance in South Africa, Cele, S., COMMIT-KZN Team, Gazy, I., Jackson, L., Hwa, S.-H., Tegally, H., Lustig, G., Giandhari, J., Pillay, S., et al. (2021) · Nature · doi:10.1038/s41586-021-03471-w · Cited by 651
Recurrent deletions in the SARS-CoV-2 spike glycoprotein drive antibody escape
McCarthy, K. R., Rennick, L. J., Nambulli, S., Robinson-McCarthy, L. R., Bain, W. G., Haidar, G., & Duprex, W. P. (2021) · Science · doi:10.1126/science.abf6950 · Cited by 535
Self-citationThe origins of SARS-CoV-2: A critical review
Holmes, E. C., Goldstein, S. A., Rasmussen, A. L., Robertson, D. L., Crits‐Christoph, A., Wertheim, J. O., Anthony, S. J., Barclay, W., Boni, M. F., Doherty, P. C., et al. (2021) · Cell · doi:10.1016/j.cell.2021.08.017 · Cited by 553
Versatile and multivalent nanobodies efficiently neutralize SARS-CoV-2
Xiang, Y., Nambulli, S., Xiao, Z., Liu, H., Sang, Z., Duprex, W. P., Schneidman‐Duhovny, D., Zhang, C., & Shi, Y. (2020) · Science · doi:10.1126/science.abe4747 · Cited by 396
Self-citationAntibody response to SARS-CoV-2 infection in humans: A systematic review
Post, N., Eddy, D., Huntley, C., van Schalkwyk, M. C., Shrotri, M., Leeman, D., Rigby, S., Williams, S. V., Bermingham, W. H., Kellam, P., et al. (2020) · PLoS ONE · doi:10.1371/journal.pone.0244126 · Cited by 379
T cell response to SARS-CoV-2 infection in humans: A systematic review
Shrotri, M., van Schalkwyk, M. C., Post, N., Eddy, D., Huntley, C., Leeman, D., Rigby, S., Williams, S. V., Bermingham, W. H., Kellam, P., et al. (2021) · PLoS ONE · doi:10.1371/journal.pone.0245532 · Cited by 352
Genetic and structural basis for SARS-CoV-2 variant neutralization by a two-antibody cocktail
Dong, J., Zost, S. J., Greaney, A. J., Starr, T. N., Dingens, A. S., Chen, E. C., Chen, R. E., Case, J. B., Sutton, R. E., Gilchuk, P., et al. (2021) · Nature Microbiology · doi:10.1038/s41564-021-00972-2 · Cited by 285
Rihn, S. J., Merits, A., Bakshi, S., Turnbull, M. L., Wickenhagen, A., Alexander, A. J. T., Baillie, C., Brennan, B., Brown, F., Brunker, K., et al. (2021) · PLoS Biology · doi:10.1371/journal.pbio.3001091 · Cited by 212
In vivo monoclonal antibody efficacy against SARS-CoV-2 variant strains
Chen, R. E., Winkler, E. S., Case, J. B., Aziati, I. D., Bricker, T. L., Joshi, A., Darling, T. L., Ying, B., Errico, J. M., Shrihari, S., et al. (2021) · Nature · doi:10.1038/s41586-021-03720-y · Cited by 209
Proteolytic activation of SARS‐CoV‐2 spike protein
Takeda, M. (2021) · Microbiology and Immunology · doi:10.1111/1348-0421.12945 · Cited by 194
Sasaki, M., Uemura, K., Sato, A., Toba, S., Sanaki, T., Maenaka, K., Hall, W. W., Orba, Y., & Sawa, H. (2021) · PLoS Pathogens · doi:10.1371/journal.ppat.1009233 · Cited by 183
In vitro selection of Remdesivir resistance suggests evolutionary predictability of SARS-CoV-2
Szemiel, A. M., Merits, A., Orton, R. J., MacLean, O. A., Pinto, R. M., Wickenhagen, A., Lieber, G., Turnbull, M. L., Wang, S., Furnon, W., et al. (2021) · PLoS Pathogens · doi:10.1371/journal.ppat.1009929 · Cited by 170
Nambulli, S., Xiang, Y., Tilston‐Lunel, N. L., Rennick, L. J., Sang, Z., Klimstra, W. B., Reed, D. S., Crossland, N. A., Shi, Y., & Duprex, W. P. (2021) · Science Advances · doi:10.1126/sciadv.abh0319 · Cited by 160
Self-citationA versatile reverse genetics platform for SARS-CoV-2 and other positive-strand RNA viruses
Amarilla, A. A., Sng, J. D. J., Parry, R. H., Deerain, J. M., Potter, J. R., Setoh, Y. X., Rawle, D. J., Le, T. T., Modhiran, N., Wang, X., et al. (2021) · Nature Communications · doi:10.1038/s41467-021-23779-5 · Cited by 159
SARS-CoV-2 one year on: evidence for ongoing viral adaptation
Peacock, T. P., Penrice-Randal, R., Hiscox, J. A., & Barclay, W. (2021) · Journal of General Virology · doi:10.1099/jgv.0.001584 · Cited by 155
Mykytyn, A. Z., Breugem, T. I., Riesebosch, S., Schipper, D., van den Doel, P. B., Rottier, R. J., Lamers, M. M., & Haagmans, B. L. (2021) · eLife · doi:10.7554/elife.64508 · Cited by 153
Escape of SARS-CoV-2 501Y.V2 from neutralization by convalescent plasma
Cele, S., Gazy, I., Jackson, L., Hwa, S.-H., Tegally, H., Lustig, G., Giandhari, J., Pillay, S., Wilkinson, E., Naidoo, Y., et al. (2021) · doi:10.1101/2021.01.26.21250224 · Cited by 651
Hartman, A. L., Nambulli, S., McMillen, C. M., White, A. G., Tilston‐Lunel, N. L., Albe, J. R., Cottle, E. L., Dunn, M., Frye, L. J., Gilliland, T. H., et al. (2020) · PLoS Pathogens · doi:10.1371/journal.ppat.1008903 · Cited by 140
Self-citationCOVID-19 in Relation to Hyperglycemia and Diabetes Mellitus
Al-Kuraishy, H. M., Al-Gareeb, A. I., Alblihed, M. A., Guerreiro, S. G., Martins, N. A., & Batiha, G. E. (2021) · Frontiers in Cardiovascular Medicine · doi:10.3389/fcvm.2021.644095 · Cited by 130
Laporte, M., Raeymaekers, V., Berwaer, R. V., Vandeput, J., Marchand-Casas, I., Thibaut, H. J., Looveren, D. V., Martens, K., Hoffmann, M., Maes, P., et al. (2021) · PLoS Pathogens · doi:10.1371/journal.ppat.1009500 · Cited by 126
Synergistic and Antagonistic Drug Combinations against SARS-CoV-2
Bobrowski, T., Chen, L., Eastman, R. T., Itkin, Z., Shinn, P., Chen, C. Z., Guo, H., Zheng, W., Michael, S., Simeonov, A. M., et al. (2020) · Molecular Therapy · doi:10.1016/j.ymthe.2020.12.016 · Cited by 119
Replication kinetics and infectivity of SARS-CoV-2 variants of concern in common cell culture models
Mautner, L., Hoyos, M., Dangel, A., Berger, C., Ehrhardt, A., & Baiker, A. E. (2022) · Virology Journal · doi:10.1186/s12985-022-01802-5 · Cited by 107
Beumer, J., Geurts, M. H., Lamers, M. M., Puschhof, J., Zhang, J., van der Vaart, J., Mykytyn, A. Z., Breugem, T. I., Riesebosch, S., Schipper, D., et al. (2021) · Nature Communications · doi:10.1038/s41467-021-25729-7 · Cited by 113
Human airway cells prevent SARS-CoV-2 multibasic cleavage site cell culture adaptation
Lamers, M. M., Mykytyn, A. Z., Breugem, T. I., Wang, Y., Wu, D. C., Riesebosch, S., van den Doel, P. B., Schipper, D., Bestebroer, T. M., Wu, N. C., et al. (2021) · eLife · doi:10.7554/elife.66815 · Cited by 103
Functional importance of the D614G mutation in the SARS-CoV-2 spike protein
Jackson, C. B., Zhang, L., Farzan, M., & Choe, H. (2020) · Biochemical and Biophysical Research Communications · doi:10.1016/j.bbrc.2020.11.026 · Cited by 93
The origins of COVID‐19 pandemic: A brief overview
Hao, Y., Wang, Y., Wang, M.-Y., Zhou, L., Shi, J., Cao, J., & Wang, D. (2022) · Transboundary and Emerging Diseases · doi:10.1111/tbed.14732 · Cited by 139
Peacock, T. P., Goldhill, D. H., Zhou, J., Baillon, L., Frise, R., Swann, O. C., Kugathasan, R., Penn, R., Brown, J. C., Sanchez-David, R. Y., et al. (2020) · bioRxiv (Cold Spring Harbor Laboratory) · doi:10.1101/2020.09.30.318311 · Cited by 88
Rosa, R. B., Dantas, W. M., do Nascimento, J. C. F., da Silva, M. V., de Oliveira, R. N., & Pena, L. (2021) · Viruses · doi:10.3390/v13030379 · Cited by 89
Ramírez, S., Fernandez-Antunez, C., Galli, A., Underwood, A. P., Pham, L. V., Ryberg, L. A., Feng, S., Pedersen, M. S., Mikkelsen, L. S., Belouzard, S., et al. (2021) · Antimicrobial Agents and Chemotherapy · doi:10.1128/aac.00097-21 · Cited by 89
Zhang, X., Liu, Y., Liu, J., Bailey, A. L., Plante, K. S., Plante, J. A., Zou, J., Xia, H., Bopp, N. E., Aguilar, P. V., et al. (2021) · Cell · doi:10.1016/j.cell.2021.02.044 · Cited by 79
Despres, H. W., Mills, M. G., Shirley, D. J., Schmidt, M. M., Huang, M.-L. W., Roychoudhury, P., Jerome, K. R., Greninger, A. L., & Bruce, E. A. (2022) · Proceedings of the National Academy of Sciences · doi:10.1073/pnas.2116518119 · Cited by 65
SARS-CoV-2 variants reveal features critical for replication in primary human cells
Pohl, M. O., Busnadiego, I., Kufner, V., Glas, I., Karakus, U., Schmutz, S., Zaheri, M., Abela, I. A., Trkola, A., Huber, M., et al. (2021) · PLoS Biology · doi:10.1371/journal.pbio.3001006 · Cited by 55
Genetic and structural basis for recognition of SARS-CoV-2 spike protein by a two-antibody cocktail
Dong, J., Zost, S. J., Greaney, A. J., Starr, T. N., Dingens, A. S., Chen, E. C., Chen, R. E., Case, J. B., Sutton, R. E., Gilchuk, P., et al. (2021) · doi:10.1101/2021.01.27.428529 · Cited by 55
Virus-like Particles: Measures and Biological Functions
Bhat, T., Cao, A., & Yin, J. (2022) · Viruses · doi:10.3390/v14020383 · Cited by 57
Advancing lung organoids for COVID-19 research
van der Vaart, J., Lamers, M. M., Haagmans, B. L., & Clevers, H. C. (2021) · Disease Models & Mechanisms · doi:10.1242/dmm.049060 · Cited by 50
Furusawa, Y., Kiso, M., Iida, S., Uraki, R., Hirata, Y., Imai, M., Suzuki, T., Yamayoshi, S., & Kawaoka, Y. (2023) · EBioMedicine · doi:10.1016/j.ebiom.2023.104561 · Cited by 46
Sasaki, M., Toba, S., Itakura, Y., Chambaro, H. M., Kishimoto, M., Tabata, K., Intaruck, K., Uemura, K., Sanaki, T., Sato, A., et al. (2021) · mBio · doi:10.1128/mbio.01415-21 · Cited by 46
Lavie, M., Dubuisson, J., & Belouzard, S. (2022) · Journal of Virology · doi:10.1128/jvi.00474-22 · Cited by 50
McCormick, W. L., & Mermel, L. A. (2021) · Virology Journal · doi:10.1186/s12985-021-01566-4 · Cited by 46
Shiliaev, N., Lukash, T., Palchevska, O., Crossman, D. K., Green, T. J., Crowley, M. R., Frolova, E. I., & Frolov, I. V. (2021) · Journal of Virology · doi:10.1128/jvi.01357-21 · Cited by 41
Yun, S., Ryu, J. H., Jang, J. H., Bae, H., Yoo, S.-H., Choi, A., Jo, S. J., Lim, J., Lee, J., Ryu, H., et al. (2021) · Annals of Laboratory Medicine · doi:10.3343/alm.2021.41.6.577 · Cited by 39
Chen, R. E., Gorman, M. J., Zhu, D. Y., Carreño, J. M., Yuan, D., VanBlargan, L. A., Burdess, S., Lauffenburger, D. A., Kim, W., Turner, J. S., et al. (2021) · Med · doi:10.1016/j.medj.2021.11.004 · Cited by 37
Propagation of SARS-CoV-2 in Calu-3 Cells to Eliminate Mutations in the Furin Cleavage Site of Spike
Baczenas, J. J., Andersen, H., Rashid, S., Yarmosh, D. A., Puthuveetil, N. P., Parker, M. L., Bradford, R., Florence, C., Stemple, K. J., Lewis, M. G., et al. (2021) · Viruses · doi:10.3390/v13122434 · Cited by 40
Structural insights in cell-type specific evolution of intra-host diversity by SARS-CoV-2
Gupta, K., Toelzer, C., Williamson, M. K., Shoemark, D. K., Oliveira, A. S. F., Matthews, D. A., Almuqrin, A., Staufer, O., Yadav, S. K. N., Borucu, U., et al. (2022) · Nature Communications · doi:10.1038/s41467-021-27881-6 · Cited by 37
Garg, A., Hawks, S. A., Pan, J., Wang, W., Duggal, N. K., Marr, L. C., Vikesland, P. J., & Zhou, W. M. (2023) · Biosensors and Bioelectronics · doi:10.1016/j.bios.2023.115946 · Cited by 33
Jo, W. K., Schadenhofer, A., Habierski, A., Kaiser, F. K., Saletti, G., Ganzenmueller, T., Hage, E., Haid, S., Pietschmann, T., Hansen, G., et al. (2021) · Proceedings of the National Academy of Sciences · doi:10.1073/pnas.2026558118 · Cited by 33
Modeling within-host and aerosol dynamics of SARS-CoV-2: The relationship with infectiousness
Heitzman-Breen, N., & Ciupe, S. M. (2022) · PLoS Computational Biology · doi:10.1371/journal.pcbi.1009997 · Cited by 31
Hepp, C., Shiaelis, N., Robb, N. C., Vaughan, A., Matthews, P. C., Stoesser, N. E., Crook, D. W., & Kapanidis, A. N. (2021) · Scientific Reports · doi:10.1038/s41598-021-98972-z · Cited by 32
Tian, Y., Parsons, L. M., Jankowska, E. A., & Cipollo, J. F. (2021) · Frontiers in Chemistry · doi:10.3389/fchem.2021.767448 · Cited by 29
Basile, K., Rockett, R. J., McPhie, K. A., Fennell, M., Johnson-Mackinnon, J. C., Agius, J. E., Fong, W., Rahman, H., Ko, D., Donavan, L., et al. (2022) · Viruses · doi:10.3390/v14092023 · Cited by 40
Patel, D., Field, C., Septer, K. M., Sim, D., Jones, M. J., Heinly, T., Vanderford, T., McGraw, E., & Sutton, T. (2021) · Journal of Virology · doi:10.1128/jvi.02232-20 · Cited by 26
Zilla, M. L., Wheeler, B. J., Keetch, C., Mitchell, G., McBreen, J., Wells, A. H., Shurin, M. R., Peck‐Palmer, O. M., & Wheeler, S. (2020) · American Journal of Clinical Pathology · doi:10.1093/ajcp/aqaa228 · Cited by 26
Self-citationModeling Within-Host Dynamics of SARS-CoV-2 Infection: A Case Study in Ferrets
Vaidya, N. K., Bloomquist, A., & Perelson, A. S. (2021) · Viruses · doi:10.3390/v13081635 · Cited by 27
Sobolik, J. S., Sajewski, E. T., Jaykus, L., Cooper, D. K., Lopman, B. A., Kraay, A. N. M., Ryan, P. B., Guest, J. L., Girard, A. W., & León, J. S. (2021) · Food Control · doi:10.1016/j.foodcont.2022.108845 · Cited by 28
Guo, C., Tsai, S. J., Ai, Y., Li, M., Pekosz, A. S., Cox, A., Atai, N. A., & Gould, S. J. (2022) · Science Advances · doi:10.1126/sciadv.ade5085 · Cited by 31
Liu, Z., Wu, H., Egland, K. A., Gilliland, T. C., Dunn, M. D., Luke, T. C., Sullivan, E. J., Klimstra, W. B., Bausch, C. L., & Whelan, S. P. J. (2021) · Human Vaccines & Immunotherapeutics · doi:10.1080/21645515.2021.1940652 · Cited by 26
Self-citationJaworski, E. A., Langsjoen, R. M., Mitchell, B. M., Judy, B. M., Newman, P. C., Plante, J. A., Plante, K. S., Miller, A. L., Zhou, Y., Swetnam, D. M., et al. (2021) · eLife · doi:10.7554/elife.68479 · Cited by 25
Zhdanov, G. A., Nykhrikova, E. V., Meshcheryakova, N. F., Kristavchuk, O. V., Ахметова, А. И., Andreev, E. V., Рудакова, Е. В., Gambaryan, A. S., Yaminsky, I. V., Aralov, A. V., et al. (2022) · Frontiers in Chemistry · doi:10.3389/fchem.2022.937180 · Cited by 27
SARS-CoV-2 Genomic Variation in Space and Time in Hospitalized Patients in Philadelphia
Everett, J. K., Hokama, P., Roche, A. M., Reddy, S. G., Hwang, Y., Kessler, L. R., Glascock, A. L., Li, Y., Whelan, J. N., Weiss, S. R., et al. (2021) · mBio · doi:10.1128/mbio.03456-20 · Cited by 25
Kukushkin, V. I., Kristavchuk, O. V., Andreev, E. V., Meshcheryakova, N. F., Zaborova, O. V., Gambaryan, A. S., Nechaev, A. N., & Zavyalova, E. G. (2023) · Frontiers in Bioengineering and Biotechnology · doi:10.3389/fbioe.2022.1076749 · Cited by 24
Systematic Exploration of SARS-CoV-2 Adaptation to Vero E6, Vero E6/TMPRSS2, and Calu-3 Cells
Aiewsakun, P., Phumiphanjarphak, W., Ludowyke, N., Purwono, P. B., Manopwisedjaroen, S., Srisaowakarn, C., Ekronarongchai, S., Suksatu, A., Yuvaniyama, J., & Thitithanyanont, A. (2023) · Genome Biology and Evolution · doi:10.1093/gbe/evad035 · Cited by 26
Basile, K., Rockett, R. J., McPhie, K. A., Fennell, M., Johnson-Mackinnon, J. C., Agius, J. E., Fong, W., Rahman, H., Ko, D., Donavan, L., et al. (2021) · bioRxiv (Cold Spring Harbor Laboratory) · doi:10.1101/2021.12.12.472252 · Cited by 25
Neutralization of SARS-CoV-2 Variants by rVSV-ΔG-Spike-Elicited Human Sera
Yahalom-Ronen, Y., Noam Erez, A., Fisher, M., Tamir, H., Politi, B., Achdout, H., Melamed, S., Glinert, I., Weiss, S., Cohen-Gihon, I., et al. (2022) · Vaccines · doi:10.3390/vaccines10020291 · Cited by 22
Espeseth, A. S., Yuan, M., Citron, M. P., Reiserova, L., Morrow, G., Wilson, A. J., Horton, M. S., Rukhman, M., Kinek, K. C., Hou, F., et al. (2022) · EBioMedicine · doi:10.1016/j.ebiom.2022.104203 · Cited by 24
Multiplex Lithographic SERS Aptasensor for Detection of Several Respiratory Viruses in One Pot
Kukushkin, V. I., Ambartsumyan, O. A., Subekin, A. Y., Astrakhantseva, A. S., Gushchin, V. А., Nikonova, A. A., Dorofeeva, A., Зверев, В. В., Keshek, A. K., Meshcheryakova, N. F., et al. (2023) · International Journal of Molecular Sciences · doi:10.3390/ijms24098081 · Cited by 24
Versatile, Multivalent Nanobody Cocktails Efficiently Neutralize SARS-CoV-2Preprint
Xiang, Y., Nambulli, S., Xiao, Z., Liu, H., Sang, Z., Duprex, W. P., Schneidman‐Duhovny, D., Zhang, C., & Shi, Y. (2020) · bioRxiv (Cold Spring Harbor Laboratory) · doi:10.1101/2020.08.24.264333 · Cited by 23
Self-citationZou, W., Xiong, M., Hao, S., Zhang, E. Y., Baumlin, N., Kim, M. D., Salathe, M. A., Yan, Z., & Qiu, J. (2021) · mBio · doi:10.1128/mbio.01006-21 · Cited by 22
Isolation of ACE2-dependent and -independent sarbecoviruses from Chinese horseshoe bats
Guo, H., Li, A., Dong, T.-Y., Si, H.-R., Hu, B., Li, B., Zhu, Y., Shi, Z., & Letko, M. C. (2023) · Journal of Virology · doi:10.1128/jvi.00395-23 · Cited by 21
Storti, B., Quaranta, P., Primio, C. D., Clementi, N., Mancini, N., Criscuolo, E., Spezia, P. G., Carnicelli, V., Lottini, G., Paolini, E., et al. (2021) · Computational and Structural Biotechnology Journal · doi:10.1016/j.csbj.2021.10.038 · Cited by 21
Zapata-Cardona, M. I., Flórez‐Álvarez, L., Gómez-Gallego, D. M., Moncada-Díaz, M. J., Hernández, J. C., Díaz, F. J., Rugeles, M. T., Aguilar-Jiménez, W., & Zapata, W. (2022) · Iranian Journal of Microbiology · doi:10.18502/ijm.v14i3.9758 · Cited by 21
Frolova, E. I., Palchevska, O., Lukash, T., Domínguez, F. D. B. P., Britt, W. J., & Frolov, I. V. (2022) · Journal of Virology · doi:10.1128/jvi.00753-22 · Cited by 19
Toelzer, C., Gupta, K., Berger, I., & Schaffitzel, C. (2023) · Acta Crystallographica Section D Structural Biology · doi:10.1107/s2059798323000049 · Cited by 16
Gilliland, T. H., Liu, Y., Li, R., Dunn, M., Cottle, E. L., Terada, Y., Ryckman, Z., Alcorn, M. D. H., Vasilatos, S. N., Lundy, J. D., et al. (2021) · bioRxiv (Cold Spring Harbor Laboratory) · doi:10.1101/2021.07.26.453840 · Cited by 17
Self-citationKnow your enemy and know yourself – the case of SARS-CoV-2 host factors
Lee, W. S., Yousefi, M., Yan, B., Yong, C. L., & Ooi, Y. S. (2021) · Current Opinion in Virology · doi:10.1016/j.coviro.2021.08.007 · Cited by 16
Cochin, M., Touret, F., Driouich, J., Moureau, G., Petit, P.-R., Laprie, C., Solas, C., de Lamballerie, X. N., & Nougaırède, A. (2021) · Antiviral Research · doi:10.1016/j.antiviral.2021.105212 · Cited by 16
Goławski, M., Lewandowski, P., Jabłońska, I., & Delijewski, M. (2022) · Viruses · doi:10.3390/v14050991 · Cited by 16
Human models for COVID‐19 research
Woodall, M. N. J., Masonou, T., Case, K., & Smith, C. M. (2021) · The Journal of Physiology · doi:10.1113/jp281499 · Cited by 13
A non-transmissible live attenuated SARS-CoV-2 vaccine
Adler, J. M., Vidal, R. M., Voß, A., Kunder, S., Nascimento, M., Abdelgawad, A., Langner, C., Vladimirova, D., Osterrieder, N., Gruber, A. D., et al. (2023) · Molecular Therapy · doi:10.1016/j.ymthe.2023.05.004 · Cited by 16
Zupin, L., Licen, S., Milani, M., Clemente, L., Martello, L., Semeraro, S., Fontana, F., Ruscio, M., Miani, A., Crovella, S., et al. (2021) · International Journal of Environmental Research and Public Health · doi:10.3390/ijerph182111172 · Cited by 14
Woodall, M. N. J., Ellis, S., Zhang, S., Kembou-Ringert, J. E., Kite, K., Buggiotti, L., Jacobs, A. I., Agyeman, A. A., Masonou, T., Palor, M., et al. (2024) · Antimicrobial Agents and Chemotherapy · doi:10.1128/aac.01233-24 · Cited by 13
Profiling COVID-19 Genetic Research: A Data-Driven Study Utilizing Intelligent Bibliometrics
Wu, M., Zhang, Y., Grosser, M., Tipper, S., Venter, D. J., Lin, H., & Jie Lu, B. (2021) · Frontiers in Research Metrics and Analytics · doi:10.3389/frma.2021.683212 · Cited by 14
Immune durability and protection against SARS-CoV-2 re-infection in Syrian hamsters
Field, C. J., Heinly, T. A., Patel, D., Sim, D. G., Luley, E., Gupta, S. L., Vanderford, T. H., Wrammert, J., & Sutton, T. C. (2022) · Emerging Microbes & Infections · doi:10.1080/22221751.2022.2058419 · Cited by 13
SARS-CoV-2 Portrayed against HIV: Contrary Viral Strategies in Similar Disguise
Duerr, R., Crosse, K. M., Valero-Jimenez, A. M., & Dittmann, M. (2021) · Microorganisms · doi:10.3390/microorganisms9071389 · Cited by 12
Bamford, C., Broadbent, L., Aranday-Cortés, E., McCabe, M., McKenna, J. P., Courtney, D., Touzelet, O., Ali, A., Roberts, G. C., López–Campos, G., et al. (2022) · Viruses · doi:10.3390/v14020325 · Cited by 12
Human organoid systems reveal in vitro correlates of fitness for SARS-CoV-2 B.1.1.7Preprint
Lamers, M. M., Breugem, T. I., Mykytyn, A. Z., Wang, Y., Gröen, N., Knoops, K., Schipper, D., van der Vaart, J., Koopman, C. D., Zhang, J., et al. (2021) · bioRxiv (Cold Spring Harbor Laboratory) · doi:10.1101/2021.05.03.441080 · Cited by 11
Lim, H. T., Kok, B. H., Lim, C. P., Majeed, A. B. A., Leow, C. Y., & Leow, C. Y. (2022) · Biomedical Engineering Advances · doi:10.1016/j.bea.2022.100054 · Cited by 10
Gilliland, T. H., Dunn, M., Liu, Y., Alcorn, M. D. H., Terada, Y., Vasilatos, S. N., Lundy, J. D., Li, R., Nambulli, S., Larson, D. P., et al. (2023) · iScience · doi:10.1016/j.isci.2023.107764 · Cited by 10
Self-citationTargeting spike glycans to inhibit SARS-CoV2 viral entry
Guseman, A. J., Rennick, L. J., Nambulli, S., Roy, C. N., Martinez, D. R., Yang, D. T., Bhinderwala, F., Vergara, S. V., Schaefer, A., Baric, R. S., et al. (2023) · Proceedings of the National Academy of Sciences · doi:10.1073/pnas.2301518120 · Cited by 11
Self-citationGlycosaminoglycan binding by arboviruses: a cautionary tale
Alcorn, M. D. H., & Klimstra, W. B. (2022) · Journal of General Virology · doi:10.1099/jgv.0.001726 · Cited by 10
Self-citationShirato, K., Kakizaki, M., Tomita, Y., Kawase, M., & Takeda, M. (2022) · Pathogens · doi:10.3390/pathogens11030302 · Cited by 10
Nanoisland SERS-Substrates for Specific Detection and Quantification of Influenza A Virus
Zhdanov, G. A., Gambaryan, A. S., Ахметова, А. И., Yaminsky, I. V., Kukushkin, V. I., & Zavyalova, E. G. (2023) · Biosensors · doi:10.3390/bios14010020 · Cited by 9
Metadata
- Authors
- Klimstra, W. B., Tilston-Lunel, N. L., Nambulli, S., Boslett, J., McMillen, C. M., Gilliland, T., Dunn, M. D., Sun, C., Wheeler, S. E., Wells, A., Hartman, A. L., McElroy, A. K., Reed, D. S., Rennick, L. J., & Duprex, W. P.
- Affiliations
- University of Pittsburgh (US)
- Department of Microbiology and Molecular Genetics, School of Medicine, University of Pittsburgh, Pittsburgh, Pennsylvania, USA
- Corresponding author
- Klimstra, William B.
- Duprex, W. Paul
- ORCID
- Venue
- Journal of General Virology
- Publisher
- Microbiology Society
- Published
- 2020-11-01
- Volume
- 101
- Issue
- 11
- Pages
- 1156-1169
- ISSN
- 0022-1317 (ISSN-L)
- 1465-2099
- PMC
- PMC7879561
- OpenAlex
- W3081204841
- Cited by
- 137
- References
- 69
- Citations by year
- 2026: 3 · 2025: 5 · 2024: 6 · 2023: 20 · 2022: 29 · 2021: 61 · 2020: 13
- FWCI
- 4.03
- Type
- journal article
- Language
- en
- Open access
- hybrid
- doi.org
- Locations
- Journal of General Virology (publishedVersion, cc-by)
- bioRxiv (Cold Spring Harbor Laboratory) (acceptedVersion, cc-by-nc-nd)
- PubMed Central (publishedVersion, cc-by)
- PubMed (publishedVersion)
- PubMed Central (submittedVersion, cc-by-nc-nd)
- Funders
- Dr. Patrick Gallagher, Chancellor of the University of Pittsburgh
- Center for Vaccine Research, University of Pittsburgh
- University of Pittsburgh Clinical and Translational Science Institute
- DSF Charitable Foundation
- National Institutes of Health (AI060525)
- Topics
- Health Sciences › Medicine › Infectious Diseases › SARS-CoV-2 and COVID-19 Research
- Life Sciences › Agricultural and Biological Sciences › Animal Science and Zoology › Animal Virus Infections Studies
- Health Sciences › Medicine › Infectious Diseases › COVID-19 Clinical Research Studies
- Keywords
- SARS-CoV-2, COVID-19 pandemic, furin cleavage site, spike protein, viral growth, neutralizing antibodies, host range, SARS-CoV, angiotensin-converting enzyme 2
About these checks
Registry, retraction, Cites and statistics results are computed, not judged, with one exception: a printed reference that no index lists is read once by a model before it counts as a citation error. Claims are extracted by a model and kept only when their quote appears verbatim in the text; each cited source is then checked, with a model’s help, for whether it says what the claim relies on. Those verdicts can be wrong — read the claim’s quote and the cited source before relying on one.
Statistics and arithmetic are recomputed, not judged.
Confidence bands are shown only for fields calibrated on our annotated test set. None is calibrated yet, so no band is shown.
What counts as a claim ›How we measure confidence ›How we check this ›
Are you an author, or do you see a problem with this page? Request a review
