

The DOI matches its Crossref record; 69 of the 69 references it cites were found in a registry or an index.
Estimated transmissibility and impact of SARS-CoV-2 lineage B.1.1.7 in England
Open accessPreprint — published as 10.1126/science.abg3055 · Paper page
Abstract
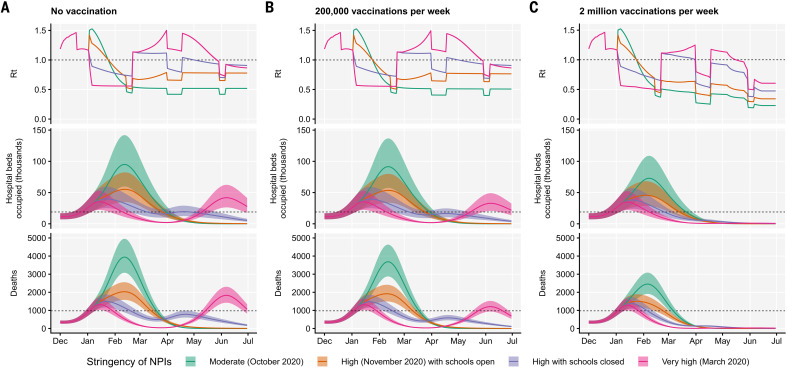
A novel SARS-CoV-2 variant, VOC 202012/01 (lineage B.1.1.7), emerged in southeast England in November 2020 and is rapidly spreading towards fixation. Using a variety of statistical and dynamic modelling approaches, we estimate that this variant has a 43–90% (range of 95% credible intervals 38–130%) higher reproduction number than preexisting variants. A fitted two-strain dynamic transmission model shows that VOC 202012/01 will lead to large resurgences of COVID-19 cases. Without stringent control measures, including limited closure of educational institutions and a greatly accelerated vaccine roll-out, COVID-19 hospitalisations and deaths across England in 2021 will exceed those in 2020. Concerningly, VOC 202012/01 has spread globally and exhibits a similar transmission increase (59–74%) in Denmark, Switzerland, and the United States.
Overview
The claims and statistics of this paper haven’t been checked yet.
Run the check — free, no account needed. It reads the open-access text and checks the sources it cites.
Integrity signals
Registry
Cites
Statistics
Figures
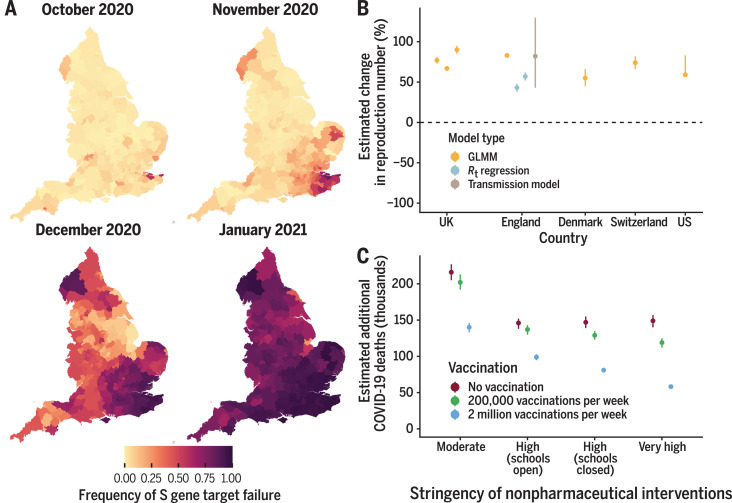
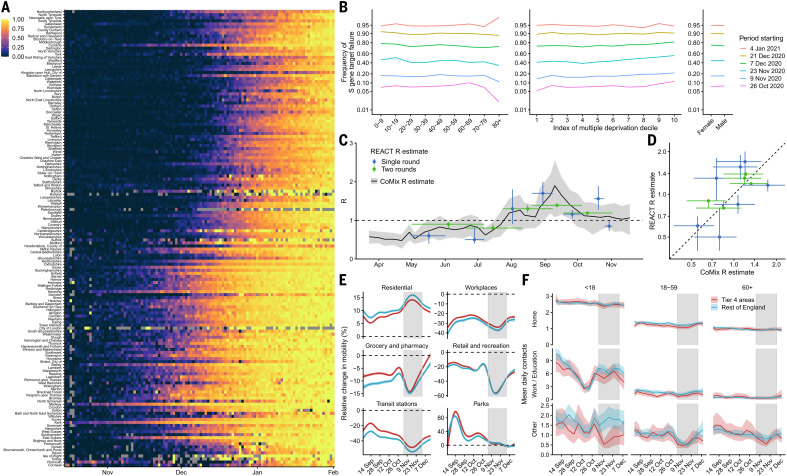
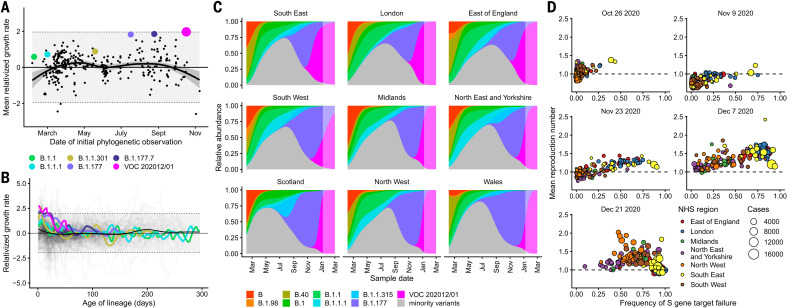
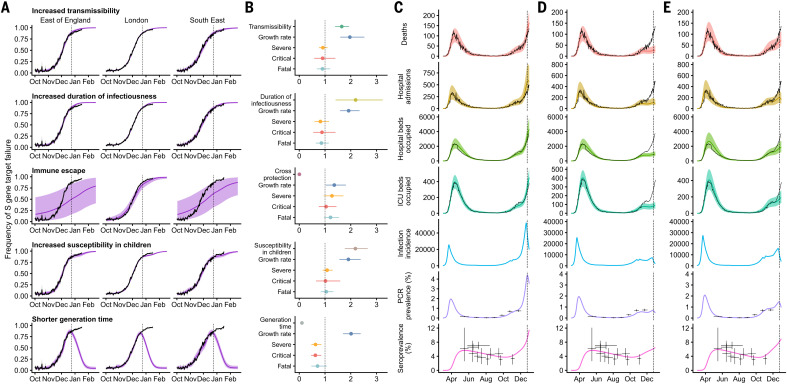
Verification
Claims the paper makes
The claims and statistics of this paper haven’t been checked yet.
Run the check — free, no account needed. It reads the open-access text and checks the sources it cites.
Claims other papers make about this one
Each is checked against this paper’s own text: does it say what the citing paper says it does?
The check wasn’t confident either way, so it gives no verdict — never disputed.
In the citing paper
“In addition, similar results have been reported by others using vaccinee and convalescent plasmas and a variety of different pseudotype and authentic virus assays15,31,45–49.”
From mRNA vaccine-elicited antibodies to SARS-CoV-2 and circulating variants (2021) · cites this paper as [15]
Experimental — accuracy not yet measuredIn the citing paper
“They are frequently sensitive to mutation in these residues and select for K417N, E484K and N501Y mutations in SARS-CoV-2 S protein expression libraries in yeast and VSV 12,15,33.”
From mRNA vaccine-elicited antibodies to SARS-CoV-2 and circulating variants (2021) · cites this paper as [15]
In the citing paper
“Additionally, K417N, Y453F, S477R, N501Y, and D614G represent circulating variants some of which have been associated with rapidly increasing case numbers14,15,19,33–35.”
From mRNA vaccine-elicited antibodies to SARS-CoV-2 and circulating variants (2021) · cites this paper as [15]
Self-check
Percentages, sums and reported differences re-computed from the paper’s own numbers.
The self-check needs the paper’s full text.
Citations
Cites
Early transmission dynamics in Wuhan, China, of novel coronavirus-infected pneumonia
Li, Q., Guan, X., Wu, P., Wang, X., Zhou, L., Tong, Y., Ren, R., Leung, K. S. M., Lau, E. H. Y., Wong, J. Y., et al. (2020) · New England Journal of Medicine · doi:10.1056/nejmoa2001316 · Cited by 16,575
Lauer, S. A., Grantz, K. H., Bi, Q., Jones, F. K., Zheng, Q., Meredith, H. R., Azman, A. S., Reich, N. G., & Lessler, J. (2020) · Annals of Internal Medicine · doi:10.7326/m20-0504 · Cited by 5,970
Ethier, S. N., & Kurtz, T. G. (1986) · Wiley series in probability and statistics · doi:10.1002/9780470316658 · Cited by 3,662
Docherty, A. B., Harrison, E. M., Green, C. A., Hardwick, H. E., Pius, R., Norman, L., Holden, K. A., Read, J. M., Dondelinger, F., Carson, G., et al. (2020) · BMJ · doi:10.1136/bmj.m1985 · Cited by 3,481
Advanced Bayesian Multilevel Modeling with the R Package brms
Bürkner, P.-C. (2018) · The R Journal · doi:10.32614/rj-2018-017 · Cited by 3,015
Social Contacts and Mixing Patterns Relevant to the Spread of Infectious Diseases
Mossong, J., Hens, N., Jit, M., Beutels, P., Auranen, K., Mikolajczyk, R., Massari, M., Salmaso, S., Tomba, G. S., Wallinga, J., et al. (2008) · PLoS Medicine · doi:10.1371/journal.pmed.0050074 · Cited by 2,900
Self-citationProjecting the transmission dynamics of SARS-CoV-2 through the postpandemic period
Kissler, S. M., Tedijanto, C., Goldstein, E., Grad, Y. H., & Lipsitch, M. (2020) · Science · doi:10.1126/science.abb5793 · Cited by 2,611
Estimated transmissibility and impact of SARS-CoV-2 lineage B.1.1.7 in England
Davies, N. G., Abbott, S., Barnard, R. C., Jarvis, C. I., Kucharski, A. J., Munday, J. D., Pearson, C. A. B., Russell, T. W., Tully, D. C., Washburne, A. D., et al. (2021) · Science · doi:10.1126/science.abg3055 · Cited by 2,581
Self-citationA dynamic nomenclature proposal for SARS-CoV-2 lineages to assist genomic epidemiology
Rambaut, A., Holmes, E. C., O’Toole, Á., Hill, V., McCrone, J. T., Ruis, C., du Plessis, L., & Pybus, O. G. (2020) · Nature Microbiology · doi:10.1038/s41564-020-0770-5 · Cited by 2,543
Tegally, H., Wilkinson, E., Giovanetti, M., Iranzadeh, A., Fonseca, V., Giandhari, J., Doolabh, D., Pillay, S., San, E. J., Msomi, N., et al. (2020) · doi:10.1101/2020.12.21.20248640 · Cited by 2,535
Cited by
Sorted by citations
Items 201–300 of 1,005
Grabowski, F., Preibisch, G., Giziński, S., Kochańczyk, M., & Lipniacki, T. (2021) · Viruses · doi:10.3390/v13030392 · Cited by 112
de Souza, W. M., Amorim, M. R., Sesti‐Costa, R., Coimbra, L. D., Brunetti, N. S., de Toledo-Teixeira, D. A., de Souza, G. F., Muraro, S. P., Parise, P. L., Barbosa, P. P., et al. (2021) · The Lancet Microbe · doi:10.1016/s2666-5247(21)00129-4 · Cited by 115
Changing composition of SARS-CoV-2 lineages and rise of Delta variant in England
Mishra, S., Mindermann, S., Sharma, M., Whittaker, C., Mellan, T. A., Wilton, T., Klapsa, D., Mate, R., Fritzsche, M., Zambon, M. C. F. A., et al. (2021) · EClinicalMedicine · doi:10.1016/j.eclinm.2021.101064 · Cited by 109
COVID-19 Vaccines: Current Understanding on Immunogenicity, Safety, and Further Considerations
He, Q., Mao, Q., Zhang, J., Bian, L., Gao, F., Wang, J., Xu, M., & Liang, Z. (2021) · Frontiers in Immunology · doi:10.3389/fimmu.2021.669339 · Cited by 112
Droplet digital RT-PCR to detect SARS-CoV-2 signature mutations of variants of concern in wastewater
Heijnen, L., Elsinga, G., de Graaf, M., Molenkamp, R., Koopmans, M., & Medema, G. J. (2021) · The Science of The Total Environment · doi:10.1016/j.scitotenv.2021.149456 · Cited by 109
Caniels, T. G., Bontjer, I., van der Straten, K., Poniman, M., Burger, J. A., Appelman, B., Lavell, A. H. A., Oomen, M., Godeke, G.-J., Valle, C., et al. (2021) · Science Advances · doi:10.1126/sciadv.abj5365 · Cited by 107
Hodcroft, E. B., Domman, D., Snyder, D. J., Oguntuyo, K. Y., Diest, M. V., Densmore, K. H., Schwalm, K. C., Femling, J., Carroll, J. L., Scott, R. S., et al. (2021) · medRxiv · doi:10.1101/2021.02.12.21251658 · Cited by 110
Montero, C. G., Fraile‐Μartinez, O., Bravo, C., Torres‐Carranza, D., Sánchez‐Trujillo, L., Gomez-Lahoz, A. M., Guijarro, L. G., García‐Honduvilla, N., Asúnsolo, Á., Buján, J., et al. (2021) · Vaccines · doi:10.3390/vaccines9050433 · Cited by 112
Replication kinetics and infectivity of SARS-CoV-2 variants of concern in common cell culture models
Mautner, L., Hoyos, M., Dangel, A., Berger, C., Ehrhardt, A., & Baiker, A. E. (2022) · Virology Journal · doi:10.1186/s12985-022-01802-5 · Cited by 107
Reinfection in patients with COVID-19: a systematic review
Ren, X., Zhou, J., Guo, J., Hao, C., Zheng, M., Zhang, R., Huang, Q. Y., Yao, X., Li, R., & Jin, Y. (2022) · Global Health Research and Policy · doi:10.1186/s41256-022-00245-3 · Cited by 104
Morvan, M., Jacomo, A. L., Souque, C., Wade, M. J., Hoffmann, T., Pouwels, K. B., Lilley, C. J., Singer, A. C., Porter, J., Evens, N. P., et al. (2022) · Nature Communications · doi:10.1038/s41467-022-31753-y · Cited by 100
Recent developments in the immunopathology of COVID ‐19
Zhang, H., Sun, Y., Wang, Y., Yazıcı, D., Azkur, D., Öğülür, İ., Azkur, A. K., Yang, Z., Chen, X., Zhang, A., et al. (2022) · Allergy · doi:10.1111/all.15593 · Cited by 115
An action plan for pan-European defence against new SARS-CoV-2 variants
Priesemann, V., Balling, R., Brinkmann, M. M., Ciesek, S., Czypionka, T., Eckerle, I., Giordano, G., Hanson, C., Hel, Z., Hotulainen, P., et al. (2021) · The Lancet · doi:10.1016/s0140-6736(21)00150-1 · Cited by 107
Neutralizing activity of Sputnik V vaccine sera against SARS-CoV-2 variants
Ikegame, S., Siddiquey, M. N. A., Hung, C.-T., Haas, G. D., Brambilla, L., Oguntuyo, K. Y., Kowdle, S., Chiu, H.-P., Stevens, C. S., Vilardo, A. E., et al. (2021) · Nature Communications · doi:10.1038/s41467-021-24909-9 · Cited by 141
Dyson, L., Hill, E. M., Moore, S., Curran-Sebastian, J. L., Tildesley, M. J., Lythgoe, K., House, T., Pellis, L., & Keeling, M. J. (2021) · Nature Communications · doi:10.1038/s41467-021-25915-7 · Cited by 104
Genomic reconstruction of the SARS-CoV-2 epidemic in England
Vöhringer, H. S., Sanderson, T., Sinnott, M., Maio, N. D., Nguyen, T., Goater, R., Schwach, F., Harrison, I., Hellewell, J., Ariani, C. V., et al. (2021) · Nature · doi:10.1038/s41586-021-04069-y · Cited by 108
An update on COVID-19: SARS-CoV-2 variants, antiviral drugs, and vaccines
Hillary, V. E., & Ceasar, S. A. (2023) · Heliyon · doi:10.1016/j.heliyon.2023.e13952 · Cited by 121
Accelerated vaccine rollout is imperative to mitigate highly transmissible COVID-19 variants
Sah, P., VILCHES, T. N., Moghadas, S. M., Fitzpatrick, M. C., Singer, B. H., Hotez, P. J., & Galvani, A. P. (2021) · EClinicalMedicine · doi:10.1016/j.eclinm.2021.100865 · Cited by 108
Isolation and characterization of cross-neutralizing coronavirus antibodies from COVID-19+ subjects
Jennewein, M. F., MacCamy, A. J., Akins, N. R., Feng, J., Homad, L. J., Hurlburt, N. K., Seydoux, E., Wan, Y.-H., Stuart, A. B., Edara, V. V., et al. (2021) · Cell Reports · doi:10.1016/j.celrep.2021.109353 · Cited by 108
Evolution of enhanced innate immune evasion by the SARS-CoV-2 B.1.1.7 UK variant
Thorne, L. G., Bouhaddou, M., Reuschl, A.-K., Zuliani-Alvarez, L., Polacco, B., Pelin, A., Batra, J., Whelan, M. V. X., Ummadi, M., Rojc, A., et al. (2021) · doi:10.1101/2021.06.06.446826 · Cited by 91
The Emerging Concern and Interest SARS-CoV-2 Variants
Janik, E., Niemcewicz, M., Podogrocki, M., Majsterek, I., & Bijak, M. (2021) · Pathogens · doi:10.3390/pathogens10060633 · Cited by 113
HIV-1 and SARS-CoV-2: Patterns in the evolution of two pandemic pathogens
Fischer, W., Giorgi, E. E., Chakraborty, S., Nguyen, K., Tanmoy Bhattacharya, A., Theiler, J. P., Goloboff, P. A., Yoon, H., Abfalterer, W., Foley, B. T., et al. (2021) · Cell Host & Microbe · doi:10.1016/j.chom.2021.05.012 · Cited by 109
Dupont, L., Snell, L. B., Graham, C., Seow, J., Merrick, B., Lechmere, T., Maguire, T. J. A., Hallett, S. R., Pickering, S., Charalampous, T., et al. (2021) · Nature Microbiology · doi:10.1038/s41564-021-00974-0 · Cited by 102
Enhanced fitness of SARS-CoV-2 variant of concern Alpha but not Beta
Ulrich, L., Halwe, N. J., Taddeo, A., Ebert, N., Schön, J., Devisme, C., Trüeb, B. S., Hoffmann, B., Wider, M., Fan, X., et al. (2021) · Nature · doi:10.1038/s41586-021-04342-0 · Cited by 98
The real-life impact of vaccination on COVID-19 mortality in Europe and Israel
Jabłońska, K., Aballéa, S., & Toumi, M. (2021) · Public Health · doi:10.1016/j.puhe.2021.07.037 · Cited by 106
Sun, D., Sang, Z., Kim, Y. J., Xiang, Y., Cohen, T., Belford, A. K., Huet, A., Conway, J. F., Sun, J., Taylor, D. J., et al. (2021) · Nature Communications · doi:10.1038/s41467-021-24963-3 · Cited by 96
Natural and Experimental SARS-CoV-2 Infection in Domestic and Wild Animals
Meekins, D. A., Gaudreault, N. N., & Richt, J. A. (2021) · Viruses · doi:10.3390/v13101993 · Cited by 105
The global epidemic of SARS‐CoV‐2 variants and their mutational immune escape
Tian, D., Sun, Y., Zhou, J., & Ye, Q. (2021) · Journal of Medical Virology · doi:10.1002/jmv.27376 · Cited by 106
Tauzin, A., Gong, S. Y., Beaudoin-Bussières, G., Vézina, D., Gasser, R., Nault, L., Marchitto, L., Benlarbi, M., Chatterjee, D., Nayrac, M., et al. (2021) · Cell Host & Microbe · doi:10.1016/j.chom.2021.12.004 · Cited by 106
Bayarri‐Olmos, R., Rosbjerg, A., Johnsen, L. B., Helgstrand, C., Bak-Thomsen, T. H., Garred, P., & Skjoedt, M. (2021) · Journal of Biological Chemistry · doi:10.1016/j.jbc.2021.100536 · Cited by 99
The COVID-19 Pandemic: a Threat to Antimicrobial Resistance Containment
Founou, R. C., Blocker, A., Noubom, M., Tsayem, C., Choukem, S. P., van Dongen, M. B. M., & Founou, L. L. (2021) · Future Science OA · doi:10.2144/fsoa-2021-0012 · Cited by 108
Pascarella, S., Ciccozzi, M., Zella, D., Bianchi, M., Benedetti, F., Benvenuto, D., Broccolo, F., Cauda, R., Caruso, A., Angeletti, S., et al. (2021) · Journal of Medical Virology · doi:10.1002/jmv.27210 · Cited by 100
Radvák, P., Kwon, H., Košíková, M., Ortega‐Rodriguez, U., Xiang, R., Phue, J., Shen, R., Rozzelle, J., Kapoor, N., Rabara, T. R., et al. (2021) · Nature Communications · doi:10.1038/s41467-021-26803-w · Cited by 95
Role of COVID-19 Vaccines in SARS-CoV-2 Variants
Zhou, Z., Zhu, Y., & Chu, M. (2022) · Frontiers in Immunology · doi:10.3389/fimmu.2022.898192 · Cited by 115
Could new COVID variants undermine vaccines? Labs scramble to find out
Callaway, E. (2021) · Nature · doi:10.1038/d41586-021-00031-0 · Cited by 102
Signatures in SARS-CoV-2 spike protein conferring escape to neutralizing antibodies
Alenquer, M., Ferreira, F., Lousa, D., Valério, M., Medina-Lopes, M., Bergman, M., Gonçalves, J., Demengeot, J., Leite, R. B., Lilue, J., et al. (2021) · PLoS Pathogens · doi:10.1371/journal.ppat.1009772 · Cited by 101
COVID-19: Why does disease severity vary among individuals?
Samadizadeh, S., Masoudi, M., Rastegar, M., Salimi, V., Shahbaz, M. B., & Tahamtan, A. (2021) · Respiratory Medicine · doi:10.1016/j.rmed.2021.106356 · Cited by 100
Population impact of SARS-CoV-2 variants with enhanced transmissibility and/or partial immune escape
Bushman, M., Kahn, R. J., Taylor, B. P., Lipsitch, M., & Hanage, W. P. (2021) · Cell · doi:10.1016/j.cell.2021.11.026 · Cited by 93
Risk of hospital admission for patients with SARS-CoV-2 variant B.1.1.7: cohort analysis
Nyberg, T., Twohig, K. A., Harris, R., Seaman, S. R., Flannagan, J., Allen, H., Charlett, A., Angelis, D. D., Dabrera, G., & Presanis, A. M. (2021) · BMJ · doi:10.1136/bmj.n1412 · Cited by 133
Deshpande, A. A., Harris, B. D., Martínez‐Sobrido, L., Kobie, J. J., & Walter, M. R. (2021) · Frontiers in Immunology · doi:10.3389/fimmu.2021.691715 · Cited by 94
Phase 2/3 Trial of Molnupiravir for Treatment of Covid-19 in Nonhospitalized Adults
Caraco, Y., Crofoot, G. E., Moncada, P. A., Galustyan, A. N., Musungaie, D. B., Payne, B. A. I., Kovalchuk, E., Gonzalez, A., Brown, M. L. H., Williams‐Diaz, A., et al. (2021) · NEJM Evidence · doi:10.1056/evidoa2100043 · Cited by 103
Increased transmissibility of SARS-CoV-2 lineage B.1.1.7 by age and viral load
Lyngse, F. P., Mølbak, K., Skov, R. L., Christiansen, L. E., Mortensen, L. H., Albertsen, M., Møller, C. H., Krause, T. G., Rasmussen, M., Michaelsen, T. Y., et al. (2021) · Nature Communications · doi:10.1038/s41467-021-27202-x · Cited by 88
Grint, D. J., Wing, K., Houlihan, C. F., Gibbs, H. P., Evans, S. J. W., Williamson, E., McDonald, H. I., Bhaskaran, K., Evans, D., Walker, A. J., et al. (2021) · Clinical Infectious Diseases · doi:10.1093/cid/ciab754 · Cited by 92
Self-citationRisk of rapid evolutionary escape from biomedical interventions targeting SARS-CoV-2 spike protein
Egeren, D. V., Novokhodko, A., Stoddard, M., Tran, U., Zetter, B. R., Rogers, M. S., Pentelute, B. L., Carlson, J. M., Hixon, M. S., Joseph‐McCarthy, D., et al. (2021) · PLoS ONE · doi:10.1371/journal.pone.0250780 · Cited by 91
Wang, H., Miller, J. A., Verghese, M., Sibai, M., Solis, D., Mfuh, K. O., Jiang, B., Iwai, N., Mar, M., Huang, C., et al. (2021) · Journal of Clinical Microbiology · doi:10.1128/jcm.00859-21 · Cited by 93
The importance of non-pharmaceutical interventions during the COVID-19 vaccine rollout
Gozzi, N., Bajardi, P., & Perra, N. (2021) · PLoS Computational Biology · doi:10.1371/journal.pcbi.1009346 · Cited by 95
Tortorici, M. A., Walls, A. C., Joshi, A., Park, Y., Eguia, R. T., Miranda, M. C., Kepl, E., Dosey, A. M., Stevens‐Ayers, T., Boeckh, M. J., et al. (2022) · Cell · doi:10.1016/j.cell.2022.05.019 · Cited by 89
B cell genomics behind cross-neutralization of SARS-CoV-2 variants and SARS-CoV
Scheid, J. F., Barnes, C. O., Eraslan, B., Hudak, A., Keeffe, J. R., Cosimi, L. A., Brown, E., Muecksch, F., Weisblum, Y., Zhang, S., et al. (2021) · Cell · doi:10.1016/j.cell.2021.04.032 · Cited by 90
Paul, P., France, A. M., Aoki, Y., Batra, D., Biggerstaff, M., Dugan, V., Galloway, S., Hall, A. J., Johansson, M. A., Kondor, R. J., et al. (2021) · MMWR. Morbidity and Mortality Weekly Report · doi:10.15585/mmwr.mm7023a3 · Cited by 92
Molecular evolutionary characteristics of SARS‐CoV‐2 emerging in the United States
Wang, S., Xu, X., Wei, C., Li, S., Zhao, J., Zheng, Y., Liu, X., Zeng, X., Yuan, W., & Peng, S. (2021) · Journal of Medical Virology · doi:10.1002/jmv.27331 · Cited by 87
Averting an Outbreak of SARS-CoV-2 in a University Residence Hall through Wastewater Surveillance
Corchis-Scott, R., Geng, Q., Seth, R., Ray, R., Beg, M. R., Biswas, N., Charron, L., Drouillard, K., D’Souza, R., Heath, D. D., et al. (2021) · Microbiology Spectrum · doi:10.1128/spectrum.00792-21 · Cited by 92
Bekliz, M., Adea, K., Vetter, P., Eberhardt, C. S., Hosszu-Fellous, K., Vu, D., Puhach, O., Essaidi-Laziosi, M., Waldvogel‐Abramowski, S., Stephan, C., et al. (2022) · Nature Communications · doi:10.1038/s41467-022-31556-1 · Cited by 86
COVID-19 transmission dynamics underlying epidemic waves in Kenya
Brand, S. P. C., Ojal, J., Aziza, R., Were, V. O., Okiro, E. A., Kombe, I. K., Mburu, C., Ogero, M. O., Agweyu, A., Warimwe, G. M., et al. (2021) · Science · doi:10.1126/science.abk0414 · Cited by 85
Silva, R. P., Huang, Y., Nguyen, A. W., Hsieh, C., Olaluwoye, O. S., Kaoud, T. S., Wilen, R. E., Qerqez, A. N., Park, J., Khalil, A. M., et al. (2023) · eLife · doi:10.7554/elife.83710 · Cited by 86
Kumar, M., Gulati, S., Ansari, A. H., Phutela, R., Acharya, S., Azhar, M., Murthy, J., Kathpalia, P., Kanakan, A., Maurya, R., et al. (2021) · eLife · doi:10.7554/elife.67130 · Cited by 88
Predicting the zoonotic capacity of mammals to transmit SARS-CoV-2
Fischhoff, I. R., Castellanos, A. A., Rodrigues, J., Varsani, A., & Han, B. A. (2021) · Proceedings of the Royal Society B Biological Sciences · doi:10.1098/rspb.2021.1651 · Cited by 90
Population immunity predicts evolutionary trajectories of SARS-CoV-2
Meijers, M., Ruchnewitz, D., Eberhardt, J., Łuksza, M., & Lässig, M. (2023) · Cell · doi:10.1016/j.cell.2023.09.022 · Cited by 102
Structure-guided T cell vaccine design for SARS-CoV-2 variants and sarbecoviruses
Nathan, A., Rossin, E. J., Kaseke, C., Park, R. J.-H., Khatri, A., Koundakjian, D., Urbach, J. M., Singh, N. K., Bashirova, A. A., Tano-Menka, R., et al. (2021) · Cell · doi:10.1016/j.cell.2021.06.029 · Cited by 84
Quantitative SARS-CoV-2 Alpha Variant B.1.1.7 Tracking in Wastewater by Allele-Specific RT-qPCR
Lee, W. L., Imakaev, M., Armas, F., McElroy, K. A., Gu, X., Duvallet, C., Chandra, F., Chen, H., Leifels, M., Mendola, S., et al. (2021) · Environmental Science & Technology Letters · doi:10.1021/acs.estlett.1c00375 · Cited by 85
Yeh, Y.-C., Doan, L. H., Huang, Z.-Y., Chu, L.-W., Shi, T., Lee, Y., Wu, C.-T., Lin, C., Chiang, S.-T., Liu, H., et al. (2022) · Frontiers in Pharmacology · doi:10.3389/fphar.2021.765553 · Cited by 89
Peacock, T. P., Sheppard, C., Brown, J. C., Goonawardane, N., Zhou, J., Whiteley, M., de Silva, T. I., & Barclay, W. (2021) · bioRxiv (Cold Spring Harbor Laboratory) · doi:10.1101/2021.05.28.446163 · Cited by 83
Freitas, A. R. R., Beckedorff, O. A., Cavalcanti, L. P. D. G., Siqueira, A. M., de Castro, D. B., da Costa, C. F., Lemos, D. R. Q., & de Barros, E. N. C. (2021) · The Lancet Regional Health - Americas · doi:10.1016/j.lana.2021.100021 · Cited by 123
Distinctive features of severe SARS-CoV-2 pneumonia
Budinger, G. R. S., Misharin, A. V., Ridge, K. M., Singer, B. D., & Wunderink, R. G. (2021) · Journal of Clinical Investigation · doi:10.1172/jci149412 · Cited by 87
Epistatic models predict mutable sites in SARS-CoV-2 proteins and epitopes
Rodriguez-Rivas, J., Croce, G., Muscat, M., & Weigt, M. (2022) · Proceedings of the National Academy of Sciences · doi:10.1073/pnas.2113118119 · Cited by 86
Wang, Y., Xu, C., Wang, Y., Qin, H., Zhang, C., Li, Z., Xu, S., Zuo, Q., Liu, C., Huang, Z. W., et al. (2021) · Nature Communications · doi:10.1038/s41467-021-27350-0 · Cited by 85
Baaijens, J. A., Zulli, A., Ott, I. M., Nika, I., van der Lugt, M. J., Petrone, M. E., Alpert, T., Fauver, J. R., Kalinich, C. C., Vogels, C. B. F., et al. (2022) · Genome biology · doi:10.1186/s13059-022-02805-9 · Cited by 73
Self-citationNewman, J., Thakur, N., Peacock, T. P., Bialy, D., Elrefaey, A. M. E., Bogaardt, C., Horton, D. L., Ho, S., Kankeyan, T., Carr, C., et al. (2022) · Nature Microbiology · doi:10.1038/s41564-022-01163-3 · Cited by 85
Kong, J. D., Tekwa, E. W., & Gignoux‐Wolfsohn, S. (2021) · PLoS ONE · doi:10.1371/journal.pone.0252373 · Cited by 81
Model-driven mitigation measures for reopening schools during the COVID-19 pandemic
McGee, R. S., Homburger, J. R., Williams, H., Bergstrom, C. T., & Zhou, A. Y. (2021) · Proceedings of the National Academy of Sciences · doi:10.1073/pnas.2108909118 · Cited by 80
Broadly-Neutralizing Antibodies Against Emerging SARS-CoV-2 Variants
Shrestha, L. B., Tedla, N. T., & Bull, R. A. (2021) · Frontiers in Immunology · doi:10.3389/fimmu.2021.752003 · Cited by 78
Emerging SARS-CoV-2 Variants: Genetic Variability and Clinical Implications
Dubey, A., Choudhary, S., Kumar, P., & Tomar, S. (2021) · Current Microbiology · doi:10.1007/s00284-021-02724-1 · Cited by 79
Immunity to SARS-CoV-2 up to 15 months after infection
Marcotte, H., Piralla, A., Zuo, F., Du, L., Cassaniti, I., Wan, H., Kumagai‐Braesch, M., Andréll, J., Percivalle, E., Sammartino, J. C., et al. (2022) · iScience · doi:10.1016/j.isci.2022.103743 · Cited by 83
Screening and vaccination against COVID-19 to minimise school closure: a modelling study
Colosi, E., Bassignana, G., Contreras, D. A., Poirier, C., Boëlle, P., Cauchemez, S., Yazdanpanah, Y., Lina, B., Fontanet, A. L., Barrat, A., et al. (2021) · The Lancet Infectious Diseases · doi:10.1016/s1473-3099(22)00138-4 · Cited by 82
Towards evolutionary predictions: Current promises and challenges
Wortel, M. T., Agashe, D., Bailey, S. F., Bank, C., Bisschop, K., Blankers, T., Cairns, J., Colizzi, E. S., Cusseddu, D., Desai, M. M., et al. (2022) · Evolutionary Applications · doi:10.1111/eva.13513 · Cited by 80
Impact of SARS-CoV-2 ORF6 and its variant polymorphisms on host responses and viral pathogenesis
Kehrer, T., Čupić, A., Ye, C., Yildiz, S., Bouhaddou, M., Crossland, N. A., Barrall, E. A., Cohen, P., Tseng, A. E., Çağatay, T., et al. (2023) · Cell Host & Microbe · doi:10.1016/j.chom.2023.08.003 · Cited by 87
Chen, C., Boorla, V. S., Banerjee, D., Chowdhury, R., Cavener, V. S., Nissly, R. H., Gontu, A., Boyle, N. R., Vandegrift, K. J., Nair, M. S., et al. (2021) · Proceedings of the National Academy of Sciences · doi:10.1073/pnas.2106480118 · Cited by 81
Verelst, F., Hermans, L., Vercruysse, S., Gimma, A., Coletti, P., Backer, J. A., Wong, K. L., Wambua, J., van Zandvoort, K., Willem, L., et al. (2021) · BMC Medicine · doi:10.1186/s12916-021-02133-y · Cited by 83
Self-citationParedes, M. I., Lunn, S. M., Famulare, M., Frisbie, L. A., Painter, I. S., Burstein, R., Roychoudhury, P., Xie, H. J., Bakhash, S. A. M., Perez, R., et al. (2022) · Clinical Infectious Diseases · doi:10.1093/cid/ciac279 · Cited by 80
SARS-CoV-2 Quasispecies Provides an Advantage Mutation Pool for the Epidemic Variants
Sun, F., Wang, X., Tan, S., Dan, Y., Lu, Y., Zhang, J., Xu, J., Tan, Z., Xiang, X., Zhou, Y., et al. (2021) · Microbiology Spectrum · doi:10.1128/spectrum.00261-21 · Cited by 76
Increased small particle aerosol transmission of B.1.1.7 compared with SARS-CoV-2 lineage A in vivo
Port, J. R., Yinda, C. K., Avanzato, V. A., Schulz, J. E., Holbrook, M. G., van Doremalen, N., Shaia, C., Fischer, R. J., & Munster, V. J. (2022) · Nature Microbiology · doi:10.1038/s41564-021-01047-y · Cited by 77
Emerging Vaccine-Breakthrough SARS-CoV-2 Variants
Wang, R., Chen, J., Hozumi, Y., Yin, C., & Wei, G. (2022) · ACS Infectious Diseases · doi:10.1021/acsinfecdis.1c00557 · Cited by 82
Rapid, adaptable and sensitive Cas13-based COVID-19 diagnostics using ADESSO
Casati, B., Verdi, J., Hempelmann, A., Kittel, M., Klaebisch, A. G., Meister, B., Welker, S., Asthana, S., Giorgio, S. D., Boskovic, P., et al. (2022) · Nature Communications · doi:10.1038/s41467-022-30862-y · Cited by 81
Rotondo, J. C., Martini, F., Maritati, M., Mazziotta, C., Mauro, G. D., Lanzillotti, C., Barp, N., Gallerani, A., Tognon, M. G., & Contini, C. (2021) · Viruses · doi:10.3390/v13091687 · Cited by 81
Karita, H. C. S., Dong, T. Q., Johnston, C., Neuzil, K. M., Paasche‐Orlow, M. K., KISSINGER, P. J., Bershteyn, A., Thorpe, L. E., Deming, M. E., Kottkamp, A. C., et al. (2022) · JAMA Network Open · doi:10.1001/jamanetworkopen.2021.42796 · Cited by 79
Jin, L., Li, Z., Zhang, X., Li, J., & Zhu, F. (2022) · Human Vaccines & Immunotherapeutics · doi:10.1080/21645515.2022.2096970 · Cited by 83
Direct comparison of antibody responses to four SARS-CoV-2 vaccines in Mongolia
Dashdorj, N., Wirz, O. F., Röltgen, K., Haraguchi, E., Buzzanco, A. S., Sibai, M., Wang, H., Miller, J. A., Solis, D., Sahoo, M. K., et al. (2021) · Cell Host & Microbe · doi:10.1016/j.chom.2021.11.004 · Cited by 76
Tracking the Emergence of SARS-CoV-2 Alpha Variant in the United Kingdom
Walker, A. S., Vihta, K.-D., Gethings, O., Pritchard, E., Jones, J. W., House, T., Bell, I., Bell, J. I., Newton, J. N., Farrar, J., et al. (2021) · New England Journal of Medicine · doi:10.1056/nejmc2103227 · Cited by 76
Leung, K. S. M., Wu, J. T. K., & Leung, G. M. (2021) · The Lancet Public Health · doi:10.1016/s2468-2667(21)00167-5 · Cited by 79
Machado, B. A. S., Hodel, K. V. S., Fonseca, L. M. D. S., Pires, V. C., Mascarenhas, L. A. B., Andrade, L. P. C. D. S., Moret, M. A., & Badaró, R. J. D. S. (2022) · Vaccines · doi:10.3390/vaccines10040591 · Cited by 79
Nemudryi, A. A., Nemudraia, A., Wiegand, T., Nichols, J. E., Snyder, D. T., Hedges, J. F., Cicha, C., Lee, H., Vanderwood, K. K., Bimczok, D., et al. (2021) · Cell Reports · doi:10.1016/j.celrep.2021.109197 · Cited by 78
The impact of school reopening on the spread of COVID-19 in England
Keeling, M. J., Tildesley, M. J., Atkins, B. D., Penman, B. S., Southall, E., Guyver‐Fletcher, G., Holmes, A., McKimm, H., Gorsich, E. E., Hill, E. M., et al. (2021) · Philosophical Transactions of the Royal Society B Biological Sciences · doi:10.1098/rstb.2020.0261 · Cited by 78
The global transmission of new coronavirus variants
Zhao, Y., Huang, J., Zhang, L., Chen, S., Gao, J., & Jiao, H. (2021) · Environmental Research · doi:10.1016/j.envres.2021.112240 · Cited by 73
Fareh, M., Zhao, W. D., Hu, W., Casan, J. M. L., Kumar, A., Symons, J., Zerbato, J. M., Fong, D., Voskoboinik, I., Ekert, P. G., et al. (2021) · Nature Communications · doi:10.1038/s41467-021-24577-9 · Cited by 74
Virologic Features of Severe Acute Respiratory Syndrome Coronavirus 2 Infection in Children
Yonker, L. M., Boucau, J., Regan, J., Choudhary, M. C., Burns, M. D., Young, N. R., Farkas, E. J., Davis, J. P., Moschovis, P. P., Kinane, T. B., et al. (2021) · The Journal of Infectious Diseases · doi:10.1093/infdis/jiab509 · Cited by 76
Role of genomics in combating COVID-19 pandemic
Saravanan, K. A., Panigrahi, M., Kumar, H., Rajawat, D., Nayak, S. S., Bhushan, B., & Dutt, T. (2022) · Gene · doi:10.1016/j.gene.2022.146387 · Cited by 81
Davis, J. J., Long, S. W., Christensen, P. A., Olsen, R. J., Olson, R., Shukla, M., Subedi, S., Stevens, R., & Musser, J. M. (2021) · Microbiology Spectrum · doi:10.1128/spectrum.01803-21 · Cited by 75
SARS-CoV-2 variants and COVID-19 vaccines: Current challenges and future strategies
Gong, W., Parkkila, S., Wu, X., & Aspatwar, A. (2022) · International Reviews of Immunology · doi:10.1080/08830185.2022.2079642 · Cited by 75
Verkhivker, G. M., Agajanian, S., Öztaş, D. Y., & Gupta, G. (2021) · Biochemistry · doi:10.1021/acs.biochem.1c00139 · Cited by 62
Metadata
- Authors
- Davies, N. G., Abbott, S., Barnard, R. C., Jarvis, C. I., Kucharski, A. J., Munday, J. D., Pearson, C. A. B., Russell, T. W., Tully, D. C., Washburne, A. D., Wenseleers, T., Gimma, A., Waites, W., Wong, K. L. M., van Zandvoort, K., Silverman, J. D., CMMID COVID-19 Working Group, The COVID-19 Genomics UK (COG-UK) Consortium, Diaz-Ordaz, K., Keogh, R., Eggo, R. M., Funk, S., Jit, M., Atkins, K. E., & Edmunds, W. J.
- Affiliations
- London School of Hygiene & Tropical Medicine (GB)
- KU Leuven (BE)
- Pennsylvania State University (US)
- Corresponding author
- Davies, Nicholas G.
- ORCID
- Davies, Nicholas G.
- Abbott, Sam
- Barnard, Rosanna C.
- Jarvis, Christopher I.
- Kucharski, Adam J.
- Munday, James D.
- Pearson, Carl A. B.
- Russell, Timothy W.
- Tully, Damien C.
- Washburne, Alex D.
- Wenseleers, Tom
- Gimma, Amy
- Waites, William
- Wong, Kerry L. M.
- van Zandvoort, Kevin
- Silverman, Justin D.
- Keogh, Ruth
- Eggo, Rosalind M.
- Funk, Sebastian
- Jit, Mark
- Atkins, Katherine E.
- Edmunds, W. John
- Venue
- Science
- Publisher
- openRxiv
- Published
- 2020-12-26
- Volume
- 372
- Issue
- 6538
- ISSN
- 0036-8075 (ISSN-L)
- PMC
- PMC8128288
- OpenAlex
- W3134208712
- Cited by
- 2,557
- References
- 60
- Citations by year
- 2026: 54 · 2025: 90 · 2024: 184 · 2023: 323 · 2022: 839 · 2021: 1060 · 2020: 6
- FWCI
- 233.82
- Type
- journal article
- Language
- en
- Open access
- hybrid
- doi.org
- Licence
- cc-by
- Locations
- Science (publishedVersion, cc-by)
- medRxiv (acceptedVersion, cc-by)
- PubMed Central (publishedVersion, cc-by)
- PubMed (publishedVersion)
- University of Birmingham Research Portal (University of Birmingham) (publishedVersion, cc-by)
- ORCA Online Research @Cardiff (Cardiff University) (acceptedVersion, cc-by)
- Northumbria Research Link (Northumbria University) (acceptedVersion)
- LSHTM Research Online (London School of Hygiene and Tropical Medicine) (acceptedVersion)
- Strathprints: The University of Strathclyde institutional repository (University of Strathclyde) (acceptedVersion)
- Informationszentrum Lebenswissenschaften (ZB MED) (submittedVersion, cc-by)
- Lirias (KU Leuven) (submittedVersion, other-oa)
- Edinburgh Research Explorer (University of Edinburgh) (submittedVersion, cc-by)
- Apollo (University of Cambridge) (submittedVersion)
- Apollo
- Funders
- Bill and Melinda Gates Foundation (INV-016832, OPP1184344, INV-003174)
- University of Kentucky
- University of Bern
- Wellcome Trust (206250, 210758/Z/18/Z, 206250/Z/17/Z, Z/17/Z, 221303/Z/20/Z, 221303, 210758, 218554/Z/19/Z)
- UK Research and Innovation (ES/P010873/1, ES/P010873, MC_PC_19027)
- Universitätsspital Basel
- National Institute for Health Research Health Protection Research Unit (NIHR200908, NIHR200929)
- National Institute for Health and Care Research ((NIHR200929), MR/V027956/1, (NIHR200908), 16/137/109, 16/137/10)
- Research Councils UK (MR/S003975/1, ES/P010873/1)
- Academy of Medical Sciences (AMS-CSF4-Torok)
- University of Warwick
- European Commission (101003688, COVID-19, 19065)
- Public Health England
- CANDU Owners Group
- Eidgenössische Technische Hochschule Zürich
- Hôpitaux Universitaires de Genève
- Université de Sfax
- Foreign, Commonwealth and Development Office (221303/Z/20/Z)
- Medical Research Council (MR/S003975/1, 206250/Z/17/Z, MR/V027956/1, NIHR200908, COVID-19, MC_PC_19065)
- Economic and Social Research Council (ES/P010873/1)
- Statens Serum Institut
- Research England
- National Institute of General Medical Sciences (T32GM145449)
- H2020 European Research Council (757688)
- Health Data Research UK
- Topics
- Physical Sciences › Mathematics › Modeling and Simulation › COVID-19 epidemiological studies
- Health Sciences › Medicine › Infectious Diseases › SARS-CoV-2 and COVID-19 Research
- Physical Sciences › Mathematics › Applied Mathematics › Mathematical and Theoretical Epidemiology and Ecology Models
- Keywords
- SARS-CoV-2, B.1.1.7 variant, reproduction number, SARS-CoV-2 transmission, epidemic forecasting, COVID-19 containment measures, vaccine rollout, school closures, England
- MeSH terms
- COVID-19, SARS-CoV-2, COVID-19 Vaccines, Adolescent, Adult, Aged, Aged, 80 and over, Child, Child, Preschool, Communicable Disease Control, England, Europe, Female, Humans, Infant, Male, Middle Aged, Models, Theoretical, Mutation, Severity of Illness Index, Socioeconomic Factors, United States, Viral Load, Basic Reproduction Number, Young Adult
About these checks
Registry, retraction, Cites and statistics results are computed, not judged, with one exception: a printed reference that no index lists is read once by a model before it counts as a citation error. Claims are extracted by a model and kept only when their quote appears verbatim in the text; each cited source is then checked, with a model’s help, for whether it says what the claim relies on. Those verdicts can be wrong — read the claim’s quote and the cited source before relying on one.
Statistics and arithmetic are recomputed, not judged.
Confidence bands are shown only for fields calibrated on our annotated test set. None is calibrated yet, so no band is shown.
What counts as a claim ›How we measure confidence ›How we check this ›
Are you an author, or do you see a problem with this page? Request a review
