

The DOI matches its Crossref record; 43 of the 43 references it cites were found in a registry or an index.
Genomic characterization and Epidemiology of an emerging SARS-CoV-2 variant in Delhi, India
Open accessPreprint — published as 10.1126/science.abj9932
Abstract
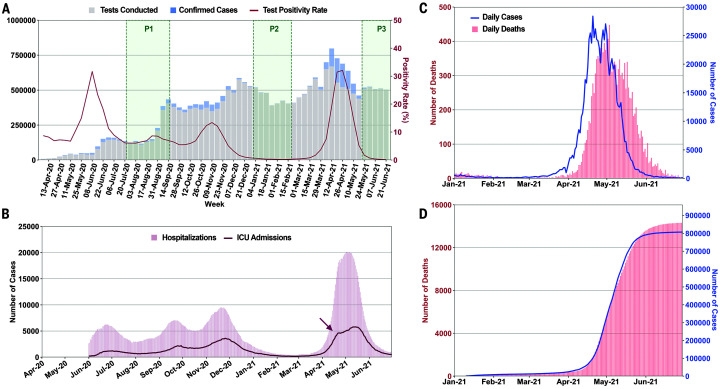
Delhi, the national capital of India, has experienced multiple SARS-CoV-2 outbreaks in 2020 and reached a population seropositivity of over 50% by 2021. During April 2021, the city became overwhelmed by COVID-19 cases and fatalities, as a new variant B.1.617.2 (Delta) replaced B.1.1.7 (Alpha). A Bayesian model explains the growth advantage of Delta through a combination of increased transmissibility and partial reduction of immunity elicited by prior infection (median estimates; ×1.5-fold, 20% reduction). Seropositivity of an employee and family cohort increased from 42% to 86% between March and July 2021, with 27% reinfections, as judged by increased antibody concentration after previous decline. The likely high transmissibility and partial evasion of immunity by the Delta variant contributed to an overwhelming surge in Delhi. One-Sentence Summary: Delhi experienced an overwhelming surge of COVID-19 cases and fatalities peaking in May 2021 as the highly transmissible and immune evasive Delta variant replaced the Alpha variant.
Overview
The claims and statistics of this paper haven’t been checked yet.
Run the check — free, no account needed. It reads the open-access text and checks the sources it cites.
Integrity signals
Registry
Cites
Statistics
Figures


Verification
Claims the paper makes
The claims and statistics of this paper haven’t been checked yet.
Run the check — free, no account needed. It reads the open-access text and checks the sources it cites.
Claims other papers make about this one
Each is checked against this paper’s own text: does it say what the citing paper says it does?
In the citing paper
“Studies in India have estimated that the delta variant could be up to 50% more transmissible than the alpha variant.8”
From Hospital admission and emergency care attendance risk for SARS-CoV-2 delta (B.1.617.2) compared with alpha (B.1.1.7) variants of concern: a cohort study (2022) · cites this paper as [8]
Self-check
Percentages, sums and reported differences re-computed from the paper’s own numbers.
The self-check needs the paper’s full text.
Citations
Cites
IQ-TREE 2: New Models and Efficient Methods for Phylogenetic Inference in the Genomic Era
Minh, B. Q., Schmidt, H. A., Chernomor, O., Schrempf, D., Woodhams, M. D., von Haeseler, A., & Lanfear, R. (2020) · Molecular Biology and Evolution · doi:10.1093/molbev/msaa015 · Cited by 16,873
A new coronavirus associated with human respiratory disease in China
Wu, F., Zhao, S., Yu, B., Chen, Y.-M., Wang, W., Song, Z.-G., Hu, Y., Tao, Z.-W., Tian, J.-H., Pei, Y.-Y., et al. (2020) · Nature · doi:10.1038/s41586-020-2008-3 · Cited by 11,688
Estimating the effects of non-pharmaceutical interventions on COVID-19 in Europe
Flaxman, S. R., Mishra, S., Gandy, A., Unwin, H. J. T., Mellan, T. A., Coupland, H., Whittaker, C., Zhu, H., Berah, T., Eaton, J. W., et al. (2020) · Nature · doi:10.1038/s41586-020-2405-7 · Cited by 3,398
Self-citationNextstrain: real-time tracking of pathogen evolution
Hadfield, J., Megill, C., Bell, S. M., Huddleston, J., Potter, B., Callender, C., Sagulenko, P., Bedford, T., & Neher, R. A. (2018) · Bioinformatics · doi:10.1093/bioinformatics/bty407 · Cited by 3,154
GISAID: Global initiative on sharing all influenza data – from vision to reality
Shu, Y., & McCauley, J. (2017) · Eurosurveillance · doi:10.2807/1560-7917.es.2017.22.13.30494 · Cited by 3,039
Effectiveness of Covid-19 Vaccines against the B.1.617.2 (Delta) Variant
Lopez Bernal, J., Andrews, N., Gower, C., Gallagher, E., Simmons, R., Thelwall, S., Stowe, J., Tessier, E., Groves, N., Dabrera, G., et al. (2021) · New England Journal of Medicine · doi:10.1056/nejmoa2108891 · Cited by 2,889
Immunological memory to SARS-CoV-2 assessed for up to 8 months after infection.
Dan, J. M., Mateus, J., Kato, Y., Hastie, K. M., Yu, E. D., Faliti, C. E., Grifoni, A., Ramirez, S. I., Haupt, S., Frazier, A., et al. (2021) · Science · doi:10.1126/science.abf4063 · Cited by 2,656
Estimated transmissibility and impact of SARS-CoV-2 lineage B.1.1.7 in England
Davies, N. G., Abbott, S., Barnard, R. C., Jarvis, C. I., Kucharski, A. J., Munday, J. D., Pearson, C. A. B., Russell, T. W., Tully, D. C., Washburne, A. D., et al. (2021) · Science · doi:10.1126/science.abg3055 · Cited by 2,581
A dynamic nomenclature proposal for SARS-CoV-2 lineages to assist genomic epidemiology
Rambaut, A., Holmes, E. C., O’Toole, Á., Hill, V., McCrone, J. T., Ruis, C., du Plessis, L., & Pybus, O. G. (2020) · Nature Microbiology · doi:10.1038/s41564-020-0770-5 · Cited by 2,543
Folegatti, P. M., Ewer, K. J., Aley, P. K., Angus, B., Becker, S., Belij-Rammerstorfer, S., Bellamy, D., Bibi, S., Bittaye, M., Clutterbuck, E. A., et al. (2020) · The Lancet · doi:10.1016/s0140-6736(20)31604-4 · Cited by 2,419
Research works printed but not linked: 1
- Ferreira, Isabella et al. SARS-CoV-2 B.1.617 mutations L452 and E484Q are not synergistic for antibody evasion. The Journal of infectious diseases, jiab368.
Cited by
Sorted by citations
Items 201–298 of 298
Dynamic expedition of leading mutations in SARS-CoV-2 spike glycoproteins
Hasan, M., He, Z., Jia, M., Leung, A. C. F., Natarajan, K., Xu, W., Yap, S., Zhou, F., Chen, S., Su, H., et al. (2024) · Computational and Structural Biotechnology Journal · doi:10.1016/j.csbj.2024.05.037 · Cited by 3
Dynamics of an influenza epidemic model incorporating immune boosting and Ornstein–Uhlenbeck process
Tan, Y., & Yao, R. (2024) · Chaos Solitons & Fractals · doi:10.1016/j.chaos.2024.115446 · Cited by 3
Cleary, E., Atuhaire, F., Sorichetta, A., Ruktanonchai, N., Ruktanonchai, C., Cunningham, A., Pasqui, M., Schiavina, M., Melchiorri, M., Bondarenko, M., et al. (2025) · PLOS Global Public Health · doi:10.1371/journal.pgph.0003431 · Cited by 3
Wang, C., Li, Y., Pan, Y., Zhou, L., Zhang, X., Yan, W., Guo, F., Shu, Y., & Gao, J. (2022) · Journal of Zhejiang University SCIENCE B · doi:10.1631/jzus.b2200054 · Cited by 3
Phylogeny and evolution of SARS-CoV-2 during Delta and Omicron variant waves in India
Singh, U. B., Deb, S., Rani, L., Gupta, R., Verma, S., Kumari, L., Bhardwaj, D., Bala, K., Ahmed, J., Gourav, S., et al. (2023) · Journal of Biomolecular Structure and Dynamics · doi:10.1080/07391102.2023.2222832 · Cited by 6
Self-citationYadav, P. D., Sardana, V., Deshpande, G. R., Shinde, P., Thangaraj, J. W. V., George, L. S., Sapkal, G. N., Patil, D. Y., Sahay, R. R., Shete, A. M., et al. (2024) · International Journal of Microbiology Research · doi:10.4103/ijmr.ijmr_948_23 · Cited by 3
Self-citationMoisan, A., Soares, A., Oliveira, F. D., Alessandri-Gradt, É., Lecoquierre, F., Fourneaux, S., Plantier, J., & Gueudin, M. (2023) · Viruses · doi:10.3390/v15051115 · Cited by 3
Malhotra, S., Mani, K., Lodha, R., Bakhshi, S., Mathur, V. P., Gupta, P., Kedia, S., Sankar, J., Kumar, P., Kumar, A., et al. (2025) · The National Medical Journal of India · doi:10.25259/nmji_726_2022 · Cited by 3
A simple stochastic theory of extinction shows rapid elimination of a Sars-like pandemicPreprint
Khatri, B. S. (2020) · medRxiv · doi:10.1101/2020.08.10.20171454 · Cited by 3
Lam, J. H., Shivhare, D., Chia, T. W., Chew, S. L., Sinsinbar, G., Aw, T. Y., Wong, S., Venkatraman, S., Lim, F. W. I., Vandepapelière, P., et al. (2022) · bioRxiv (Cold Spring Harbor Laboratory) · doi:10.1101/2022.02.12.480188 · Cited by 3
Genomics and infectious diseases: Lessons learnt from the COVID-19 pandemic
Jolly, B., & Scaria, V. (2024) · Elsevier eBooks · doi:10.1016/b978-0-323-91799-5.00020-6 · Cited by 2
Self-citationAmini, K., Anzali, B. C., Mehryar, H. R., & Abedi, S. (2025) · BMC Infectious Diseases · doi:10.1186/s12879-025-12138-0 · Cited by 2
Two years of SARS-CoV-2 genomic surveillance capacity development in Guinea
Magassouba, N., Gustani‐Buss, E., Ifono, K., Nelson, E. V., Camara, J., Annibaldis, G., Renevey, A., Hinzmann, J., Hinrichs, M., Ryter, S., et al. (2026) · Scientific Reports · doi:10.1038/s41598-026-46736-y · Cited by 2
Ambasta, A., Kusumesh, R., Rajpal, K., Kumar, S., & Singh, V. (2022) · Cureus · doi:10.7759/cureus.28825 · Cited by 2
Wei, D., Xie, Y.-S., Liu, X.-F., Chen, R., Zhou, M., Zhang, X.-X., & Qu, J.-M. (2023) · Frontiers in Medicine · doi:10.1007/s11684-023-1043-5 · Cited by 2
Mohammed, M. M., & Fawzi, H. A. (2024) · Pharmacia · doi:10.3897/pharmacia.71.e115198 · Cited by 2
Kumar, A., Asghar, A., Raza, K., Narayan, R. K., Jha, R. K., Satyam, A., Kumar, G., Dwivedi, P., Sahni, C., Kumari, C., et al. (2024) · Interactive Journal of Medical Research · doi:10.2196/44492 · Cited by 2
A cluster-based model of COVID-19 transmission dynamics
Shayak, B., & Sharma, M. (2021) · Chaos An Interdisciplinary Journal of Nonlinear Science · doi:10.1063/5.0060578 · Cited by 2
Leneva, I. A., Smirnova, D. I., Павловна, К. Н., Gracheva, A. V., Ivanina, A. V., Андреевна, Г. Е., Korchevaya, E. R., Pankratov, A. A., Trunova, G. V., Андреевна, Х. В., et al. (2022) · Problems of Virology · doi:10.36233/0507-4088-135 · Cited by 2
Gopalan, V., Chandran, A., Arumugam, K., Sundaram, M., Velladurai, S., Govindan, K., Azhagesan, N., Jeyavel, P., Dhandapani, P., Sivasubramanian, S., et al. (2023) · Journal of Global Infectious Diseases · doi:10.4103/jgid.jgid_178_22 · Cited by 2
Martín, V., Ruiz‐García, A., Vitelli‐Storelli, F., Serrano-Cumplido, A., Barquilla-García, A., Micó-Pérez, R. M., Olmo-Quintana, V., Calderón-Montero, A., & Segura‐Fragoso, A. (2023) · Medicina de Familia SEMERGEN · doi:10.1016/j.semerg.2023.102026 · Cited by 2
Immune-Boosting Effect of the COVID-19 Vaccine: Real-World Bidirectional Cohort Study
Liu, M., Zhao, T., Mu, Q., Zhang, R., Liu, C., Xu, F., Liang, L., Zhao, L., Zhao, S., Cai, X., et al. (2023) · JMIR Public Health and Surveillance · doi:10.2196/47272 · Cited by 2
Chen, Z., Azman, A. S., Chen, X., Zou, J., Tian, Y., Sun, R., Xu, X., Wu, Y., Lu, W., Ge, S., et al. (2021) · medRxiv · doi:10.1101/2021.09.06.21263152 · Cited by 2
Ren, P., Peng, L., Fang, Z., Suzuki, K., Renauer, P. A., Lin, Q., Bai, M., Yang, L., Li, T., Clark, P. R., et al. (2022) · bioRxiv (Cold Spring Harbor Laboratory) · doi:10.1101/2022.03.17.484817 · Cited by 2
Narechania, A., Bobo, D., Deitz, K. C., DeSalle, R., Planet, P. J., & Mathema, B. (2022) · medRxiv · doi:10.1101/2022.06.23.22276807 · Cited by 2
Arantes, I., Bello, G., do Nascimento, V. A., de Souza, V. C., da Silva, A., Silva, D., Nascimento, F., Mejía, M., Brandão, M. J., Gonçalves, L. M. F., et al. (2022) · medRxiv · doi:10.1101/2022.09.21.22280193 · Cited by 2
Bhanothu, V., Munne, K., Pande, S. S., Singh, P., Jagtap, D. D., Aranha, C. C., Gogoi, D., Bhagat, S., Gaonkar, R., Kerkar, S. C., et al. (2023) · Archives of Virology · doi:10.1007/s00705-023-05815-5 · Cited by 1
Self-citationOne year of SARS-CoV-2 circulation in the Nouvelle-Aquitaine region, February 2021–2022, France
Deroche, L., Bellecave, P., David, R., Ouattara, E. N., Garcia, M., Roblot, F., Boinot, L., Faucher, J., Rejasse, A., Gschwind, G., et al. (2023) · Frontiers in Microbiology · doi:10.3389/fmicb.2023.1176575 · Cited by 1
Yu, Y., Guo, M., Chen, X., Zhang, Q., Wang, L., Zhang, M., Wang, M., Li, W., & Yu, T. (2025) · Frontiers in Medicine · doi:10.3389/fmed.2025.1674189 · Cited by 1
A Brief Introduction to the Convergence of Artificial Intelligence and Biotechnology
Marcellin, M. C., Pescaroli, G., Schmidt, M., Trump, B. D., Tubbs, T. B., Villegas-Torres, M. F., Lambert, J. H., Haggenmiller, C., Blume, Y. B., Kamrud, A. J., et al. (2026) · NATO science for peace and security series. A, Chemistry and biology · doi:10.1007/978-3-032-05246-9_2 · Cited by 2
Urano, E., Okamura, T., Higuchi, M., Furukawa, M., Ueda, K., Nagata, S., Kamada, H., & Yasutomi, Y. (2026) · Communications Biology · doi:10.1038/s42003-026-09684-x · Cited by 1
Dey, A. A., Mishra, S., Ashireddygari, V. R., Vemparala, B., Chandra, A., Jain, D., Dixit, N. M., Tammineni, P., & Kesavardhana, S. (2026) · Communications Biology · doi:10.1038/s42003-026-10801-z · Cited by 1
Self-citationGenomic Analysis of AZD1222 (ChAdOx1) Vaccine Breakthrough Infections in the City of Mumbai
Shetty, A., Chatterjee, G., Rajpal, S., Srivastava, T., Gardi, N., Mirgh, S. P., Gokarn, A. G., Punatar, S. B., Shetty, N., Joshi, A. D., et al. (2022) · International Journal of Clinical Practice · doi:10.1155/2022/2449068 · Cited by 1
Çaynak, H. B. Y., Çöl, M., & Alıcılar, H. E. (2022) · Journal of Ankara University Faculty of Medicine · doi:10.4274/atfm.galenos.2022.30085 · Cited by 1
Aydın, H., Berikol, G. B., Koçak, M., & Doğan, H. (2022) · Anadolu Kliniği Tıp Bilimleri Dergisi · doi:10.21673/anadoluklin.1061232 · Cited by 1
Pal, S., Mehta, P., Pandey, A., Ara, A., Ghoshal, U., Ghoshal, U. C., Pandey, R., Tripathi, R. K., Yadav, P. N., Ramachandran, R., et al. (2023) · Frontiers in Microbiology · doi:10.3389/fmicb.2023.986729 · Cited by 1
Self-citationSARS-CoV-2 strains bearing Omicron BA.1 spike replicate in C57BL/6 mice
Ogger, P. P., Martín, M. G., Jang, S., Zhou, J., Brown, J. C., Sukhova, K., Furnon, W., Patel, A. H., Cowton, V. M., Palmarini, M., et al. (2024) · Frontiers in Immunology · doi:10.3389/fimmu.2024.1383612 · Cited by 1
Pandey, R. R., Agarwal, M., Wahl, B., Garg, T., & Jain, A. (2024) · Cureus · doi:10.7759/cureus.59521 · Cited by 1
Self-citationAlvarenga, N. L., Olmedo, D. A., González-Maldonado, P., Soto‐Rifo, R., Valiente‐Echeverría, F., Langjahr, P., & Sotelo, P. H. (2024) · South African Journal of Botany · doi:10.1016/j.sajb.2024.04.041 · Cited by 1
Emergence of COVID-19 variants among ChAdOx1 nCoV-19 (recombinant) vaccine recipients
Vaishya, R., Sibal, A., Singh, S., Malani, A., & Das, S. S. (2021) · The Indian Journal of Medical Research · doi:10.4103/ijmr.ijmr_2061_21 · Cited by 1
Self-citationElliott, P., Haw, D., Wang, H., Eales, O. D., Walters, C. E., Ainslie, K. E. C., Atchison, C. J., Fronterrè, C., Diggle, P. J., Page, A. J., et al. (2021) · Cited by 1
Sarkar, P., Banerjee, S., Chakrabarti, S., Chakrabarti, P., Bandyopadhyay, A., Mitra, A. G., Saha, S., Roy, A., & Sarkar, S. (2022) · Indian Journal of Medical Microbiology · doi:10.1016/j.ijmmb.2022.10.006 · Cited by 1
Characteristics of post-Wuhan COVID-19 outbreaks in mainland China
Li, Y., Guo, C., Wu, Q., & Guo, Z.-M. (2022) · One Health Bulletin · doi:10.4103/2773-0344.346831 · Cited by 1
The Origins of the Second Wave of COVID-19 in India - a Model-based investigationPreprint
Shayak, B., & Sharma, M. (2021) · doi:10.31235/osf.io/ce9kx · Cited by 1
Transmission of B.1.617.2 Delta Variant Between Vaccinated Healthcare WorkersPreprint
Kemp, S. A., Cheng, M. T. K., Hamilton, W., Kamelian, K., Singh, S. K., Rakshit, P., Aggrawal, A., Illing, C. J. R., & Gupta, R. K. (2022) · Research Square · doi:10.21203/rs.3.rs-1166169/v1 · Cited by 1
Self-citationBroadly neutralizing and protective nanobodies against diverse sarbecovirusesPreprint
Li, M., Ren, Y., Aw, Z. Q., Chen, B., Yang, Z., Lei, Y., Cheng, L., Liang, Q., Hong, J., Yang, Y., et al. (2022) · bioRxiv (Cold Spring Harbor Laboratory) · doi:10.1101/2022.04.12.488087 · Cited by 1
Harsha, P. K., Pattabiraman, C., George, A. K., Madhusudhan, J., Mardikar, S., Nazaar, M., Adimoolam, S., Divya Priya, A., Pitale, J., Nagarajan, M., et al. (2022) · medRxiv · doi:10.1101/2022.07.07.22276915 · Cited by 1
Bokolia, N. P., & Gadepalli, R. (2022) · bioRxiv (Cold Spring Harbor Laboratory) · doi:10.1101/2022.12.10.518819 · Cited by 1
Pathways to altered virulence of SARS-CoV-2Preprint
White, L. F., Egeren, D. V., Stoddard, M., D'Angelo, N., Bayly, H., Sagar, M., & Chakravarty, A. (2023) · OSF Preprints (OSF Preprints) · doi:10.31219/osf.io/k4hb3 · Cited by 1
COVID vaccination provided protection from severe disease despite low Cycle threshold (Ct) values
Vaishya, R., Malani, A., Sharma, H., Vaish, A., & Singh, S. K. (2021) · Diabetes & Metabolic Syndrome Clinical Research & Reviews · doi:10.1016/j.dsx.2021.102281
Self-citationVitiello, G. A. F., de Oliveira, I. M., Ivanski, F., Fermino, B. L., Gustani‐Buss, E., Bezerra, R. D. S., Buss, C. E., Ximenez, J. P. B., Paz, B. M., Gabriel, K. D. O. F., et al. (2021) · Research Square · doi:10.21203/rs.3.rs-1072564/v1
Singh, P., Ujjainiya, R., Prakash, S., Naushin, S., Sardana, V., Bhatheja, N., Singh, A. P., Barman, J., Kumar, K., Khan, R., et al. (2021) · medRxiv · doi:10.1101/2021.12.16.21267889
Self-citationLakshmi, V. R., & Reddy, K. A. (2021) · GLOBAL JOURNAL FOR RESEARCH ANALYSIS · doi:10.36106/gjra/7300373
SARS-CoV-2 Variants and Vaccines: Pledge to global response!
Roy, S., Uddin, B. M. M., & Ahmed, I. (2021) · Bangladesh Journal of Medical Microbiology · doi:10.3329/bjmm.v15i2.57818
Ambasta, A. (2022) · Research Square · doi:10.21203/rs.3.rs-1319142/v1
Petersen, J. D., Lu, J., Fitzgerald, W., Zhou, F., Blank, P. S., Matthies, D., & Zimmerberg, J. J. (2022) · bioRxiv (Cold Spring Harbor Laboratory) · doi:10.1101/2022.04.07.487415
Proporción de la población con vacunación completa contra Covid-19 a nivel mundial
Pinzón, J. E. D. (2022) · Revista Repertorio de Medicina y Cirugía · doi:10.31260/repertmedcir.01217372.1329
Antibody responses to AZD1222 vaccination in West AfricaPreprint
Abdullahi, A., Oladele, D. A., Kemp, S. A., James, A. B., Salako, A. O., Ige, F. A., Fink, D., Onwuamah, C. K., Osuolale, Q., Abubakar, R., et al. (2022) · medRxiv · doi:10.1101/2022.05.04.22274668
Self-citationChen, X., Zhu, Y., Gao, Y. M., Li, Q., Wang, X., Zhao, D., Zhou, J., Ren, C.-P., Han, M., Li, H., et al. (2022) · SSRN Electronic Journal · doi:10.2139/ssrn.4095175
Niveditha, D., Khan, S., Khilari, A. A., Nadkarni, S., Bhalerao, U., Kadam, P., Yadav, R., Kanekar, J., Shah, N., Likhitkar, B., et al. (2022) · medRxiv · doi:10.1101/2022.11.05.22281203
COVID-19: Epidemiology, Virology, Transmission, and Prevention
İrkören, P., & Tekin, S. (2022) · Cam and Sakura Medical Journal · doi:10.4274/csmedj.galenos.2022.2022-11-1
Underlying driving forces of the SARS-CoV-2 evolution: immune evasion and ACE2 binding affinityPreprint
Ma, W., Fu, H., Jian, F., Cao, Y., & Li, M. (2023) · bioRxiv (Cold Spring Harbor Laboratory) · doi:10.1101/2023.02.06.527236
Briggs, K., Sweeney, R., Blehert, D. S., Spackman, E., Suarez, D. L., & Kapczynski, D. R. (2023) · bioRxiv (Cold Spring Harbor Laboratory) · doi:10.1101/2023.04.19.537521
Rao, V. N., Banerjee, U., Sambaturu, N., Chunchanur, S. K., Ambica, R., & Chandra, N. R. (2023) · HLA · doi:10.1111/tan.15071
孙, 丽. (2023) · Advances in Clinical Medicine · doi:10.12677/acm.2023.1351194
Niveditha, D., Khan, S., Khilari, A. A., Nadkarni, S., Bhalerao, U., Kadam, P., Yadav, R., Kanekar, J. B., Shah, N., Likhitkar, B., et al. (2023) · Journal of Infection and Public Health · doi:10.1016/j.jiph.2023.06.004 · Cited by 1
Dolma, K., John, S., & Gulati, R. (2023) · Journal of Global Health Reports · doi:10.29392/001c.77985
Health informatics and data science for pandemic preparedness
Agrawal, A. (2023) · Elsevier eBooks · doi:10.1016/b978-0-443-18769-8.00006-4
Self-citationAliakbarpour, H., Shahmansoury, A., & Bazaee, G. (2022) · Journal of Health and Biomedical Informatics · doi:10.34172/jhbmi.2022.02
Análise genômica de SARS-CoV-2 na cidade de São Caetano do Sul, São Paulo, Brasil
Sales, F. C. D. S. (2023) · Digital Library of Theses and Dissertations (Universidade de São Paulo) · doi:10.11606/t.5.2023.tde-02082023-153216
Caracterización genómica del SARS-CoV-2, Norte de Santander-Colombia, 2020-2021
Vargas, H., & Zambrano, C. (2023) · Revista Enfermería Historia e Investigación · doi:10.53766/ehi/2023.09.02.02
Sinaei, R., Jafari, M., Karamozian, R., Pezeshki, S., Sinaei, R., Robati, F. K., Yeganeh, M. H., & Najafzadeh, M. J. (2023) · Current Respiratory Medicine Reviews · doi:10.2174/1573398x19666230911094423
Kambarami, M. S., Ngorima, G., Moyo, P., Mabaya, L., Mushiri, T., & Manasa, J. (2023) · doi:10.1099/acmi.0.000720.v1
Viver, T., López-Causapé, C., Fraile-Ribot, P. A., Pérez-Mazón, C., López-Solé, D., Jiménez-Guerra, G., Taltavull, B., & López-López, A. (2023) · Scientific Reports · doi:10.1038/s41598-023-44668-5
Keller, M. W., Keong, L. M., Rambo‐Martin, B. L., Hassell, N., Lacek, K. A., Wilson, M. M., Kirby, M. K., Liddell, J., Owuor, D. C., Sheth, M., et al. (2023) · Microbiology Spectrum · doi:10.1128/spectrum.02982-23
Distinct SARS-CoV-2 populational immune backgrounds induce divergent RBD evolutionary preferencesPreprint
Ma, W., Fu, H., Jian, F., Cao, Y., & Li, M. (2023) · bioRxiv (Cold Spring Harbor Laboratory) · doi:10.1101/2023.12.19.572469
Acharya, D., & Dutta, T. K. (2024) · bioRxiv (Cold Spring Harbor Laboratory) · doi:10.1101/2024.01.12.575398
Teixeira, D. G., Rodrigues-Neto, J. F., da Cunha, D. C. S., & Jerônimo, S. M. B. (2024) · Infection Genetics and Evolution · doi:10.1016/j.meegid.2024.105556
Çağlar Boyunca Salgınlar: Bulaşıcı Hastalıkların Tarihsel Bir Yolculuğu
İlgar, E., & Taş, S. K. (2024) · Mersin Üniversitesi Tıp Fakültesi Lokman Hekim Tıp Tarihi ve Folklorik Tıp Dergisi · doi:10.31020/mutftd.1398724 · Cited by 1
Data-Driven Methods for Viral Variants’ Identification
Bernasconi, A. (2024) · Elsevier eBooks · doi:10.1016/b978-0-323-95502-7.00087-7
Modeling the Effect of Disease Characteristics on the Outcomes of Interventions
Lisitza, C. (2024) · Springer eBooks · doi:10.1007/978-3-031-59072-6_15
Sironi, M., & Gónzález‐Candelas, F. (2024) · Elsevier eBooks · doi:10.1016/b978-0-443-28818-0.00012-4
Integrated viral and immune monitoring in a prospective COVID-19 cohort from India
Agrawal, S. R., Kasarpalkar, N., Ghosh, S., Paradkar, G., Daund, V., Bhowmick, S., Chitalia, V., Rao, P. S., Sankpal, A., Kalsurkar, V., et al. (2024) · Journal of Leukocyte Biology · doi:10.1093/jleuko/qiae187
Potdar, V. A., Laxmivandana, R., Walimbe, A. M., Jadhav, S. K., Pawar, P., Kaledhonkar, A. A., Gupta, N., Kaur, H., Narayan, J., Yadav, P. D., et al. (2024) · The Indian Journal of Medical Research · doi:10.25259/ijmr_252_23
Stability and Hopf bifurcation of TB-COVID-19 coinfection model with impact of time delay
Verma, V. S., Kaushik, H., Singh, R. S., Jain, S., & Akgül, A. (2024) · SeMA Journal · doi:10.1007/s40324-024-00366-4
Sengupta, S. (2024) · medRxiv · doi:10.1101/2024.10.17.24315252
Self-citationHow Did Latin America Face the SARS-CoV-2 Variants?
Jaspe, R. C., Zambrano, J. L., Loureiro, C. L., Rangel, H. R., & Pujol, F. H. (2024) · The Latin American studies book series · doi:10.1007/978-3-031-68419-7_7
Challenges in COVID-19 Pandemic Triaging: An Indian and US Perspective
Varma, M. D., Sudandiradas, R., Patel, M. M., Mathew, T. A., Zervos, M. J., Umakanth, S., Kamath, A., Rao, M., Eshwara, V. K., Mukhopadhyay, C., et al. (2025) · Emergency Care and Medicine · doi:10.3390/ecm2020018
Guilbaud, R., Maiga, A. I., Ouédraogo, A., Sawadogo, Y., Niama, F. R., Mahamat, O. O., Toni, T. D., Kabo, A. K., Mayengué, P. I., Koukouikila-Koussounda, F., et al. (2026) · Journal of Infection and Public Health · doi:10.1016/j.jiph.2026.103334
A conserved region T-cell vaccine for SarbecovirusesPreprint
Escarra‐Senmarti, M., Brockhurst, J., Maxwell, A. R., Godwin, T., Zhang, T., Chen, Y., Um, P. K., Danilova, L., Hsu, W.-C., Lin, C. T., et al. (2025) · bioRxiv (Cold Spring Harbor Laboratory) · doi:10.1101/2025.05.20.654373
Understanding the Virus: The Evolving Mutations
Das, S., Vrati, S., Maitra, A., Biswas, N. K., Banerjee, A., Mazumder, A., & Dutta, S. (2025) · Springer eBooks · doi:10.1007/978-981-96-8122-8_3
A successful response to the second wave of COVID-19 in the slums of Delhi
Peteet, J. R., Martin, K., & Peteet, J. O. (2025) · Journal of Global Health · doi:10.7189/jogh.15.03032 · Cited by 1
A simple stochastic theory of extinction shows rapid elimination of a Sars-like pandemic
Khatri, B. S. (2025) · Europhysics Letters (EPL) · doi:10.1209/0295-5075/ae0c31 · Cited by 3
The evolutionary battle: data-driven analysis of SARS-CoV-2 virulence
Yin, K., Wang, Y., & Meng, X. (2025) · Computer Methods in Biomechanics & Biomedical Engineering · doi:10.1080/10255842.2025.2582765
Liu, S., Anzai, A., & Nishiura, H. (2024) · Figshare · doi:10.6084/m9.figshare.24934201
Karade, S. K., Bhatt, P., Yadav, P., Hasan, K., Kumar, R., Bahal, A., & Kumar, A. (2026) · Medical Journal Armed Forces India · doi:10.1016/j.mjafi.2025.12.012
A generalized lineage nomenclature for viral genomic epidemiology
Colquhoun, R., Hinrichs, A. S., Hill, V., Ruis, C., Roemer, C., Pybus, O. G., Rambaut, A., & O’Toole, Á. (2026) · Nature Microbiology · doi:10.1038/s41564-026-02468-3 · Cited by 1
Metadata
- Authors
- Dhar, M. S., Marwal, R., Radhakrishnan, V., Ponnusamy, K., Jolly, B., Bhoyar, R. C., Sardana, V., Naushin, S., Rophina, M., Mellan, T. A., Mishra, S., Whittaker, C., Fatihi, S., Datta, M., Singh, P., Sharma, U., Ujjainiya, R., Batheja, N., Divakar, M. K., Singh, M. K., Imran, M., Senthivel, V., Maurya, R., Jha, N., Mehta, P., Vivekanand, A., Sharma, P., Arvinden, V., Chaudhary, U., Soni, N., Thukral, L., Flaxman, S., Bhatt, S., Pandey, R., Dash, D., Faruq, M., Lall, H., Gogia, H., Madan, P., Kulkarni, S., Chauhan, H., Sengupta, S., Kabra, S., The Indian SARS-CoV-2 Genomics Consortium (INSACOG), Gupta, R. K., Singh, S. K., Agrawal, A., & Rakshit, P.
- Affiliations
- National Center for Disease Control (IN)
- Institute of Genomics and Integrative Biology (IN)
- Imperial College London (GB)
- University of Copenhagen (DK)
- University of Cambridge (GB)
- Corresponding author
- Dhar, Mahesh S
- Marwal, Robin
- Radhakrishnan, VS
- Ponnusamy, Kalaiarasan
- Jolly, Bani
- Bhoyar, Rahul C.
- Agrawal, Anurag
- Rakshit, Partha
- ORCID
- Dhar, Mahesh S
- Marwal, Robin
- Radhakrishnan, VS
- Ponnusamy, Kalaiarasan
- Jolly, Bani
- Bhoyar, Rahul C.
- Sardana, Viren
- Naushin, Salwa
- Rophina, Mercy
- Mellan, Thomas A
- Mishra, Swapnil
- Whittaker, Charles
- Fatihi, Saman
- Singh, Priyanka
- Sharma, Uma
- Ujjainiya, Rajat
- Divakar, Mohit Kumar
- Singh, Manoj K
- Imran, Mohamed
- Senthivel, Vigneshwar
- Maurya, Ranjeet
- Jha, Neha
- Mehta, Priyanka
- Vivekanand, A
- Sharma, Pooja
- Arvinden, VR
- Chaudhary, Urmila
- Thukral, Lipi
- Flaxman, Seth
- Bhatt, Samir
- Pandey, Rajesh
- Dash, Debasis
- Faruq, Mohammed
- Lall, Hemlata
- Madan, Preeti
- Kulkarni, Sanket
- Chauhan, Himanshu
- Sengupta, Shantanu
- Gupta, Ravindra K.
- Singh, Sujeet K
- Agrawal, Anurag
- Rakshit, Partha
- Venue
- Science
- Publisher
- openRxiv
- Published
- 2021-06-03
- Volume
- 374
- Issue
- 6570
- Pages
- 995-999
- ISSN
- 0036-8075 (ISSN-L)
- PMC
- PMC7612010
- OpenAlex
- W3205588626
- Cited by
- 296
- References
- 43
- Citations by year
- 2026: 7 · 2025: 19 · 2024: 38 · 2023: 65 · 2022: 115 · 2021: 51
- FWCI
- 21.30
- Type
- journal article
- Language
- en
- Open access
- hybrid
- doi.org
- Licence
- cc-by
- Locations
- Science (publishedVersion, cc-by)
- medRxiv (acceptedVersion, cc-by)
- PubMed Central (publishedVersion, cc-by)
- PubMed (publishedVersion)
- Research at the University of Copenhagen (University of Copenhagen) (publishedVersion, cc-by)
- Greater South Information System
- Funders
- Wellcome Trust (108082/A/15/Z, 108082)
- Novo Nordisk Fonden (NNF20OC0059309)
- Medical Research Council (MR/R015600/1, MC_PC_19012)
- Engineering and Physical Sciences Research Council (EP/V002910/1, EP/V002910/2)
- Topics
- Health Sciences › Medicine › Infectious Diseases › SARS-CoV-2 and COVID-19 Research
- Physical Sciences › Mathematics › Modeling and Simulation › COVID-19 epidemiological studies
- Health Sciences › Medicine › Infectious Diseases › COVID-19 Clinical Research Studies
- Keywords
- SARS-CoV-2, Delta variant, B.1.1.7 Alpha variant, COVID-19 outbreak, Delhi, genomic profiling, epidemiology, transmissibility, immune evasion, reinfection, seroprevalence, antibody response, Bayesian model
- MeSH terms
- Reinfection, COVID-19, Adolescent, Adult, Child, Humans, India, Phylogeny, Seroepidemiologic Studies, Genome, Viral, Molecular Epidemiology, Young Adult, Immune Evasion
About these checks
Registry, retraction, Cites and statistics results are computed, not judged, with one exception: a printed reference that no index lists is read once by a model before it counts as a citation error. Claims are extracted by a model and kept only when their quote appears verbatim in the text; each cited source is then checked, with a model’s help, for whether it says what the claim relies on. Those verdicts can be wrong — read the claim’s quote and the cited source before relying on one.
Statistics and arithmetic are recomputed, not judged.
Confidence bands are shown only for fields calibrated on our annotated test set. None is calibrated yet, so no band is shown.
What counts as a claim ›How we measure confidence ›How we check this ›
Are you an author, or do you see a problem with this page? Request a review
