

The DOI matches its Crossref record; 25 of the 25 references it cites were found in a registry or an index; none of the 21 sources its claims cite is checked for support yet.
Increased risk of SARS-CoV-2 reinfection associated with emergence of Omicron in South Africa
Open accessAbstract
Summary: Introduction: Globally, there have been more than 404 million cases of SARS-CoV-2, with 5.8 million confirmed deaths, as of February 2022. South Africa has experienced four waves of SARS-CoV-2 transmission, with the second, third, and fourth waves being driven by the Beta, Delta, and Omicron variants, respectively. A key question with the emergence of new variants is the extent to which they are able to reinfect those who have had a prior natural infection. Rationale: We developed two approaches to monitor routine epidemiological surveillance data to examine whether SARS-CoV-2 reinfection risk has changed through time in South Africa, in the context of the emergence of the Beta (B.1.351), Delta (B.1.617.2), and Omicron (B.1.1.529) variants. We analyze line list data on positive tests for SARS-CoV-2 with specimen receipt dates between 04 March 2020 and 31 January 2022, collected through South Africa’s National Notifiable Medical Conditions Surveillance System. Individuals having sequential positive tests at least 90 days apart were considered to have suspected reinfections. Our routine monitoring of reinfection risk included comparison of reinfection rates to the expectation under a null model (approach 1) and estimation of the time-varying hazards of infection and reinfection throughout the epidemic (approach 2) based on model-based reconstruction of the susceptible populations eligible for primary and second infections. Results: 105,323 suspected reinfections were identified among 2,942,248 individuals with laboratory-confirmed SARS-CoV-2 who had a positive test result at least 90 days prior to 31 January 2022. The number of reinfections observed through the end of the third wave in September 2021 was consistent with the null model of no change in reinfection risk (approach 1). Although increases in the hazard of primary infection were observed following the introduction of both the Beta and Delta variants, no corresponding increase was observed in the reinfection hazard (approach 2). Contrary to expectation, the estimated hazard ratio for reinfection versus primary infection was lower during waves driven by the Beta and Delta variants than for the first wave (relative hazard ratio for wave 2 versus wave 1: 0.71 (CI 95 : 0.60–0.85); for wave 3 versus wave 1: 0.54 (CI 95 : 0.45–0.64)). In contrast, the recent spread of the Omicron variant has been associated with an increase in reinfection hazard coefficient. The estimated hazard ratio for reinfection versus primary infection versus wave 1 was 1.75 (CI 95 : 1.48–2.10) for the period of Omicron emergence (01 November 2021 to 30 November 2021) and 1.70 (CI 95 : 1.44–2.04) for wave 4 versus wave 1. Individuals with identified reinfections since 01 November 2021 had experienced primary infections in all three prior waves, and an increase in third infections has been detected since mid-November 2021. Many individuals experiencing third infections had second infections during the third (Delta) wave that ended in September 2021, strongly suggesting that these infections resulted from immune evasion rather than waning immunity. Conclusion: Population-level evidence suggests that the Omicron variant is associated with substantial ability to evade immunity from prior infection. In contrast, there is no population-wide epidemiological evidence of immune escape associated with the Beta or Delta variants. This finding has important implications for public health planning, particularly in countries like South Africa with high rates of immunity from prior infection. Further development of methods to track reinfection risk during pathogen emergence, including refinements to assess the impact of waning immunity, account for vaccine-derived protection, and monitor the risk of multiple reinfections will be an important tool for future pandemic preparedness.
Overview
AI snapshot
Written from the paper’s full text.
TL;DR
Using national SARS-CoV-2 surveillance data from South Africa, the authors found no population-level evidence of increased reinfection risk associated with Beta or Delta, but clear evidence of immune evasion by Omicron in previously infected individuals. The increase in reinfections began in November 2021 and was temporally consistent with Omicron’s emergence.
Key findings
- No evidence of increased reinfection risk was associated with circulation of Beta (B.1.351) or Delta (B.1.617.2); in contrast, reinfections rose sharply with Omicron (B.1.1.529), with observed reinfections exceeding the 95% projection interval from the null model from early November 2021.
- Among 105,323 individuals with at least two suspected infections, 1,778 had at least three suspected infections and 18 had four; 1,492 of those with multiple reinfections (83.9%) experienced their third infection after 31 October 2021.
- During the fourth wave, the 7-day moving average of suspected second infections reached nearly 2,700, and all suspected reinfections reached approximately 2,750.
- The mean ratio of reinfection hazard to primary infection hazard increased to 0.25 for 01 November 2021 to the beginning of the fourth wave and 0.27 during the fourth wave; in a generalized linear mixed model, the relative hazard ratio was 1.75 (CI95: 1.48–2.10) for Omicron emergence versus wave 1 and 1.70 (CI95: 1.44–2.04) for wave 4 versus wave 1.
Methods
- The study used routinely collected National Institute for Communicable Diseases (NICD) line list data with specimen receipt dates from 04 March 2020 to 31 January 2022; a suspected reinfection was a positive SARS-CoV-2 test at least 90 days after the most recent positive test.
- Two approaches were used: a catalytic null model assuming a constant reinfection hazard proportional to the 7-day moving average of detected infections, fitted through 28 February 2021 and projected forward; and a time-varying hazard reconstruction of susceptible groups, plus a Poisson generalized linear mixed model with log link to estimate relative hazard by wave.
- Analyses were conducted in R version 4.0.5, with descriptive analysis of time between successive positive tests and of individuals with multiple suspected reinfections.
Limitations
- The paper states that changes in testing practices, health-seeking behavior, or access to care were not accounted for; rapid antigen tests may be under-reported; civil unrest in July 2021 disrupted testing in Gauteng and KwaZulu-Natal and violated the model assumption that force of infection is proportional to positive tests; reinfections were not confirmed by sequencing or a negative test between episodes; vaccination status was unknown and coverage was low (22.5% fully vaccinated by 30 November 2021); and estimates of the extent of immune evasion should be treated with caution.
- The paper also states that it aimed to detect changing trends rather than precisely estimate reinfection risk, and that undetected primary infections, undetected reinfections, and deaths not linked to test data could inflate the estimated denominator at risk and reduce apparent reinfection risk.
- Evident from the text: the temporal-trend analyses considered only suspected second infections, while third and fourth infections were described descriptively; observation probabilities were assumed (for example, pobs = 0.1 and pobs2 = 0.5), and the authors note that absolute hazard values are sensitive to these assumptions.
Model-written summary. Check it against the paper before relying on it.
Integrity signals
Registry
Cites
Statistics
Figures
Verification
Claims the paper makes
25 Own result · 16 Own method · 14 Not checked yet · 11 Own interpretation · 2 No basis given
A result the paper reports from its own data — it cites no other source for it, so there is none to check. The quote shows it is in the paper.
In the paper
“A similar pattern has now been seen across all provinces (figs. S5 to S7).”
§ Increased risk of SARS-CoV-2 reinfection associated with emergence of Omicron in South Africa > Comparison of data to projections from a null model
plain- Asserted: passes — The authors put it forward as true.
- Checkable: passes — It can be checked against evidence.
- Load-bearing: unclear — It is unclear whether the paper’s conclusions depend on it.
- Based: passes — The paper gives a reason why it holds.
- The authors state this as an assumption: The reinfection hazard coefficient is constant through time in the null model.
- The authors state this as an assumption: The reinfection hazard is proportional to the 7-day moving average of the total number of diagnosed infections (primary infections and reinfections).
A result the paper reports from its own data — it cites no other source for it, so there is none to check. The quote shows it is in the paper.
In the paper
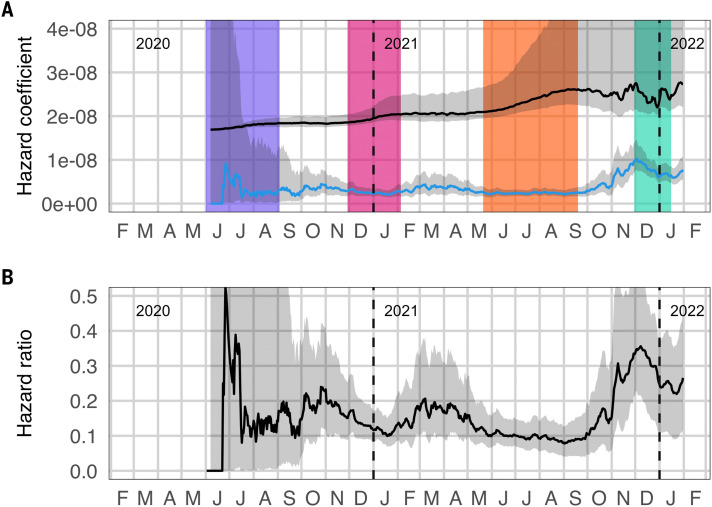
“The estimated mean ratio of reinfection hazard to primary infection hazard decreased slightly from 0.15 in wave 1 to 0.12 in wave 2 and 0.09 in wave 3.”
§ Increased risk of SARS-CoV-2 reinfection associated with emergence of Omicron in South Africa > Estimation of time-varying infection and reinfection hazards
hedgedcorrelational- Asserted: passes — The authors put it forward as true.
- Checkable: passes — It can be checked against evidence.
- Load-bearing: unclear — It is unclear whether the paper’s conclusions depend on it.
- Based: passes — The paper gives a reason why it holds.
- The authors state this as an assumption: Observation probabilities for primary infections and reinfections are assumed for the hazard estimates.
A result the paper reports from its own data — it cites no other source for it, so there is none to check. The quote shows it is in the paper.
In the paper
“The estimated hazard coefficient for reinfection, in contrast, remained relatively constant throughout this period, with the exception of an initial spike in mid-2020 (Fig. 5).”
§ Increased risk of SARS-CoV-2 reinfection associated with emergence of Omicron in South Africa > Estimation of time-varying infection and reinfection hazards
hedged- Asserted: passes — The authors put it forward as true.
- Checkable: passes — It can be checked against evidence.
- Load-bearing: unclear — It is unclear whether the paper’s conclusions depend on it.
- Based: passes — The paper gives a reason why it holds.
- The authors state this as an assumption: Observation probabilities for primary infections and reinfections are assumed for the hazard estimates.
A result the paper reports from its own data — it cites no other source for it, so there is none to check. The quote shows it is in the paper.
In the paper
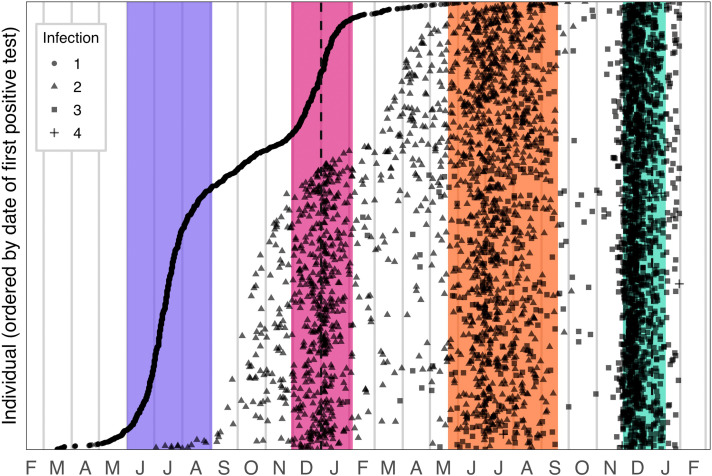
“Almost all suspected third infections occurred after 31 October 2021, i.e., during the period of Omicron circulation.”
§ Increased risk of SARS-CoV-2 reinfection associated with emergence of Omicron in South Africa > Time between successive positive tests
plain- Asserted: passes — The authors put it forward as true.
- Checkable: passes — It can be checked against evidence.
- Load-bearing: passes — The paper’s conclusions depend on it.
- Based: passes — The paper gives a reason why it holds.
The paper states this without a source or data behind it here, so there is nothing to check it against. The quote shows it is in the paper.
In the paper
“the estimated hazard coefficient for primary infection increased steadily through the end of the third wave”
§ Increased risk of SARS-CoV-2 reinfection associated with emergence of Omicron in South Africa > Estimation of time-varying infection and reinfection hazards
hedgeddirect- Asserted: passes — The authors put it forward as true.
- Checkable: passes — It can be checked against evidence.
- Load-bearing: unclear — It is unclear whether the paper’s conclusions depend on it.
- Based: passes — The paper gives a reason why it holds.
- The authors state this as an assumption: Observation probabilities for primary infections and reinfections are assumed for the hazard estimates.
A result the paper reports from its own data — it cites no other source for it, so there is none to check. The quote shows it is in the paper.
In the paper
“Reinfections occurring between 01 November 2021 and 31 January 2022 were detected in individuals infected in all three previous waves”
§ Increased risk of SARS-CoV-2 reinfection associated with emergence of Omicron in South Africa > Abstract
plain- Asserted: passes — The authors put it forward as true.
- Checkable: passes — It can be checked against evidence.
- Load-bearing: unclear — It is unclear whether the paper’s conclusions depend on it.
- Based: passes — The paper gives a reason why it holds.
A result the paper reports from its own data — it cites no other source for it, so there is none to check. The quote shows it is in the paper.
In the paper
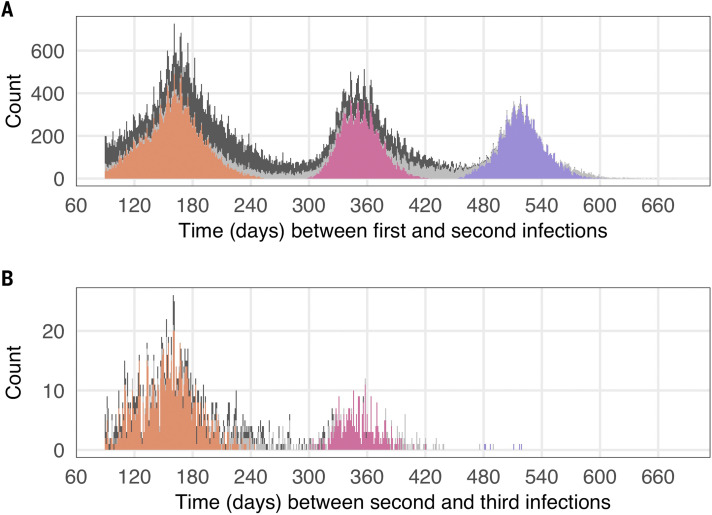
“The distribution of times between successive positive tests for individuals’ first and second infections has peaks near 170, 350, and 520 days (Fig. 2A).”
§ Increased risk of SARS-CoV-2 reinfection associated with emergence of Omicron in South Africa > Time between successive positive tests
plain- Asserted: passes — The authors put it forward as true.
- Checkable: passes — It can be checked against evidence.
- Load-bearing: unclear — It is unclear whether the paper’s conclusions depend on it.
- Based: passes — The paper gives a reason why it holds.
A result the paper reports from its own data — it cites no other source for it, so there is none to check. The quote shows it is in the paper.
In the paper
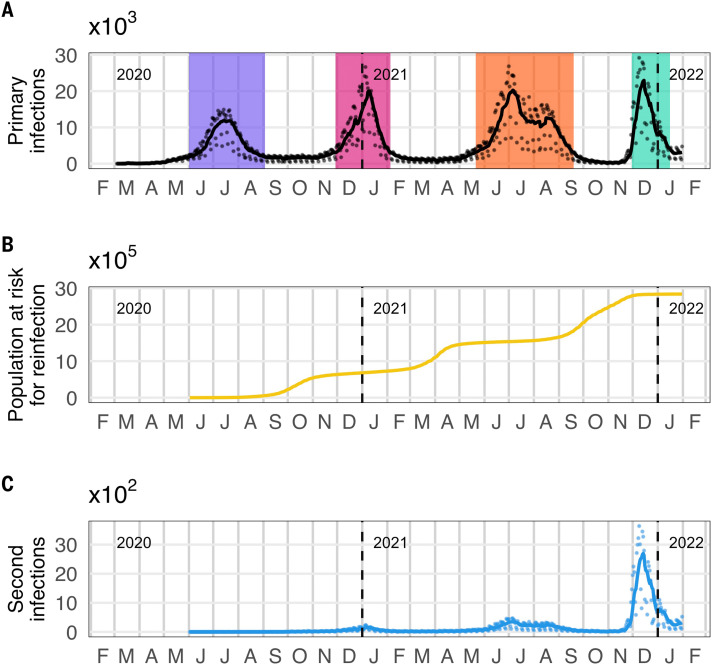
“Following the third wave, the number of reinfections began to increase dramatically in mid-November 2021.”
§ Increased risk of SARS-CoV-2 reinfection associated with emergence of Omicron in South Africa > Population-level reinfection trends in South Africa
plain- Asserted: passes — The authors put it forward as true.
- Checkable: passes — It can be checked against evidence.
- Load-bearing: passes — The paper’s conclusions depend on it.
- Based: passes — The paper gives a reason why it holds.
A result the paper reports from its own data — it cites no other source for it, so there is none to check. The quote shows it is in the paper.
In the paper
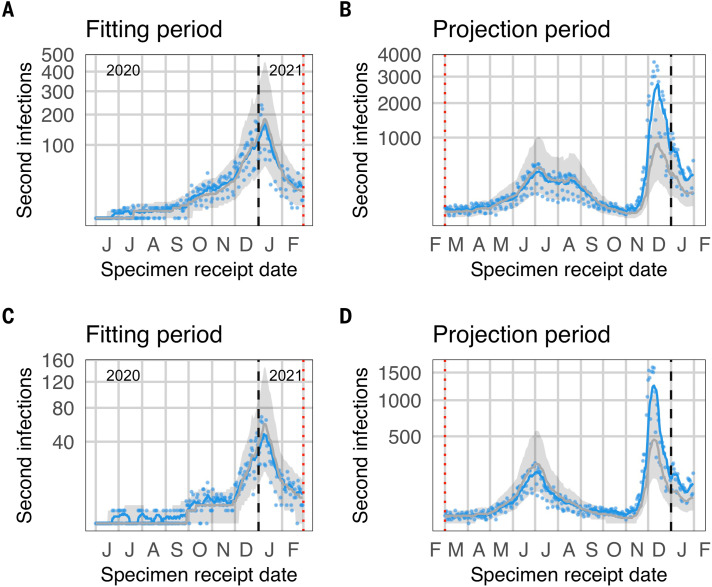
“The 7-day moving average of observed reinfections and most individual daily values fall within the projection interval from the beginning of the projection period though the end of the third wave (Fig. 4).”
§ Increased risk of SARS-CoV-2 reinfection associated with emergence of Omicron in South Africa > Comparison of data to projections from a null model
plain- Asserted: passes — The authors put it forward as true.
- Checkable: passes — It can be checked against evidence.
- Load-bearing: passes — The paper’s conclusions depend on it.
- Based: passes — The paper gives a reason why it holds.
- The authors state this as an assumption: The reinfection hazard coefficient is constant through time in the null model.
- The authors state this as an assumption: The reinfection hazard is proportional to the 7-day moving average of the total number of diagnosed infections (primary infections and reinfections).
A result the paper reports from its own data — it cites no other source for it, so there is none to check. The quote shows it is in the paper.
In the paper
“While we found no evidence of increased reinfection risk associated with circulation of Beta (B.1.351) or Delta (B.1.617.2) variants”
- Also stated in: § Discussion and limitations · hedged
“Thus, our analyses show no population-level evidence of immune escape associated with emergence of the Beta or Delta variants.”
- Also stated in: § Conclusion · plain
“In contrast, we find no evidence that reinfection risk increased as a result of the emergence of Beta or Delta variants”
§ Increased risk of SARS-CoV-2 reinfection associated with emergence of Omicron in South Africa > Abstract
plain- Asserted: passes — The authors put it forward as true.
- Checkable: passes — It can be checked against evidence.
- Load-bearing: passes — The paper’s conclusions depend on it.
- Based: passes — The paper gives a reason why it holds.
- Also stated in: § Discussion and limitations · hedged
A result the paper reports from its own data — it cites no other source for it, so there is none to check. The quote shows it is in the paper.
In the paper
“1,492 individuals with multiple reinfections (83.9%) experienced their third infection after 31 October 2021”
§ Increased risk of SARS-CoV-2 reinfection associated with emergence of Omicron in South Africa > Individuals with multiple suspected reinfections
plainn = 1,778- Asserted: passes — The authors put it forward as true.
- Checkable: passes — It can be checked against evidence.
- Load-bearing: passes — The paper’s conclusions depend on it.
- Based: passes — The paper gives a reason why it holds.
A result the paper reports from its own data — it cites no other source for it, so there is none to check. The quote shows it is in the paper.
In the paper
“there has been an increase in the risk of having a third infection since mid-November 2021.”
§ Increased risk of SARS-CoV-2 reinfection associated with emergence of Omicron in South Africa > Abstract
plaincorrelational- Asserted: passes — The authors put it forward as true.
- Checkable: passes — It can be checked against evidence.
- Load-bearing: passes — The paper’s conclusions depend on it.
- Based: passes — The paper gives a reason why it holds.
The paper states this without a source or data behind it here, so there is nothing to check it against. The quote shows it is in the paper.
In the paper
“our findings suggest that the relative hazard of reinfection versus primary infection decreased with each subsequent wave of infections through September 2021”
§ Increased risk of SARS-CoV-2 reinfection associated with emergence of Omicron in South Africa > Discussion and limitations
hedgedcorrelational- Asserted: passes — The authors put it forward as true.
- Checkable: passes — It can be checked against evidence.
- Load-bearing: passes — The paper’s conclusions depend on it.
- Based: passes — The paper gives a reason why it holds.
- The authors state this as an assumption: Observation probabilities for primary infections and reinfections are assumed for the hazard estimates.
A result the paper reports from its own data — it cites no other source for it, so there is none to check. The quote shows it is in the paper.
In the paper
“Our analyses suggest that the cumulative number of reinfections observed through the end of wave 3 was consistent with the null model of no change in reinfection risk through time.”
§ Increased risk of SARS-CoV-2 reinfection associated with emergence of Omicron in South Africa > Discussion and limitations
hedged- Asserted: passes — The authors put it forward as true.
- Checkable: passes — It can be checked against evidence.
- Load-bearing: passes — The paper’s conclusions depend on it.
- Based: passes — The paper gives a reason why it holds.
- The authors state this as an assumption: The reinfection hazard coefficient is constant through time in the null model.
- The authors state this as an assumption: The reinfection hazard is proportional to the 7-day moving average of the total number of diagnosed infections (primary infections and reinfections).
A conclusion the paper draws from its own results — it cites no other source for it, so there is none to check. The quote shows it is in the paper.
In the paper
“which suggests that most third infections are associated with transmission of the Omicron variant (Fig. 3).”
§ Increased risk of SARS-CoV-2 reinfection associated with emergence of Omicron in South Africa > Individuals with multiple suspected reinfections
hedgedcorrelationaln = 1,492- Asserted: passes — The authors put it forward as true.
- Checkable: passes — It can be checked against evidence.
- Load-bearing: passes — The paper’s conclusions depend on it.
- Based: passes — The paper gives a reason why it holds.
A conclusion the paper draws from its own results — it cites no other source for it, so there is none to check. The quote shows it is in the paper.
In the paper
“The shape of the distribution is strongly influenced by the timing of South Africa’s epidemic waves, which have been spaced roughly six months apart.”
§ Increased risk of SARS-CoV-2 reinfection associated with emergence of Omicron in South Africa > Time between successive positive tests
boosteddirect- Asserted: passes — The authors put it forward as true.
- Checkable: passes — It can be checked against evidence.
- Load-bearing: unclear — It is unclear whether the paper’s conclusions depend on it.
- Based: passes — The paper gives a reason why it holds.
What the paper did — it cites no source for this, so there is none to check. The quote shows it is in the paper.
In the paper
“Second, we found consistent results using two different analytical methods, both of which accounted for the changing force of infection and increasing numbers of individuals at risk for reinfection.”
§ Increased risk of SARS-CoV-2 reinfection associated with emergence of Omicron in South Africa > Discussion and limitations > Strengths of this study
plain- Asserted: passes — The authors put it forward as true.
- Checkable: passes — It can be checked against evidence.
- Load-bearing: unclear — It is unclear whether the paper’s conclusions depend on it.
- Based: passes — The paper gives a reason why it holds.
None of the sources cited for this claim have been checked yet.
In the paper
“This finding has now been supported by analyses of reinfection with Omicron in the United Kingdom and Qatar ( 14 – 16 ).”
§ Increased risk of SARS-CoV-2 reinfection associated with emergence of Omicron in South Africa > Discussion and limitations
What the sources say
plaincorrelational- Asserted: passes — The authors put it forward as true.
- Checkable: passes — It can be checked against evidence.
- Load-bearing: unclear — It is unclear whether the paper’s conclusions depend on it.
- Based: passes — The paper gives a reason why it holds.
In the paper
“Pre-Omicron reinfection does however appear to be relatively uncommon.”
§ Increased risk of SARS-CoV-2 reinfection associated with emergence of Omicron in South Africa > Discussion and limitations
What the sources say
- Not checked yetcites [17] Public Health England, “SARS-CoV-2 variants of concern and variants under investigation - Technical briefing 19,” Technical briefing 19 (Technical briefing 19, Public Health England, 2021), p. 55.
hedged- Asserted: passes — The authors put it forward as true.
- Checkable: passes — It can be checked against evidence.
- Load-bearing: passes — The paper’s conclusions depend on it.
- Based: passes — The paper gives a reason why it holds.
What the paper did — it cites no source for this, so there is none to check. The quote shows it is in the paper.
In the paper
“Third, our real-time routine monitoring was sufficient to detect a population-level signal of immune evasion during the initial period of emergence of the Omicron variant in South Africa, prior to results from laboratory-based neutralization tests, providing timely information of importance to global public health planning.”
§ Increased risk of SARS-CoV-2 reinfection associated with emergence of Omicron in South Africa > Discussion and limitations > Strengths of this study
plaindirect- Asserted: passes — The authors put it forward as true.
- Checkable: passes — It can be checked against evidence.
- Load-bearing: passes — The paper’s conclusions depend on it.
- Based: passes — The paper gives a reason why it holds.
In the paper
“data from Qatar suggest that protection provided by prior infection is similar for Alpha and Delta ( 14 ).”
§ Increased risk of SARS-CoV-2 reinfection associated with emergence of Omicron in South Africa > Discussion and limitations
What the sources say
- Not checked yetcites [14] source
hedged- Asserted: passes — The authors put it forward as true.
- Checkable: passes — It can be checked against evidence.
- Load-bearing: unclear — It is unclear whether the paper’s conclusions depend on it.
- Based: passes — The paper gives a reason why it holds.
In the paper
“comparable to estimates of the level of protection against reinfection for wild type virus from the SIREN study in the UK ( 19 ).”
§ Increased risk of SARS-CoV-2 reinfection associated with emergence of Omicron in South Africa > Discussion and limitations
What the sources say
- Not checked yetcites [19] source
plain- Asserted: passes — The authors put it forward as true.
- Checkable: passes — It can be checked against evidence.
- Load-bearing: unclear — It is unclear whether the paper’s conclusions depend on it.
- Based: passes — The paper gives a reason why it holds.
What the paper did — it cites no source for this, so there is none to check. The quote shows it is in the paper.
In the paper
“However, comparing temporal trends in infection risk among those eligible for reinfection with the rest of the population, as in approach 2, mitigates against potential failure to detect a substantial increase in risk.”
§ Increased risk of SARS-CoV-2 reinfection associated with emergence of Omicron in South Africa > Discussion and limitations > Limitations of this study
plaindirect- Asserted: passes — The authors put it forward as true.
- Checkable: passes — It can be checked against evidence.
- Load-bearing: unclear — It is unclear whether the paper’s conclusions depend on it.
- Based: passes — The paper gives a reason why it holds.
What the paper did — it cites no source for this, so there is none to check. The quote shows it is in the paper.
In the paper
“The primary limitation of this study is that changes in testing practices, health-seeking behavior, or access to care have not been accounted for in these analyses.”
§ Increased risk of SARS-CoV-2 reinfection associated with emergence of Omicron in South Africa > Discussion and limitations > Limitations of this study
plain- Asserted: passes — The authors put it forward as true.
- Checkable: passes — It can be checked against evidence.
- Load-bearing: passes — The paper’s conclusions depend on it.
- Based: passes — The paper gives a reason why it holds.
A conclusion the paper draws from its own results — it cites no other source for it, so there is none to check. The quote shows it is in the paper.
In the paper
“Our findings regarding the Beta and Delta variants are somewhat at odds with in vitro neutralization studies.”
§ Increased risk of SARS-CoV-2 reinfection associated with emergence of Omicron in South Africa > Discussion and limitations
hedged- Asserted: passes — The authors put it forward as true.
- Checkable: passes — It can be checked against evidence.
- Load-bearing: unclear — It is unclear whether the paper’s conclusions depend on it.
- Based: passes — The paper gives a reason why it holds.
In the paper
“The PCR-confirmed reinfection rate ranged from 0% – 1.1% across eleven studies included in a systematic review ( 17 ).”
§ Increased risk of SARS-CoV-2 reinfection associated with emergence of Omicron in South Africa > Discussion and limitations
What the sources say
- Not checked yetcites [17] Public Health England, “SARS-CoV-2 variants of concern and variants under investigation - Technical briefing 19,” Technical briefing 19 (Technical briefing 19, Public Health England, 2021), p. 55.
plain- Asserted: passes — The authors put it forward as true.
- Checkable: passes — It can be checked against evidence.
- Load-bearing: unclear — It is unclear whether the paper’s conclusions depend on it.
- Based: passes — The paper gives a reason why it holds.
A conclusion the paper draws from its own results — it cites no other source for it, so there is none to check. The quote shows it is in the paper.
In the paper
“The timing of these changes strongly suggests that they were driven by the emergence of the Omicron variant.”
§ Increased risk of SARS-CoV-2 reinfection associated with emergence of Omicron in South Africa > Discussion and limitations
boostedconditional- Asserted: passes — The authors put it forward as true.
- Checkable: passes — It can be checked against evidence.
- Load-bearing: passes — The paper’s conclusions depend on it.
- Based: passes — The paper gives a reason why it holds.
In the paper
“which found that infection prior to the second wave provided 84% protection against reinfection during the second (Beta) wave ( 18 )”
§ Increased risk of SARS-CoV-2 reinfection associated with emergence of Omicron in South Africa > Discussion and limitations
What the sources say
- Not checked yetcites [18] source
plaindirect- Asserted: passes — The authors put it forward as true.
- Checkable: passes — It can be checked against evidence.
- Load-bearing: unclear — It is unclear whether the paper’s conclusions depend on it.
- Based: passes — The paper gives a reason why it holds.
In the paper
“vaccination coverage in South Africa was very low during much of the study period, with 22.5% of the population fully vaccinated by 30 November 2021 ( 27 ).”
§ Increased risk of SARS-CoV-2 reinfection associated with emergence of Omicron in South Africa > Discussion and limitations > Limitations of this study
What the sources say
- Not checked yetcites [27] Sahai H , Khurshid A. Statistics in Epidemiology: Methods, Techniques and Applications. 1st ed. CRC Press; 1995. 352 p.
plain- Asserted: passes — The authors put it forward as true.
- Checkable: passes — It can be checked against evidence.
- Load-bearing: unclear — It is unclear whether the paper’s conclusions depend on it.
- Based: passes — The paper gives a reason why it holds.
A conclusion the paper draws from its own results — it cites no other source for it, so there is none to check. The quote shows it is in the paper.
In the paper
“suggesting that the selective advantage that allowed these variants to spread derived primarily from increased transmissibility, rather than immune evasion.”
§ Increased risk of SARS-CoV-2 reinfection associated with emergence of Omicron in South Africa > Conclusion
hedgeddirect- Asserted: passes — The authors put it forward as true.
- Checkable: passes — It can be checked against evidence.
- Load-bearing: passes — The paper’s conclusions depend on it.
- Based: passes — The paper gives a reason why it holds.
What the paper did — it cites no source for this, so there is none to check. The quote shows it is in the paper.
In the paper
“we believe that our assessment of changes in the reinfection hazard are fairly robust to these detection issues.”
§ Increased risk of SARS-CoV-2 reinfection associated with emergence of Omicron in South Africa > Discussion and limitations > Limitations of this study
hedged- Asserted: passes — The authors put it forward as true.
- Checkable: passes — It can be checked against evidence.
- Load-bearing: passes — The paper’s conclusions depend on it.
- Based: passes — The paper gives a reason why it holds.
What the paper did — it cites no source for this, so there is none to check. The quote shows it is in the paper.
In the paper
“Nevertheless, the 90-day window period between consecutive positive tests reduces the possibility that suspected reinfections were predominantly the result of prolonged viral shedding.”
§ Increased risk of SARS-CoV-2 reinfection associated with emergence of Omicron in South Africa > Discussion and limitations > Limitations of this study
hedgeddirect- Asserted: passes — The authors put it forward as true.
- Checkable: passes — It can be checked against evidence.
- Load-bearing: passes — The paper’s conclusions depend on it.
- Based: passes — The paper gives a reason why it holds.
- It may state two separate claims as one. 25
- Probably not a substantial claim. 16
A result the paper reports from its own data — it cites no other source for it, so there is none to check. The quote shows it is in the paper.
In the paper
“No suspected reinfections were detected until 23 June 2020, after which the number of suspected reinfections increased gradually.”
§ Increased risk of SARS-CoV-2 reinfection associated with emergence of Omicron in South Africa > Population-level reinfection trends in South Africa
plain- Asserted: passes — The authors put it forward as true.
- Checkable: passes — It can be checked against evidence.
- Load-bearing: unclear — It is unclear whether the paper’s conclusions depend on it.
- Based: passes — The paper gives a reason why it holds.
It may state two separate claims as one.
A result the paper reports from its own data — it cites no other source for it, so there is none to check. The quote shows it is in the paper.
In the paper
“During the fourth wave, the 7-day moving average of suspected second infections reached nearly 2,700 and the 7-day moving average of all suspected reinfections (including second, third, and fourth infections) reached approximately 2,750.”
§ Increased risk of SARS-CoV-2 reinfection associated with emergence of Omicron in South Africa > Population-level reinfection trends in South Africa
plain- Asserted: passes — The authors put it forward as true.
- Checkable: passes — It can be checked against evidence.
- Load-bearing: unclear — It is unclear whether the paper’s conclusions depend on it.
- Based: passes — The paper gives a reason why it holds.
It may state two separate claims as one.
A result the paper reports from its own data — it cites no other source for it, so there is none to check. The quote shows it is in the paper.
In the paper
“In this analysis, the relative hazard ratio for wave 2 versus wave 1 was 0.71 (CI95: 0.60–0.85) and for wave 3 versus wave 1 was 0.54 (CI95: 0.45–0.64).”
§ Increased risk of SARS-CoV-2 reinfection associated with emergence of Omicron in South Africa > Estimation of time-varying infection and reinfection hazards
plaincorrelational- Asserted: passes — The authors put it forward as true.
- Checkable: passes — It can be checked against evidence.
- Load-bearing: passes — The paper’s conclusions depend on it.
- Based: passes — The paper gives a reason why it holds.
It may state two separate claims as one.
- The authors state this as an assumption: Observation probabilities for primary infections and reinfections are assumed for the hazard estimates.
A result the paper reports from its own data — it cites no other source for it, so there is none to check. The quote shows it is in the paper.
In the paper
“we identified 105,323 individuals with at least two suspected infections, 1,778 individuals with at least three suspected infections, and 18 individuals with four suspected infections.”
§ Increased risk of SARS-CoV-2 reinfection associated with emergence of Omicron in South Africa > Identification of and characterization of reinfections
plainn = 105,323- Asserted: passes — The authors put it forward as true.
- Checkable: passes — It can be checked against evidence.
- Load-bearing: passes — The paper’s conclusions depend on it.
- Based: passes — The paper gives a reason why it holds.
It may state two separate claims as one.
A result the paper reports from its own data — it cites no other source for it, so there is none to check. The quote shows it is in the paper.
In the paper
“From early November 2021, however, the 7-day moving average of observed reinfections reached the upper bound of the projection interval, with many individual daily numbers falling well above the projection interval, both nationally and in Gauteng (Fig. 4).”
§ Increased risk of SARS-CoV-2 reinfection associated with emergence of Omicron in South Africa > Comparison of data to projections from a null model
plaincorrelational- Asserted: passes — The authors put it forward as true.
- Checkable: passes — It can be checked against evidence.
- Load-bearing: passes — The paper’s conclusions depend on it.
- Based: passes — The paper gives a reason why it holds.
It may state two separate claims as one.
- The authors state this as an assumption: The reinfection hazard coefficient is constant through time in the null model.
- The authors state this as an assumption: The reinfection hazard is proportional to the 7-day moving average of the total number of diagnosed infections (primary infections and reinfections).
A result the paper reports from its own data — it cites no other source for it, so there is none to check. The quote shows it is in the paper.
In the paper
“Although there is substantial uncertainty in the estimated hazard coefficient for primary infection, it appeared to decrease from early October 2021, with a simultaneous increase in the estimated reinfection hazard coefficient (Fig. 5).”
§ Increased risk of SARS-CoV-2 reinfection associated with emergence of Omicron in South Africa > Estimation of time-varying infection and reinfection hazards
hedgedcorrelational- Asserted: passes — The authors put it forward as true.
- Checkable: passes — It can be checked against evidence.
- Load-bearing: passes — The paper’s conclusions depend on it.
- Based: passes — The paper gives a reason why it holds.
It may state two separate claims as one.
- The authors state this as an assumption: Observation probabilities for primary infections and reinfections are assumed for the hazard estimates.
A result the paper reports from its own data — it cites no other source for it, so there is none to check. The quote shows it is in the paper.
In the paper
“The 7-day moving average of suspected second infections reached a peak of approximately 160 during the second epidemic wave and 350 during the third wave (Fig. 1).”
§ Increased risk of SARS-CoV-2 reinfection associated with emergence of Omicron in South Africa > Population-level reinfection trends in South Africa
plain- Asserted: passes — The authors put it forward as true.
- Checkable: passes — It can be checked against evidence.
- Load-bearing: unclear — It is unclear whether the paper’s conclusions depend on it.
- Based: passes — The paper gives a reason why it holds.
It may state two separate claims as one.
A result the paper reports from its own data — it cites no other source for it, so there is none to check. The quote shows it is in the paper.
In the paper
“with the mean ratio of reinfection hazard to primary infection hazard for the period from 01 November 2021 to the beginning of the fourth wave increasing to 0.25, and a mean ratio during the fourth wave of 0.27.”
§ Increased risk of SARS-CoV-2 reinfection associated with emergence of Omicron in South Africa > Estimation of time-varying infection and reinfection hazards
plaindirect- Asserted: passes — The authors put it forward as true.
- Checkable: passes — It can be checked against evidence.
- Load-bearing: passes — The paper’s conclusions depend on it.
- Based: passes — The paper gives a reason why it holds.
It may state two separate claims as one.
- The authors state this as an assumption: Observation probabilities for primary infections and reinfections are assumed for the hazard estimates.
A result the paper reports from its own data — it cites no other source for it, so there is none to check. The quote shows it is in the paper.
In the paper
“The population at risk of reinfection has risen monotonically since the beginning of the epidemic, with relatively rapid increases associated with each wave (delayed by 90 days because of our definition of reinfection; Fig. 1B).”
§ Increased risk of SARS-CoV-2 reinfection associated with emergence of Omicron in South Africa > Population-level reinfection trends in South Africa
plaindirect- Asserted: passes — The authors put it forward as true.
- Checkable: passes — It can be checked against evidence.
- Load-bearing: unclear — It is unclear whether the paper’s conclusions depend on it.
- Based: passes — The paper gives a reason why it holds.
It may state two separate claims as one.
A result the paper reports from its own data — it cites no other source for it, so there is none to check. The quote shows it is in the paper.
In the paper
“In contrast, in November 2021, the number of daily new reinfections spiked and exceeded the 95% projection interval from the null model, accompanied by a notable increase in the hazard ratio for reinfection versus primary infection.”
§ Increased risk of SARS-CoV-2 reinfection associated with emergence of Omicron in South Africa > Discussion and limitations
plaincorrelational- Asserted: passes — The authors put it forward as true.
- Checkable: passes — It can be checked against evidence.
- Load-bearing: passes — The paper’s conclusions depend on it.
- Based: passes — The paper gives a reason why it holds.
It may state two separate claims as one.
- The authors state this as an assumption: The reinfection hazard coefficient is constant through time in the null model.
- The authors state this as an assumption: The reinfection hazard is proportional to the 7-day moving average of the total number of diagnosed infections (primary infections and reinfections).
A result the paper reports from its own data — it cites no other source for it, so there is none to check. The quote shows it is in the paper.
In the paper
“The relative hazard ratio for the period of Omicron emergence (01 November 2021 to the start of the fourth wave) versus wave 1 was 1.75 (CI95: 1.48–2.10), and for wave 4 versus wave 1 was 1.70 (CI95: 1.44–2.04).”
§ Increased risk of SARS-CoV-2 reinfection associated with emergence of Omicron in South Africa > Estimation of time-varying infection and reinfection hazards
plaincorrelational- Asserted: passes — The authors put it forward as true.
- Checkable: passes — It can be checked against evidence.
- Load-bearing: passes — The paper’s conclusions depend on it.
- Based: passes — The paper gives a reason why it holds.
It may state two separate claims as one.
- The authors state this as an assumption: Observation probabilities for primary infections and reinfections are assumed for the hazard estimates.
A result the paper reports from its own data — it cites no other source for it, so there is none to check. The quote shows it is in the paper.
In the paper
“As focal estimates from the two models were indistinguishable, we present only the results based on the random effect assumption.”
§ Increased risk of SARS-CoV-2 reinfection associated with emergence of Omicron in South Africa > Methods > Approach 2: Estimation of time-varying infection and reinfection hazards
plain- Asserted: passes — The authors put it forward as true.
- Checkable: passes — It can be checked against evidence.
- Load-bearing: fails — The paper’s conclusions may not depend on it.
- Based: passes — The paper gives a reason why it holds.
Probably not a substantial claim. The paper’s conclusions may not depend on it.
A result the paper reports from its own data — it cites no other source for it, so there is none to check. The quote shows it is in the paper.
In the paper
“We note that, of the 18,585 cases reported on 23 November, 93% had a specimen receipt date before 01 November 2021, and 6% had specimen receipt dates on or after 21 November 2021.”
§ Increased risk of SARS-CoV-2 reinfection associated with emergence of Omicron in South Africa > Methods > Data sources
plainn = 18,585- Asserted: passes — The authors put it forward as true.
- Checkable: passes — It can be checked against evidence.
- Load-bearing: fails — The paper’s conclusions may not depend on it.
- Based: passes — The paper gives a reason why it holds.
Probably not a substantial claim. The paper’s conclusions may not depend on it. It may state two separate claims as one.
A conclusion the paper draws from its own results — it cites no other source for it, so there is none to check. The quote shows it is in the paper.
In the paper
“as expected under a combination of relaxing of restrictions, behavioral fatigue, and introduction of variants with increased transmissibility (Beta and Delta).”
§ Increased risk of SARS-CoV-2 reinfection associated with emergence of Omicron in South Africa > Estimation of time-varying infection and reinfection hazards
plainconditional- Asserted: passes — The authors put it forward as true.
- Checkable: passes — It can be checked against evidence.
- Load-bearing: fails — The paper’s conclusions may not depend on it.
- Based: passes — The paper gives a reason why it holds.
Probably not a substantial claim. The paper’s conclusions may not depend on it.
A conclusion the paper draws from its own results — it cites no other source for it, so there is none to check. The quote shows it is in the paper.
In the paper
“we find clear, population-level evidence to suggest immune evasion by the Omicron (B.1.1.529) variant in previously infected individuals in South Africa.”
- Also stated in: § Discussion and limitations · hedged
“The timing of these changes strongly suggests that they were driven by the emergence of the Omicron variant.”
- Also stated in: § Conclusion · hedged
“We find evidence of a substantial increase in the risk of reinfection that is temporally consistent with the timing of the emergence of the Omicron variant in South Africa, suggesting that Omicron’s selection advantage is at least partially driven by an increased ability to infect previously infected individuals.”
§ Increased risk of SARS-CoV-2 reinfection associated with emergence of Omicron in South Africa > Abstract
hedgedconditional- Asserted: passes — The authors put it forward as true.
- Checkable: passes — It can be checked against evidence.
- Load-bearing: passes — The paper’s conclusions depend on it.
- Based: passes — The paper gives a reason why it holds.
It may state two separate claims as one.
- Also stated in: § Discussion and limitations · hedged
What the paper did — it cites no source for this, so there is none to check. The quote shows it is in the paper.
In the paper
“The absolute values of the hazard coefficients and hazard ratio are sensitive to assumed observation probabilities for primary infections and reinfections; however, the temporal trends are robust (fig. S8).”
§ Increased risk of SARS-CoV-2 reinfection associated with emergence of Omicron in South Africa > Estimation of time-varying infection and reinfection hazards
plaincorrelational- Asserted: passes — The authors put it forward as true.
- Checkable: passes — It can be checked against evidence.
- Load-bearing: passes — The paper’s conclusions depend on it.
- Based: passes — The paper gives a reason why it holds.
It may state two separate claims as one.
- The authors state this as an assumption: Observation probabilities for primary infections and reinfections are assumed for the hazard estimates.
A conclusion the paper draws from its own results — it cites no other source for it, so there is none to check. The quote shows it is in the paper.
In the paper
“This observed deviation from the projection under the null model is a signature of immune evasion, and the timing of this deviation suggests it is associated with the emergence of the Omicron variant.”
§ Increased risk of SARS-CoV-2 reinfection associated with emergence of Omicron in South Africa > Comparison of data to projections from a null model
hedgedcorrelational- Asserted: passes — The authors put it forward as true.
- Checkable: passes — It can be checked against evidence.
- Load-bearing: passes — The paper’s conclusions depend on it.
- Based: passes — The paper gives a reason why it holds.
It may state two separate claims as one.
- The authors state this as an assumption: The reinfection hazard coefficient is constant through time in the null model.
- The authors state this as an assumption: The reinfection hazard is proportional to the 7-day moving average of the total number of diagnosed infections (primary infections and reinfections).
In the paper
“Estimates based on serological data from blood donors suggest substantial geographic variability in detection rates ( 22 ), which may contribute to the observed differences in reinfection patterns by province (fig. S1).”
§ Increased risk of SARS-CoV-2 reinfection associated with emergence of Omicron in South Africa > Discussion and limitations > Limitations of this study
What the sources say
- Not checked yetcites [22] source
hedgedconditional- Asserted: passes — The authors put it forward as true.
- Checkable: passes — It can be checked against evidence.
- Load-bearing: fails — The paper’s conclusions may not depend on it.
- Based: passes — The paper gives a reason why it holds.
Probably not a substantial claim. The paper’s conclusions may not depend on it. It may state two separate claims as one.
A conclusion the paper draws from its own results — it cites no other source for it, so there is none to check. The quote shows it is in the paper.
In the paper
“as would be expected if the risk of primary infection increased without a corresponding increase in reinfection risk.”
§ Increased risk of SARS-CoV-2 reinfection associated with emergence of Omicron in South Africa > Discussion and limitations
hedgedconditional- Asserted: passes — The authors put it forward as true.
- Checkable: passes — It can be checked against evidence.
- Load-bearing: passes — The paper’s conclusions depend on it.
- Based: passes — The paper gives a reason why it holds.
Probably not a substantial claim.
In the paper
“A preliminary analysis of reinfection trends in England suggested that the Delta variant may have a higher risk of reinfection compared to the Alpha variant ( 20 ); however, this analysis did not take into account the temporal trend in the population at risk for reinfection, which may have biased the findings.”
§ Increased risk of SARS-CoV-2 reinfection associated with emergence of Omicron in South Africa > Discussion and limitations
What the sources say
- Not checked yetcites [20] source
hedgedconditional- Asserted: passes — The authors put it forward as true.
- Checkable: passes — It can be checked against evidence.
- Load-bearing: unclear — It is unclear whether the paper’s conclusions depend on it.
- Based: passes — The paper gives a reason why it holds.
It may state two separate claims as one.
What the paper did — it cites no source for this, so there is none to check. The quote shows it is in the paper.
In the paper
“In particular, rapid antigen tests, which were introduced in South Africa in late 2020, may be under-reported despite mandatory reporting requirements. Although we have incorporated adjustments that account for late reporting of antigen tests, if under-reporting of antigen tests was substantial and time-varying it could still influence our findings.”
§ Increased risk of SARS-CoV-2 reinfection associated with emergence of Omicron in South Africa > Discussion and limitations > Limitations of this study
hedgedconditional- Asserted: passes — The authors put it forward as true.
- Checkable: passes — It can be checked against evidence.
- Load-bearing: fails — The paper’s conclusions may not depend on it.
- Based: passes — The paper gives a reason why it holds.
Probably not a substantial claim. The paper’s conclusions may not depend on it. It may state two separate claims as one.
What the paper did — it cites no source for this, so there is none to check. The quote shows it is in the paper.
In the paper
“First, we analyzed a large routine national data set comprising all confirmed cases in the country, allowing a comprehensive analysis of suspected reinfections in the country.”
§ Increased risk of SARS-CoV-2 reinfection associated with emergence of Omicron in South Africa > Discussion and limitations > Strengths of this study
plain- Asserted: passes — The authors put it forward as true.
- Checkable: passes — It can be checked against evidence.
- Load-bearing: passes — The paper’s conclusions depend on it.
- Based: passes — The paper gives a reason why it holds.
It may state two separate claims as one.
None of the sources cited for this claim have been checked yet.
In the paper
“Both the Beta and Delta variants are associated with decreased neutralization by some anti-receptor binding-domain (anti-RBD) and anti-N-terminal domain (anti-NTD) monoclonal antibodies though both Beta and Delta each remain responsive to at least one anti-RBD ( 8 , 9 , 21 ).”
§ Increased risk of SARS-CoV-2 reinfection associated with emergence of Omicron in South Africa > Discussion and limitations
What the sources say
- Not checked yetcites [8] source
- Not checked yetcites [9] D. Planas , D. Veyer , A. Baidaliuk , I. Staropoli , F. Guivel-Benhassine , M. M. Rajah , C. Planchais , F. Porrot , N. Robillard , J. Puech , M. Prot , F. Gallais , P. Gantner , A. Velay , J. Le Guen , N. Kassis-Chikhani , D. Edriss , L. Belec , A. Seve , L. Courtellemont , H. Péré , L. Hocqueloux , S. Fafi-Kremer , T. Prazuck , H. Mouquet , T. Bruel , E. Simon-Lorière , F. A. Rey , O. Schwartz , Reduced sensitivity of SARS-CoV-2 variant Delta to antibody neutralization. Nature, 1–7 (2021). source
- Not checked yetcites [21] 2021, Antibody Responses in Seropositive Persons after a Single Dose of SARS-CoV-2 mRNA Vaccine, N Engl J Med source
plaincorrelational- Asserted: passes — The authors put it forward as true.
- Checkable: passes — It can be checked against evidence.
- Load-bearing: fails — The paper’s conclusions may not depend on it.
- Based: passes — The paper gives a reason why it holds.
Probably not a substantial claim. The paper’s conclusions may not depend on it. It may state two separate claims as one.
None of the sources cited for this claim have been checked yet.
In the paper
“In addition, Beta and Delta are relatively poorly neutralized by convalescent sera obtained from unvaccinated individuals infected with non-VOC virus ( 7 – 9 , 21 ).”
§ Increased risk of SARS-CoV-2 reinfection associated with emergence of Omicron in South Africa > Discussion and limitations
What the sources say
- Not checked yetcites [7] 2021, Escape of SARS-CoV-2 501Y.V2 from neutralization by convalescent plasma, Nature source
- Not checked yetcites [8] source
- Not checked yetcites [9] D. Planas , D. Veyer , A. Baidaliuk , I. Staropoli , F. Guivel-Benhassine , M. M. Rajah , C. Planchais , F. Porrot , N. Robillard , J. Puech , M. Prot , F. Gallais , P. Gantner , A. Velay , J. Le Guen , N. Kassis-Chikhani , D. Edriss , L. Belec , A. Seve , L. Courtellemont , H. Péré , L. Hocqueloux , S. Fafi-Kremer , T. Prazuck , H. Mouquet , T. Bruel , E. Simon-Lorière , F. A. Rey , O. Schwartz , Reduced sensitivity of SARS-CoV-2 variant Delta to antibody neutralization. Nature, 1–7 (2021). source
- Not checked yetcites [21] 2021, Antibody Responses in Seropositive Persons after a Single Dose of SARS-CoV-2 mRNA Vaccine, N Engl J Med source
plaincorrelational- Asserted: passes — The authors put it forward as true.
- Checkable: passes — It can be checked against evidence.
- Load-bearing: fails — The paper’s conclusions may not depend on it.
- Based: passes — The paper gives a reason why it holds.
Probably not a substantial claim. The paper’s conclusions may not depend on it.
In the paper
“Lastly sera obtained from individuals after both one and two doses of the BNT162b2 (Pfizer) or ChAdOx1 (AstraZeneca) vaccines displayed lower neutralization of the Beta and Delta variants when compared to non-VOC and Alpha variant ( 9 )”
§ Increased risk of SARS-CoV-2 reinfection associated with emergence of Omicron in South Africa > Discussion and limitations
What the sources say
- Not checked yetcites [9] D. Planas , D. Veyer , A. Baidaliuk , I. Staropoli , F. Guivel-Benhassine , M. M. Rajah , C. Planchais , F. Porrot , N. Robillard , J. Puech , M. Prot , F. Gallais , P. Gantner , A. Velay , J. Le Guen , N. Kassis-Chikhani , D. Edriss , L. Belec , A. Seve , L. Courtellemont , H. Péré , L. Hocqueloux , S. Fafi-Kremer , T. Prazuck , H. Mouquet , T. Bruel , E. Simon-Lorière , F. A. Rey , O. Schwartz , Reduced sensitivity of SARS-CoV-2 variant Delta to antibody neutralization. Nature, 1–7 (2021). source
plaincorrelational- Asserted: passes — The authors put it forward as true.
- Checkable: passes — It can be checked against evidence.
- Load-bearing: fails — The paper’s conclusions may not depend on it.
- Based: passes — The paper gives a reason why it holds.
Probably not a substantial claim. The paper’s conclusions may not depend on it.
A conclusion the paper draws from its own results — it cites no other source for it, so there is none to check. The quote shows it is in the paper.
In the paper
“The effect of this misclassification on the signal of immune escape during the period of Omicron’s emergence would likely be small and would be expected to bias subsequent reinfection hazard estimates downwards.”
§ Increased risk of SARS-CoV-2 reinfection associated with emergence of Omicron in South Africa > Discussion and limitations > Limitations of this study
hedgedconditional- Asserted: passes — The authors put it forward as true.
- Checkable: passes — It can be checked against evidence.
- Load-bearing: unclear — It is unclear whether the paper’s conclusions depend on it.
- Based: passes — The paper gives a reason why it holds.
It may state two separate claims as one.
- The authors state this as an assumption: The force of infection is proportional to the number of positive tests.
What the paper did — it cites no source for this, so there is none to check. The quote shows it is in the paper.
In the paper
“The specimen receipt date was chosen as the reference point for analysis because it is complete within the data set; however, problems have been identified with accuracy of specimen receipt dates for tests associated with substantially delayed reporting from some laboratories.”
§ Increased risk of SARS-CoV-2 reinfection associated with emergence of Omicron in South Africa > Methods > Data sources
plain- Asserted: passes — The authors put it forward as true.
- Checkable: passes — It can be checked against evidence.
- Load-bearing: passes — The paper’s conclusions depend on it.
- Based: passes — The paper gives a reason why it holds.
Probably not a substantial claim. It may state two separate claims as one.
What the paper did — it cites no source for this, so there is none to check. The quote shows it is in the paper.
In the paper
“The other main limitation of this study is that reinfections were not confirmed by sequencing or by requiring a negative test between putative infections.”
§ Increased risk of SARS-CoV-2 reinfection associated with emergence of Omicron in South Africa > Discussion and limitations > Limitations of this study
plain- Asserted: passes — The authors put it forward as true.
- Checkable: passes — It can be checked against evidence.
- Load-bearing: passes — The paper’s conclusions depend on it.
- Based: passes — The paper gives a reason why it holds.
It may state two separate claims as one.
A conclusion the paper draws from its own results — it cites no other source for it, so there is none to check. The quote shows it is in the paper.
In the paper
“The discrepancy between the population-level evidence presented here and expectations based on laboratory-based neutralization assays for Beta and Delta highlights the need to identify better correlates of immunity for assessing immune escape in vitro.”
§ Increased risk of SARS-CoV-2 reinfection associated with emergence of Omicron in South Africa > Conclusion
plain- Asserted: passes — The authors put it forward as true.
- Checkable: fails — It may be too vague to check against evidence.
- Load-bearing: passes — The paper’s conclusions depend on it.
- Based: passes — The paper gives a reason why it holds.
Probably not a substantial claim. It may be too vague to check against evidence.
In the paper
“Convergence was assessed using the Gelman-Rubin diagnostic ( 29 ).”
§ Increased risk of SARS-CoV-2 reinfection associated with emergence of Omicron in South Africa > Methods > Approach 1: Catalytic model assuming a constant reinfection hazard coefficient
What the sources say
- Not checked yetcites [29]
plain- Asserted: passes — The authors put it forward as true.
- Checkable: passes — It can be checked against evidence.
- Load-bearing: fails — The paper’s conclusions may not depend on it.
- Based: passes — The paper gives a reason why it holds.
Probably not a substantial claim. The paper’s conclusions may not depend on it.
What the paper did — it cites no source for this, so there is none to check. The quote shows it is in the paper.
In the paper
“Civil unrest during July 2021 severely disrupted testing in Gauteng and KwaZulu-Natal, the two most populous provinces in the country. Case data are unreliable during the period of unrest and a key assumption of our models - that the force of infection is proportional to the number of positive tests - was violated during this period”
§ Increased risk of SARS-CoV-2 reinfection associated with emergence of Omicron in South Africa > Discussion and limitations > Limitations of this study
plaindirect- Asserted: passes — The authors put it forward as true.
- Checkable: passes — It can be checked against evidence.
- Load-bearing: unclear — It is unclear whether the paper’s conclusions depend on it.
- Based: passes — The paper gives a reason why it holds.
It may state two separate claims as one.
- The authors state this as an assumption: The force of infection is proportional to the number of positive tests.
What the paper did — it cites no source for this, so there is none to check. The quote shows it is in the paper.
In the paper
“We constructed uncertainty intervals around λ1t , λ2t , and their ratio, taking into account both measurement noise and uncertainty in the observation parameters (see the supplementary materials for details).”
§ Increased risk of SARS-CoV-2 reinfection associated with emergence of Omicron in South Africa > Methods > Approach 2: Estimation of time-varying infection and reinfection hazards
plain- Asserted: passes — The authors put it forward as true.
- Checkable: passes — It can be checked against evidence.
- Load-bearing: fails — The paper’s conclusions may not depend on it.
- Based: passes — The paper gives a reason why it holds.
Probably not a substantial claim. The paper’s conclusions may not depend on it.
What the paper did — it cites no source for this, so there is none to check. The quote shows it is in the paper.
In the paper
“For these tests, which had equivalent entries for specimen receipt date and specimen report date that were more than 7 days after the sample collection date, the specimen receipt date was adjusted to be 1 day after the sample collection date, reflecting the median delay across all tests.”
§ Increased risk of SARS-CoV-2 reinfection associated with emergence of Omicron in South Africa > Methods > Data sources
plain- Asserted: passes — The authors put it forward as true.
- Checkable: passes — It can be checked against evidence.
- Load-bearing: passes — The paper’s conclusions depend on it.
- Based: passes — The paper gives a reason why it holds.
Probably not a substantial claim.
In the paper
“All positive tests conducted in South Africa appear in the combined data set, regardless of the reason for testing or type of test (PCR or antigen detection), and include the large number of positive tests that were retrospectively added to the data set on 23 November 2021 ( 28 ).”
§ Increased risk of SARS-CoV-2 reinfection associated with emergence of Omicron in South Africa > Methods > Data sources
What the sources say
- Not checked yetcites [28] source
plainn = 18,585- Asserted: passes — The authors put it forward as true.
- Checkable: passes — It can be checked against evidence.
- Load-bearing: passes — The paper’s conclusions depend on it.
- Based: passes — The paper gives a reason why it holds.
It may state two separate claims as one.
What the paper did — it cites no source for this, so there is none to check. The quote shows it is in the paper.
In the paper
“A combination of deterministic (national identity number, names, dates of birth) and probabilistic linkage methods were utilized to identify repeated tests conducted on the same person.”
§ Increased risk of SARS-CoV-2 reinfection associated with emergence of Omicron in South Africa > Methods > Data sources
plain- Asserted: passes — The authors put it forward as true.
- Checkable: passes — It can be checked against evidence.
- Load-bearing: passes — The paper’s conclusions depend on it.
- Based: passes — The paper gives a reason why it holds.
Probably not a substantial claim.
What the paper did — it cites no source for this, so there is none to check. The quote shows it is in the paper.
In the paper
“The vaccination status of individuals with suspected reinfections identified in this study was unknown.”
§ Increased risk of SARS-CoV-2 reinfection associated with emergence of Omicron in South Africa > Discussion and limitations > Limitations of this study
plain- Asserted: passes — The authors put it forward as true.
- Checkable: passes — It can be checked against evidence.
- Load-bearing: fails — The paper’s conclusions may not depend on it.
- Based: passes — The paper gives a reason why it holds.
Probably not a substantial claim. The paper’s conclusions may not depend on it.
The authors state this as an assumption.
The reinfection hazard coefficient is constant through time in the null model.
“under the assumption of a constant reinfection hazard coefficient (i.e., a null model of no change in reinfection risk)”
The authors state this as an assumption.
The reinfection hazard is proportional to the 7-day moving average of the total number of diagnosed infections (primary infections and reinfections).
“The model assumes the reinfection hazard is proportional to the 7-day moving average of the total number of diagnosed infections (primary infections and reinfections).”
The authors state this as an assumption.
The force of infection is proportional to the number of positive tests.
“a key assumption of our models - that the force of infection is proportional to the number of positive tests - was violated during this period”
The authors state this as an assumption.
Observation probabilities for primary infections and reinfections are assumed for the hazard estimates.
“The absolute values of the hazard coefficients and hazard ratio are sensitive to assumed observation probabilities for primary infections and reinfections”
The authors state this as an assumption.
The reinfection hazard experienced by previously diagnosed individuals is proportional to the incidence of detected infections.
“First, we constructed a simple null model based on the assumption that the reinfection hazard experienced by previously diagnosed individuals is proportional to the incidence of detected infections and fit this model to the pattern of suspected second infections observed through 28 February 2021.”
The authors state this as an assumption.
The reinfection hazard coefficient does not change through time.
“The null model assumes no change in the reinfection hazard coefficient through time.”
The authors state this as an assumption.
For a case testing positive on day t, the reinfection hazard is 0 for each day from t+1 to t+89 and λI^τ for each day τ≥t+90.
“For a case testing positive on day t (by specimen receipt date), we assumed the reinfection hazard is 0 for each day from t+1 to t+89 and λI^τ for each day τ≥t+90 , where I^τ is the 7-day moving average of the detected case incidence (first infections and reinfections) for day τ .”
The authors state this as an assumption.
The observed reinfection incidence data are negative binomially distributed with mean Dx.
“The model was fitted to observed reinfection incidence through 28 February 2021 assuming data are negative binomially distributed with mean Dx .”
The authors state this as an assumption.
Individuals whose first infection was missed experience the same infection hazard as individuals whose primary infection was diagnosed and who have not yet been reinfected.
“These individuals are assumed to experience the same infection hazard as individuals whose primary infection was diagnosed and who have not yet been reinfected, estimated as h2t=X^t/pobs2S2t .”
The authors state this as an assumption.
Individuals are not eligible for reinfection until at least 90 days after their primary infection.
“Because individuals are not eligible for reinfection until at least 90 days after their primary infection, we set Ut=h2t=0 when t<90 .”
The authors state this as an assumption.
The hazard of infection is proportional to the 7-day moving average of infection incidence.
“If we assume that the hazard of infection is proportional to the 7-day moving average of infection incidence ( Yt^=P^t+U^t+Xt^/pobs2 ), we can then examine the infectiousness of the virus through time as λ1t=h1t/Yt^ and λ2t=h2t/Yt^ .”
The authors state this as an assumption.
The probability of detection for primary infections (pobs) is 0.1 and for individuals with a previously identified infection (pobs2) is 0.5.
“For this analysis, we assume pobs=0.1 and pobs2=0.5 , which falls within the plausible range of observation probabilities (fig. S8).”
Claims other papers make about this one
Each is checked against this paper’s own text: does it say what the citing paper says it does?
In the citing paper
“These findings are consistent with emerging clinical data on the Omicron variant demonstrating higher rates of reinfection 11 and vaccine breakthroughs.”
From Striking antibody evasion manifested by the Omicron variant of SARS-CoV-2 (2022) · cites this paper as [11]
Self-check
Percentages, sums and reported differences re-computed from the paper’s own numbers.
Each contradiction between two passages listed here was confirmed by an independent check.
Rated minor: it would not touch a result — a value no result rests on, a p-value that stays on the same side of the significance level, or a conflict that is clerical, resolved elsewhere in the paper, or outside its own findings.
In the paper
§ Increased risk of SARS-CoV-2 reinfection associated with emergence of Omicron in South Africa > Methods > Approach 2: Estimation of time-varying infection and reinfection hazards
“S2t=∑i=0i=t−89Pobsi−∑i=0i=tXipobs2”
§ Increased risk of SARS-CoV-2 reinfection associated with emergence of Omicron in South Africa > Methods > Approach 2: Estimation of time-varying infection and reinfection hazards
“Because individuals are not eligible for reinfection until at least 90 days after their primary infection”
Citations
Cites
Inference from iterative simulation using multiple sequences
Gelman, A., & Rubin, D. B. (1992) · Statistical Science · doi:10.1214/ss/1177011136 · Cited by 16,627
GISAID: Global initiative on sharing all influenza data – from vision to reality
Shu, Y., & McCauley, J. (2017) · Eurosurveillance · doi:10.2807/1560-7917.es.2017.22.13.30494 · Cited by 3,039
Detection of a SARS-CoV-2 variant of concern in South Africa
Tegally, H., Wilkinson, E., Giovanetti, M., Iranzadeh, A., Fonseca, V., Giandhari, J., Doolabh, D., Pillay, S., San, E. J., Msomi, N., et al. (2021) · Nature · doi:10.1038/s41586-021-03402-9 · Cited by 2,510
Self-citationAntibody resistance of SARS-CoV-2 variants B.1.351 and B.1.1.7
Wang, P., Nair, M. S., Liu, L., Iketani, S., Luo, Y., Guo, Y., Wang, M., Yu, J., Zhang, B., Kwong, P. D., et al. (2021) · Nature · doi:10.1038/s41586-021-03398-2 · Cited by 2,312
Reduced sensitivity of SARS-CoV-2 variant Delta to antibody neutralization
Planas, D., Veyer, D., Baidaliuk, A., Staropoli, I., Guivel-Benhassine, F., Rajah, M. M., Planchais, C., Porrot, F., Robillard, N., Puech, J., et al. (2021) · Nature · doi:10.1038/s41586-021-03777-9 · Cited by 1,992 · cited 2×
“Finally, sera obtained from individuals after both one and two doses of the BNT162b2 (Pfizer) or ChAdOx1 (AstraZeneca) vaccines displayed lower neutralization of the Beta and Delta variants compared with non-VOCs and the Alpha VOC (9).”
Rapid epidemic expansion of the SARS-CoV-2 Omicron variant in southern Africa
Viana, R. P. E. S., Moyo, S. M., Amoako, D. G., Tegally, H., Scheepers, C., Althaus, C. L., Anyaneji, U. J., Bester, P. A., Boni, M. F., Chand, M., et al. (2022) · Nature · doi:10.1038/s41586-022-04411-y · Cited by 1,678
Self-citationConsiderable escape of SARS-CoV-2 Omicron to antibody neutralization
Planas, D., Saunders, N., Maes, P., Guivel-Benhassine, F., Planchais, C., Buchrieser, J., Bolland, W.-H., Porrot, F., Staropoli, I., Lemoine, F., et al. (2022) · Nature · doi:10.1038/s41586-021-04389-z · Cited by 1,514
Persistence and Evolution of SARS-CoV-2 in an Immunocompromised Host
Choi, B., Choudhary, M. C., Regan, J., Sparks, J. A., Padera, R. F., Qiu, X., Solomon, I. H., Kuo, H.-H., Boucau, J., Bowman, K., et al. (2020) · New England Journal of Medicine · doi:10.1056/nejmc2031364 · Cited by 1,246
SARS-CoV-2 501Y.V2 escapes neutralization by South African COVID-19 donor plasma
Wibmer, C. K., Ayres, F., Hermanus, T., Madzivhandila, M., Kgagudi, P., Oosthuysen, B., Lambson, B. E., de Oliveira, T., Vermeulen, M., van der Berg, K., et al. (2021) · Nature Medicine · doi:10.1038/s41591-021-01285-x · Cited by 1,147
Self-citationAntibody Responses in Seropositive Persons after a Single Dose of SARS-CoV-2 mRNA Vaccine
Krammer, F., Srivastava, K., Alshammary, H., Amoako, A. A., Awawda, M. H., Beach, K. F., Bermúdez-González, M. C., Bielak, D. A., Carreño, J. M., Chernet, R. L., et al. (2021) · New England Journal of Medicine · doi:10.1056/nejmc2101667 · Cited by 696
Cited by
Sorted by citations
Rapid epidemic expansion of the SARS-CoV-2 Omicron variant in southern Africa
Viana, R. P. E. S., Moyo, S. M., Amoako, D. G., Tegally, H., Scheepers, C., Althaus, C. L., Anyaneji, U. J., Bester, P. A., Boni, M. F., Chand, M., et al. (2022) · Nature · doi:10.1038/s41586-022-04411-y · Cited by 1,678
Self-citationConsiderable escape of SARS-CoV-2 Omicron to antibody neutralization
Planas, D., Saunders, N., Maes, P., Guivel-Benhassine, F., Planchais, C., Buchrieser, J., Bolland, W.-H., Porrot, F., Staropoli, I., Lemoine, F., et al. (2022) · Nature · doi:10.1038/s41586-021-04389-z · Cited by 1,514
Cele, S., Jackson, L., Khoury, D. S., Khan, K., Moyo-Gwete, T., Tegally, H., San, J. E., Cromer, D., Scheepers, C., Amoako, D., et al. (2021) · doi:10.1101/2021.12.08.21267417 · Cited by 1,333
Self-citationStriking antibody evasion manifested by the Omicron variant of SARS-CoV-2
Liu, L., Iketani, S., Guo, Y., Chan, J. F.-W., Wang, M., Liu, L., Luo, Y., Chu, H., Huang, Y., Nair, M. S., et al. (2022) · Nature · doi:10.1038/s41586-021-04388-0 · Cited by 1,290
Markov, P. V., Ghafari, M., Beer, M., Lythgoe, K., Simmonds, P., Stilianakis, N. I., & Katzourakis, A. (2023) · Nature Reviews Microbiology · doi:10.1038/s41579-023-00878-2 · Cited by 1,179
Metadata
- Authors
- Pulliam, J. R. C., van Schalkwyk, C., Govender, N., Gottberg, A. V., Cohen, C., Groome, M. J., Dushoff, J., Mlisana, K., & Moultrie, H.
- Affiliations
- Stellenbosch University (ZA)
- National Health Laboratory Service (ZA)
- Corresponding author
- Pulliam, Juliet R.C.
- ORCID
- Venue
- Science
- Publisher
- openRxiv
- Published
- 2021-11-11
- Volume
- 376
- Issue
- 6593
- Pages
- eabn4947-eabn4947
- ISSN
- 0036-8075 (ISSN-L)
- PMC
- PMC8995029
- OpenAlex
- W4220987557
- Cited by
- 1,037
- References
- 25
- Citations by year
- 2026: 24 · 2025: 48 · 2024: 161 · 2023: 260 · 2022: 485 · 2021: 58
- FWCI
- 116.60
- Type
- journal article
- Language
- en
- Open access
- hybrid
- doi.org
- Licence
- cc-by
- Locations
- Science (publishedVersion, cc-by)
- medRxiv (acceptedVersion, cc-by)
- PubMed Central (publishedVersion, cc-by)
- PubMed (publishedVersion)
- Funders
- Wellcome Trust (221003/Z/20/Z)
- Department of Science and Innovation, South Africa
- National Research Foundation
- Foreign, Commonwealth and Development Office
- Topics
- Health Sciences › Medicine › Infectious Diseases › SARS-CoV-2 and COVID-19 Research
- Physical Sciences › Mathematics › Modeling and Simulation › COVID-19 epidemiological studies
- Health Sciences › Medicine › Infectious Diseases › COVID-19 Clinical Research Studies
- Keywords
- SARS-CoV-2 reinfection, Omicron variant, immune evasion, Beta variant, Delta variant
- MeSH terms
- Reinfection, COVID-19, SARS-CoV-2, Humans, South Africa
About these checks
Registry, retraction, Cites and statistics results are computed, not judged, with one exception: a printed reference that no index lists is read once by a model before it counts as a citation error. Claims are extracted by a model and kept only when their quote appears verbatim in the text; each cited source is then checked, with a model’s help, for whether it says what the claim relies on. Those verdicts can be wrong — read the claim’s quote and the cited source before relying on one.
A language model drew the claims from the paper on 2026-10-10, under version 3 of the claim definition (model deepseek-v4.1-flash, prompt extract-v3).
A second model labelled each claim on 2026-10-10 (model jev-1.13-20260917, definition revision gold-guideline-v0.2).
Statistics and arithmetic are recomputed, not judged.
Confidence bands are shown only for fields calibrated on our annotated test set. None is calibrated yet, so no band is shown.
What counts as a claim ›How we measure confidence ›How we check this ›
Are you an author, or do you see a problem with this page? Request a review
