PreprintCited by 16Mitochondrial Function and PathologyEnzyme Structure and FunctionAdvanced Electron Microscopy Techniques and Applications

The DOI matches its Crossref record; 1 of the 1 references it cites were found in a registry or an index.

The structure of the human LACTB filament reveals the mechanisms of assembly and membrane binding

Open access

Preprint — published as 10.1371/journal.pbio.3001899 · Paper page

Abstract

Mitochondria are complex organelles that play a central role in metabolism. Dynamic membrane-associated processes regulate mitochondrial morphology and bioenergetics in response to cellular demand. In tumor cells, metabolic reprogramming requires active mitochondrial metabolism for providing key metabolites and building blocks for tumor growth and rapid proliferation. To counter this, the mitochondrial serine beta-lactamase-like protein (LACTB) alters mitochondrial lipid metabolism and potently inhibits the proliferation of a variety of tumor cells. Mammalian LACTB is localized in the mitochondrial intermembrane space, where it assembles into filaments to regulate the efficiency of essential metabolic processes. However, the structural basis of LACTB polymerization and regulation remains incompletely understood. Here, we describe how human LACTB self-assembles into micron-scale filaments that increase their catalytic activity. The electron cryo-microscopy (cryoEM) structure defines the mechanism of assembly and reveals how highly ordered filament bundles stabilize the active state of the enzyme. We identify and characterize residues that are located at the filament-forming interface, and further show that mutations that disrupt filamentation reduce enzyme activity. Furthermore, our results provide evidence that LACTB filaments can bind lipid membranes. These data reveal the detailed molecular organization and polymerization-based regulation of human LACTB and provide new insights into the mechanism of mitochondrial membrane organization that modulates lipid metabolism.

Overview

The claims and statistics of this paper haven’t been checked yet.

Run the check — free, no account needed. It reads the open-access text and checks the sources it cites.

A few free checks a day · papers already verified open instantly · results are public

Integrity signals

Registry

Crossref · 10.1101/2022.04.21.489104

Cites

1 of 1 references verified0 citation errors · 0 not checkable

Statistics

Figures

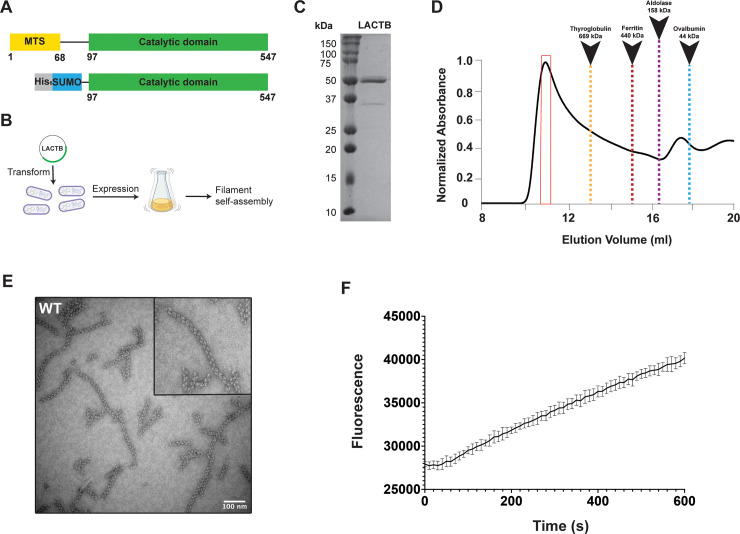
Fig 1 Human LACTB assembles into a filament. (A) Domain organization of full-length human LACTB and the construct used in the study. The color scheme is used throughout the manuscript. (B) Schematic diagram for recombinant expression and self-assembly of LACTB. (C) Coomassie-stained SDS-PAGE of purified LACTB filament. (D) Size-exclusion profile of WT LACTB using a Superose 6 column. SEC elution profile begins with the void volume (V0) of the column. (E) Representative negative-stain TEM image of purified samples containing high molecular weight species. Negative-stain TEM analysis is shown for the samples taken from the primary peak observed in the size-exclusion chromatogram and is highlighted with a red box in (C). Scale bar, 100 nm. (F) Activity of the purified LACTB filaments was determined by using a fluorescence-based assay with the error bars representing the SEM. Source data for (F) is provided in sheet Fig 1F in S1 Data. SEC, size-exclusion chromatography; SEM, standard error of the mean; TEM, transmission electron microscopy; WT, wild-type.
Fig 1 Human LACTB assembles into a filament. (A) Domain organization of full-length human LACTB and the construct used in the study. The color scheme is used throughout the manuscript. (B) Schematic diagram for recombinant expression and self-assembly of LACTB. (C) Coomassie-stained SDS-PAGE of purified LACTB filament. (D) Size-exclusion profile of WT LACTB using a Superose 6 column. SEC elution profile begins with the void volume (V0) of the column. (E) Representative negative-stain TEM image of purified samples containing high molecular weight species. Negative-stain TEM analysis is shown for the samples taken from the primary peak observed in the size-exclusion chromatogram and is highlighted with a red box in (C). Scale bar, 100 nm. (F) Activity of the purified LACTB filaments was determined by using a fluorescence-based assay with the error bars representing the SEM. Source data for (F) is provided in sheet Fig 1F in S1 Data. SEC, size-exclusion chromatography; SEM, standard error of the mean; TEM, transmission electron microscopy; WT, wild-type.CC BY · PubMed Central
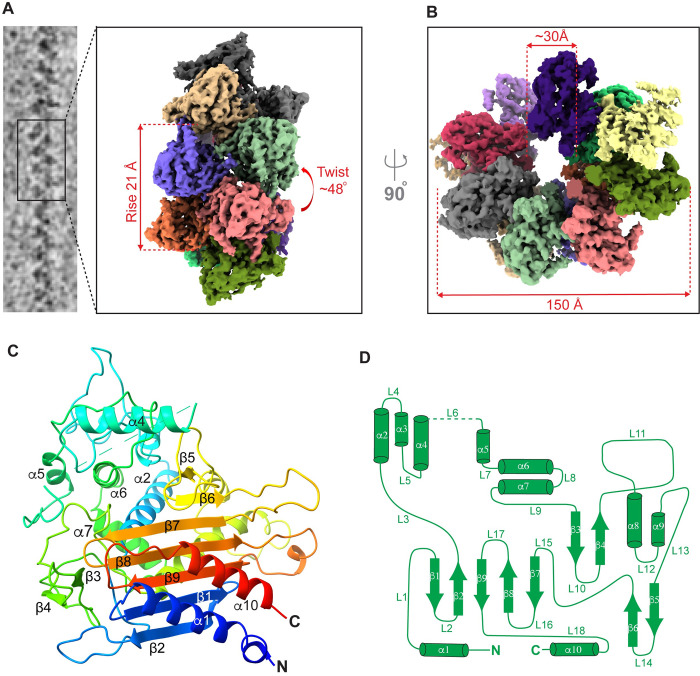
Fig 2 CryoEM structure of human LACTB filament. (A) CryoEM images of helical LACTB filaments were processed to obtain the 3D reconstruction of the polymer. LACTB protomers are colored differently, and filament rise and twist are indicated. (B) Top view of the LACTB assembly with the indicated filament width and inner lumen diameter. (C) Ribbon diagram of LACTB monomer. The chain is colored in a rainbow gradient from N-terminus (blue) to C-terminus (red). Secondary structure elements of one protomer are labeled. (D) LACTB (residues 97 to 547) α-helices (cylinders), β-sheets (arrows), and loops (lines) are depicted in a topology diagram.
Fig 2 CryoEM structure of human LACTB filament. (A) CryoEM images of helical LACTB filaments were processed to obtain the 3D reconstruction of the polymer. LACTB protomers are colored differently, and filament rise and twist are indicated. (B) Top view of the LACTB assembly with the indicated filament width and inner lumen diameter. (C) Ribbon diagram of LACTB monomer. The chain is colored in a rainbow gradient from N-terminus (blue) to C-terminus (red). Secondary structure elements of one protomer are labeled. (D) LACTB (residues 97 to 547) α-helices (cylinders), β-sheets (arrows), and loops (lines) are depicted in a topology diagram.CC BY · PubMed Central
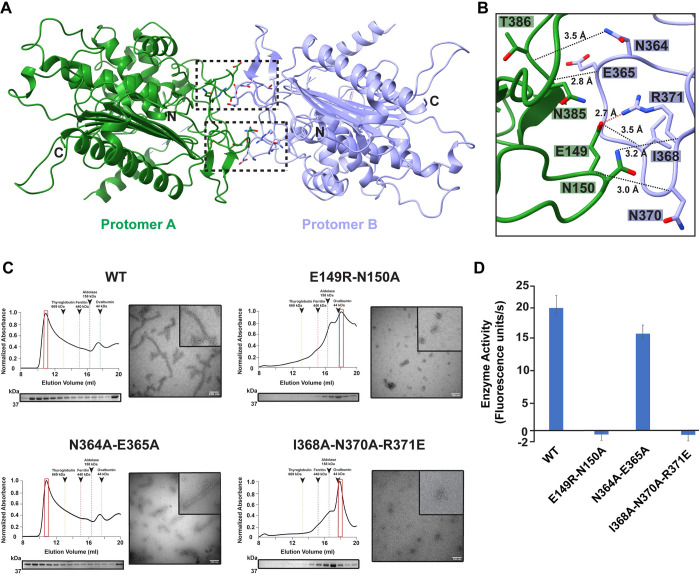
Fig 3 Structural characterization of LACTB dimerization interface. (A) LACTB protomers (colored in green and lilac) form an antiparallel dimer as shown in ribbon representation. Residues that are critical for oligomerization are represented in sticks. Black boxes indicate the position of dimer interface residues. (B) Zoomed in view of the black box in (A), showing the interactions that stabilize the dimer formation. The polar and charge–charge interactions are indicated by black and red dotted lines, respectively. (C) SEC elution profiles of WT and mutant LACTB. SEC elution profiles begin with the void volume (V0) of the column. Fractions were analyzed by SDS-PAGE and peak fractions used in negative-stain TEM analyses are highlighted with red boxes. Negative-stain TEM images demonstrate the polymerization activity of WT and mutant proteins. Scale bars, 100 nm. (D) Mutation of key residues involved in dimerization disrupts catalytic activity. Enzyme activity was determined in vitro by using a fluorescently labeled substrate and 3 independent experiments were performed for each sample. Bars represent the mean of at least 3 independent experiments and error bars represent the standard deviation. The underlying data in (D) is provided in sheet Fig 3D in S1 Data. SEC, size-exclusion chromatography; TEM, transmission electron microscopy; WT, wild-type.
Fig 3 Structural characterization of LACTB dimerization interface. (A) LACTB protomers (colored in green and lilac) form an antiparallel dimer as shown in ribbon representation. Residues that are critical for oligomerization are represented in sticks. Black boxes indicate the position of dimer interface residues. (B) Zoomed in view of the black box in (A), showing the interactions that stabilize the dimer formation. The polar and charge–charge interactions are indicated by black and red dotted lines, respectively. (C) SEC elution profiles of WT and mutant LACTB. SEC elution profiles begin with the void volume (V0) of the column. Fractions were analyzed by SDS-PAGE and peak fractions used in negative-stain TEM analyses are highlighted with red boxes. Negative-stain TEM images demonstrate the polymerization activity of WT and mutant proteins. Scale bars, 100 nm. (D) Mutation of key residues involved in dimerization disrupts catalytic activity. Enzyme activity was determined in vitro by using a fluorescently labeled substrate and 3 independent experiments were performed for each sample. Bars represent the mean of at least 3 independent experiments and error bars represent the standard deviation. The underlying data in (D) is provided in sheet Fig 3D in S1 Data. SEC, size-exclusion chromatography; TEM, transmission electron microscopy; WT, wild-type.CC BY · PubMed Central
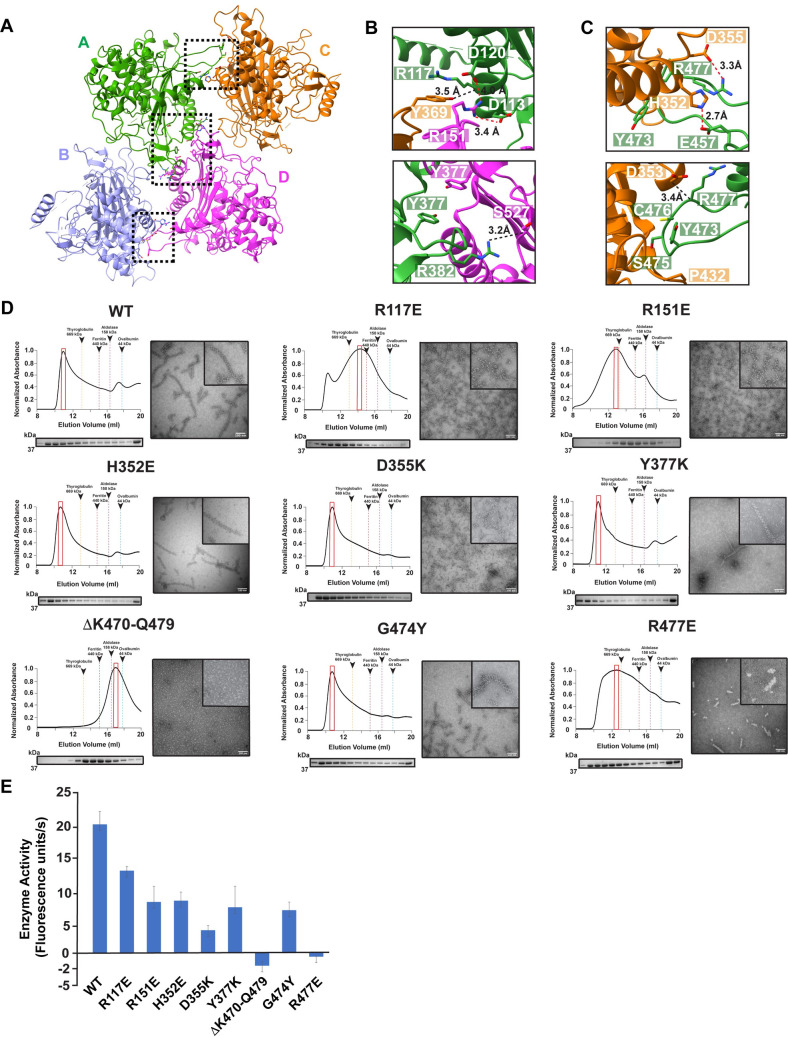
Fig 4 Structural basis of LACTB filament assembly. (A) Ribbon diagram of LACTB tetramer. LACTB protomers are colored in green (A), lilac (B), orange (C), and pink (D). Residues that are critical for oligomerization are represented in sticks. Black boxes indicate the position of the residues located at both polymerization interfaces 1 and 2, respectively. (B and C) Zoomed in view of polymer interfaces 1 and 2, respectively, showing the interactions that facilitate the polymerization of human LACTB. The polar and charge–charge interactions are indicated by black and red dotted lines, respectively. (D) SEC elution profiles of WT and mutant LACTB. SEC elution profiles begin with the void volume (V0) of the column. Mutations to residues that are located at the polymerization interfaces 1 and 2 impair filamentation. Fractions were analyzed by SDS-PAGE and peak fractions used in negative-stain TEM analyses are highlighted with red boxes. Negative-stain TEM images demonstrate the polymerization activity of WT and mutant proteins. Scale bars, 100 nm. (E) Mutation of key residues involved in filament formation disrupts catalytic activity. Enzyme activity was determined in vitro by using a fluorescently labeled substrate and 3 independent experiments were performed for each sample. Bars represent the mean of at least 3 independent experiments and error bars represent the standard deviation. The source data from (E) is provided in sheet Fig 4E in S1 Data. SEC, size-exclusion chromatography; TEM, transmission electron microscopy; WT, wild-type.
Fig 4 Structural basis of LACTB filament assembly. (A) Ribbon diagram of LACTB tetramer. LACTB protomers are colored in green (A), lilac (B), orange (C), and pink (D). Residues that are critical for oligomerization are represented in sticks. Black boxes indicate the position of the residues located at both polymerization interfaces 1 and 2, respectively. (B and C) Zoomed in view of polymer interfaces 1 and 2, respectively, showing the interactions that facilitate the polymerization of human LACTB. The polar and charge–charge interactions are indicated by black and red dotted lines, respectively. (D) SEC elution profiles of WT and mutant LACTB. SEC elution profiles begin with the void volume (V0) of the column. Mutations to residues that are located at the polymerization interfaces 1 and 2 impair filamentation. Fractions were analyzed by SDS-PAGE and peak fractions used in negative-stain TEM analyses are highlighted with red boxes. Negative-stain TEM images demonstrate the polymerization activity of WT and mutant proteins. Scale bars, 100 nm. (E) Mutation of key residues involved in filament formation disrupts catalytic activity. Enzyme activity was determined in vitro by using a fluorescently labeled substrate and 3 independent experiments were performed for each sample. Bars represent the mean of at least 3 independent experiments and error bars represent the standard deviation. The source data from (E) is provided in sheet Fig 4E in S1 Data. SEC, size-exclusion chromatography; TEM, transmission electron microscopy; WT, wild-type.CC BY · PubMed Central
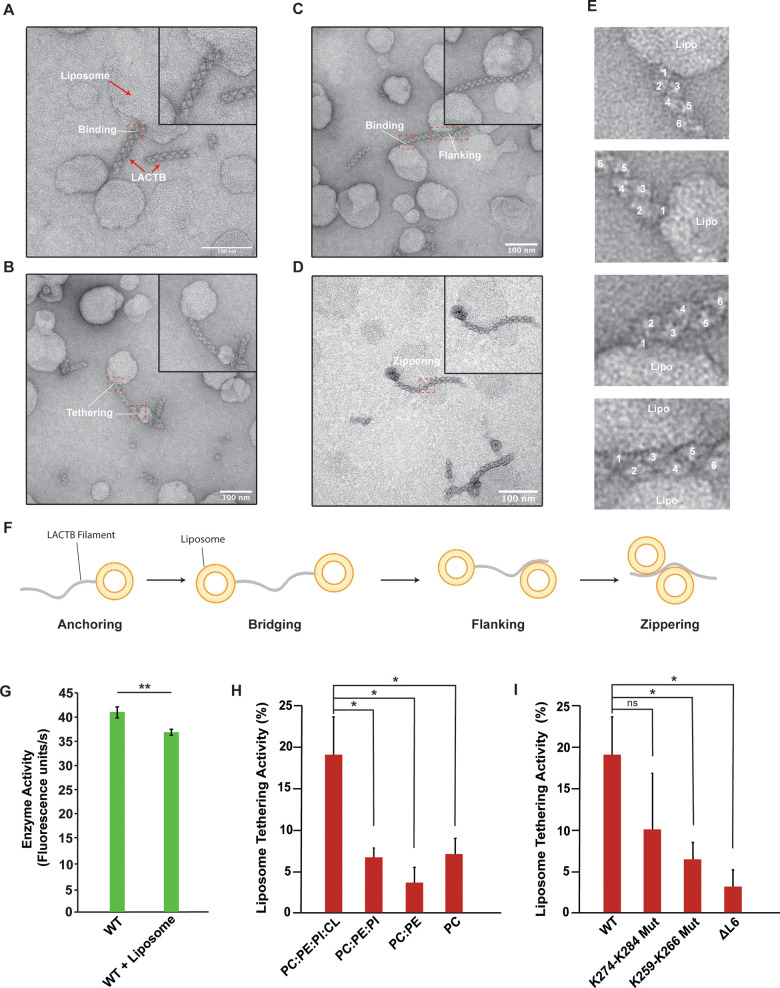
Fig 5 LACTB filaments bind to CL-enriched liposomes. (A–D) Representative negative-stain TEM images of LACTB filaments in the presence of liposomes. Scale bar, 100 nm. Purified LACTB filaments were incubated with CL-containing liposomes at room temperature for 4 h. Red boxes indicate protein–membrane contact sites. (E) Zoomed in views of the red boxes in (A–D), showing the details of protein–liposome interactions. (F) A schematic diagram of filament–liposome interactions illustrating different membrane-binding modes of LACTB filaments. (G) Catalytic activity of WT LACTB in the presence of liposomes. Enzyme activity was determined in vitro by using a fluorescently labeled substrate and 3 independent experiments were performed for each sample. Bars represent the mean of at least 3 independent WT and reconstitution assays. Error bars indicate standard deviation. (H) Liposome tethering activity of WT LACTB under the presence of liposomes of various compositions. Liposome tethering activity was quantified by counting 1,000 filaments from at least 3 independent reconstitution assays and calculating the total percentage of filament tethering. Bars represent the mean liposome tethering activity and error bars indicate SEM. (I) Liposome tethering activity of key residues involved in liposome binding. Liposome tethering activity was quantified by counting 1,000 filaments from at least 3 independent reconstitution assays and calculating the total percentage of filament tethering. Bars represent the mean liposome tethering activity of reconstitution assays and error bars indicate SEM. Statistical analysis was performed with an unpaired two-tailed Student t test (G) and unpaired two-tail Welch’s t tests (H, I). *p < 0.05, **p < 0.005, ns (no significance). The underlying data in (G), (H), and (I) are provided in sheets Fig 5G–5I in S1 Data. CL, cardiolipin; TEM, transmission electron microscopy; WT, wild-type.
Fig 5 LACTB filaments bind to CL-enriched liposomes. (A–D) Representative negative-stain TEM images of LACTB filaments in the presence of liposomes. Scale bar, 100 nm. Purified LACTB filaments were incubated with CL-containing liposomes at room temperature for 4 h. Red boxes indicate protein–membrane contact sites. (E) Zoomed in views of the red boxes in (A–D), showing the details of protein–liposome interactions. (F) A schematic diagram of filament–liposome interactions illustrating different membrane-binding modes of LACTB filaments. (G) Catalytic activity of WT LACTB in the presence of liposomes. Enzyme activity was determined in vitro by using a fluorescently labeled substrate and 3 independent experiments were performed for each sample. Bars represent the mean of at least 3 independent WT and reconstitution assays. Error bars indicate standard deviation. (H) Liposome tethering activity of WT LACTB under the presence of liposomes of various compositions. Liposome tethering activity was quantified by counting 1,000 filaments from at least 3 independent reconstitution assays and calculating the total percentage of filament tethering. Bars represent the mean liposome tethering activity and error bars indicate SEM. (I) Liposome tethering activity of key residues involved in liposome binding. Liposome tethering activity was quantified by counting 1,000 filaments from at least 3 independent reconstitution assays and calculating the total percentage of filament tethering. Bars represent the mean liposome tethering activity of reconstitution assays and error bars indicate SEM. Statistical analysis was performed with an unpaired two-tailed Student t test (G) and unpaired two-tail Welch’s t tests (H, I). *p < 0.05, **p < 0.005, ns (no significance). The underlying data in (G), (H), and (I) are provided in sheets Fig 5G–5I in S1 Data. CL, cardiolipin; TEM, transmission electron microscopy; WT, wild-type.CC BY · PubMed Central
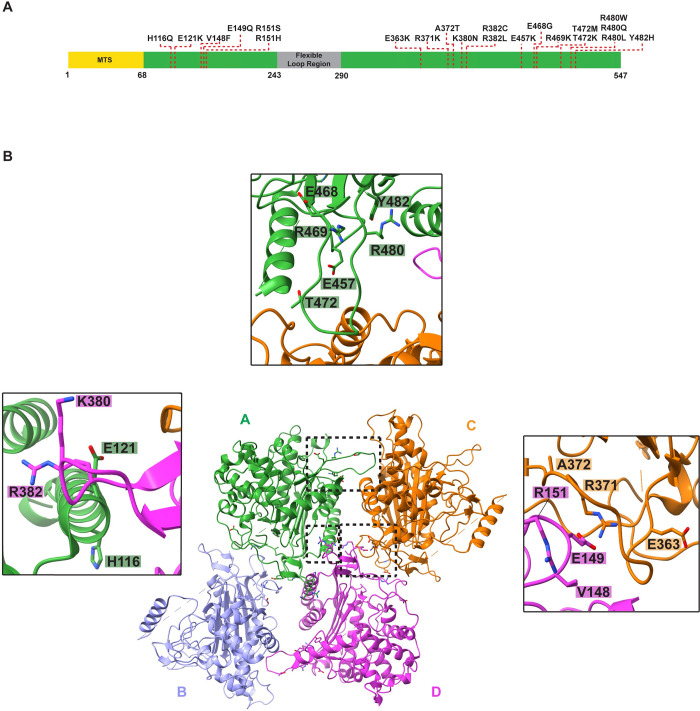
Fig 6 The model of LACTB enables mapping the disease-associated mutations. (A) A schematic representation of full-length LACTB architecture. Residues 1–68 contain the predicted MTS and residues 243–290 form the flexible loop region. Residues that are associated with various human cancers are highlighted with a red dashed line. (B) Ribbon diagram of human LACTB tetramer. Protomers that form the tetramer are labeled A to D and colored as in Fig 4A. Mutations localizing to oligomerization interfaces are illustrated as sticks. Inset windows show the close-up views of oligomerization interfaces containing disease-associated mutations. Black boxes indicate the dimer and polymerization interfaces 1 and 2, respectively. MTS, mitochondrial targeting sequence.
Fig 6 The model of LACTB enables mapping the disease-associated mutations. (A) A schematic representation of full-length LACTB architecture. Residues 1–68 contain the predicted MTS and residues 243–290 form the flexible loop region. Residues that are associated with various human cancers are highlighted with a red dashed line. (B) Ribbon diagram of human LACTB tetramer. Protomers that form the tetramer are labeled A to D and colored as in Fig 4A. Mutations localizing to oligomerization interfaces are illustrated as sticks. Inset windows show the close-up views of oligomerization interfaces containing disease-associated mutations. Black boxes indicate the dimer and polymerization interfaces 1 and 2, respectively. MTS, mitochondrial targeting sequence.CC BY · PubMed Central

Verification

Claims the paper makes

The claims and statistics of this paper haven’t been checked yet.

Run the check — free, no account needed. It reads the open-access text and checks the sources it cites.

A few free checks a day · papers already verified open instantly · results are public

Self-check

Percentages, sums and reported differences re-computed from the paper’s own numbers.

The self-check needs the paper’s full text.

Citations

Cites

Show all 1 references

Research works printed but not linked: 86

  1. 10.1126/science.aax3768 · DOI
  2. 10.1038/s41556-018-0124-1 · DOI · Paper page
  3. 10.1016/j.tibs.2021.06.003 · DOI
  4. 10.1038/nature12985 · DOI · Paper page
  5. 10.1146/annurev-pathmechdis-012419-032711 · DOI · Paper page
  6. 10.1038/s41556-018-0133-0 · DOI · Paper page
  7. 10.1007/s10545-014-9748-x · DOI
  8. 10.1016/j.tibs.2017.06.008 · DOI
  9. 10.1016/j.molcel.2022.10.003 · DOI
  10. 10.1016/j.bbalip.2016.06.015 · DOI
  11. 10.1002/1873-3468.12887 · DOI
  12. 10.1074/jbc.M506510200 · DOI
  13. 10.1038/s41467-019-9425-1 · DOI
  14. 10.1074/jbc.M112.434183 · DOI
  15. 10.1016/j.cmet.2019.11.010 · DOI · Paper page
  16. 10.1016/j.cell.2016.07.002 · DOI · Paper page
  17. 10.1038/cr.2017.155 · DOI
  18. 10.1126/science.1232044 · DOI · Paper page
  19. 10.1016/j.molcel.2022.03.011 · DOI
  20. 10.1038/nature21408 · DOI
  21. 10.1073/pnas.0906734106 · DOI
  22. 10.1016/j.molcel.2014.06.003 · DOI · Paper page
  23. 10.1006/geno.2001.6643 · DOI
  24. 10.1016/j.canlet.2021.02.022 · DOI
  25. 10.2147/cmar.s250661 · DOI
  26. 10.3727/096504017X15030178624579 · DOI
  27. 10.1038/s41388-018-0352-7 · DOI
  28. 10.1002/cam4.1576 · DOI
  29. 10.2147/IJN.S331519 · DOI
  30. 10.3389/fphys.2017.00396 · DOI
  31. 10.1074/jbc.M112.399428 · DOI
  32. 10.1007/s00109-014-1237-z · DOI
  33. 10.1016/j.cell.2008.06.016 · DOI · Paper page
  34. 10.1038/nature06757 · DOI · Paper page
  35. 10.1038/ng.325 · DOI · Paper page
  36. 10.1016/j.celrep.2021.109180 · DOI
  37. 10.1186/1471-2148-8-26 · DOI
  38. 10.1038/nsmb.3407 · DOI
  39. 10.1038/s41594-019-0352-5 · DOI
  40. 10.1073/pnas.2107968118 · DOI
  41. 10.7554/eLife.53243 · DOI
  42. 10.1038/s41586-018-0201-4 · DOI · Paper page
  43. 10.1038/s41467-019-12427-8 · DOI
  44. 10.1083/jcb.201701084 · DOI
  45. 10.7554/eLife.02409 · DOI
  46. 10.1016/j.molcel.2012.09.025 · DOI · Paper page
  47. 10.1203/PDR.0b013e3181a9eafb · DOI
  48. 10.1016/S0006-3495(95)80142-6 · DOI
  49. 10.1038/embor.2012.128 · DOI
  50. 10.1126/scisignal.2004374 · DOI
  51. 10.1016/j.jmb.2019.01.039 · DOI
  52. 10.1038/s41586-020-2308-7 · DOI · Paper page
  53. 10.1093/nar/gky1015 · DOI · Paper page
  54. 10.1007/s12551-019-00602-6 · DOI
  55. 10.1016/j.ceb.2020.04.006 · DOI
  56. 10.3109/10409238.2016.1172555 · DOI
  57. 10.1091/mbc.E18-10-0675 · DOI
  58. 10.1016/j.str.2019.08.001 · DOI
  59. 10.1128/JVI.01647-18 · DOI
  60. 10.1016/S0959-440X(03)00027-7 · DOI
  61. 10.1038/s41594-021-00706-2 · DOI
  62. 10.7554/eLife.63349 · DOI
  63. 10.1006/jsbi.1997.3885 · DOI
  64. 10.1073/pnas.1801252115 · DOI
  65. 10.1073/pnas.1816317116 · DOI
  66. 10.1016/j.str.2022.02.007 · DOI
  67. 10.3791/3227 · DOI
  68. 10.1016/j.jsb.2005.07.007 · DOI
  69. 10.1038/nmeth.4193 · DOI
  70. 10.1016/j.jsb.2015.08.008 · DOI
  71. 10.7554/eLife.42166 · DOI
  72. 10.1016/j.jsb.2017.02.003 · DOI
  73. 10.1038/nmeth.2727 · DOI
  74. 10.1002/jcc.20084 · DOI
  75. 10.1107/S2059798319011471 · DOI · Paper page
  76. 10.1107/S0907444910007493 · DOI · Paper page
  77. 10.1002/pro.3330 · DOI · Paper page
  78. 10.1002/pro.3943 · DOI
  79. 10.1038/nmeth.2019 · DOI · Paper page
  80. 10.1002/pro.3280 · DOI
  81. 10.1016/j.jmb.2007.05.022 · DOI
  82. 10.1093/nar/gkq366 · DOI · Paper page
  83. 10.1093/nar/gkr393 · DOI
  84. 10.1038/msb.2011.75 · DOI
  85. 10.1093/nar/gku316 · DOI · Paper page
  86. 10.1016/S0021-9258(17)30583-5 · DOI

Metadata

Authors
Bennett, J. A., Steward, L. R., Rudolph, J., Voss, A. P., & Aydin, H.
Affiliations
University of Colorado Boulder (US)
Corresponding author
Aydin, Halil
Venue
PLoS Biology
Publisher
openRxiv
Published
2022-04-22
Volume
20
Issue
12
Pages
e3001899-e3001899
ISSN
1544-9173 (ISSN-L)
OpenAlex
W4311911807
Cited by
16
References
1
Citations by year
2026: 6 · 2025: 5 · 2024: 3 · 2023: 1 · 2022: 1
FWCI
0.82
Type
journal article
Language
en
Open access
Licence
cc-by
Locations
  • PLoS Biology (publishedVersion, cc-by)
  • bioRxiv (Cold Spring Harbor Laboratory) (acceptedVersion, cc-by-nd)
  • PubMed Central (publishedVersion, cc-by)
  • PubMed (publishedVersion)
  • CU Scholar (University of Colorado Boulder) (submittedVersion, cc-by)
  • DOAJ (DOAJ: Directory of Open Access Journals) (submittedVersion)
Funders
  • Ministry of Education, India
  • National Institutes of Health (1s10od025267-01, SCR_018986)
  • University of Colorado Boulder (SCR_018986)
  • National Institute of General Medical Sciences (T32GM145437)
  • National Center for Research Resources (S10RR026641)
Topics
  • Life Sciences › Biochemistry, Genetics and Molecular Biology › Molecular Biology › Mitochondrial Function and Pathology
  • Life Sciences › Biochemistry, Genetics and Molecular Biology › Structural Biology › Enzyme Structure and Function
  • Life Sciences › Biochemistry, Genetics and Molecular Biology › Structural Biology › Advanced Electron Microscopy Techniques and Applications
Keywords
LACTB, mitochondrial intermembrane space, protein filament assembly, membrane binding, mitochondrial lipid metabolism, tumor cell proliferation, enzyme activity
MeSH terms
Animals, beta-Lactamases, Cytoskeleton, Humans, Mammals, Membrane Proteins, Mitochondria, Neoplasms, Cryoelectron Microscopy, Mitochondrial Proteins

About these checks

Registry, retraction, Cites and statistics results are computed, not judged, with one exception: a printed reference that no index lists is read once by a model before it counts as a citation error. Claims are extracted by a model and kept only when their quote appears verbatim in the text; each cited source is then checked, with a model’s help, for whether it says what the claim relies on. Those verdicts can be wrong — read the claim’s quote and the cited source before relying on one.

Statistics and arithmetic are recomputed, not judged.

Confidence bands are shown only for fields calibrated on our annotated test set. None is calibrated yet, so no band is shown.

What counts as a claim ›How we measure confidence ›How we check this ›

Are you an author, or do you see a problem with this page? Request a review

How to cite

Cite CoChat for the checks on this page, and the paper for its own findings.

This page
CoChat. (2026). Citation check: The structure of the human LACTB filament reveals the mechanisms of assembly and membrane binding. https://app.cochat.ai/papers/10.1101/2022.04.21.489104
The paper
Bennett, J. A., Steward, L. R., Rudolph, J., Voss, A. P., & Aydin, H. (2022). The structure of the human LACTB filament reveals the mechanisms of assembly and membrane binding. PLoS Biology. https://doi.org/10.1101/2022.04.21.489104