PreprintCited by 3Circadian rhythm and melatoninPlant Molecular Biology ResearchEvolution and Genetic Dynamics

The DOI matches its Crossref record; 1 of the 1 references it cites were found in a registry or an index.

Dominant constraints on the evolution of rhythmic gene expression

Open access
Cheng, Yang, Chi, Yuhao, Sun, Linying, Wang, Guang-Zhong·2022·Computational and Structural Biotechnology Journal

Preprint — published as 10.1016/j.csbj.2023.08.035 · Paper page

Abstract

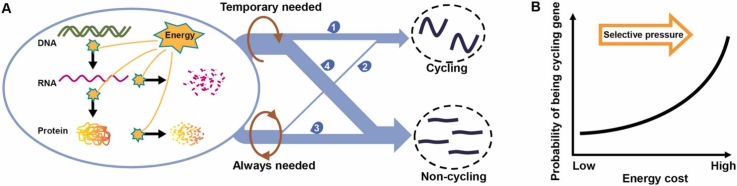
Although the individual transcriptional regulators of the core circadian clock are distinct amongst different organisms, the autoregulatory feedback loops they form are conserved. This unified design principle explains how daily physiological activities oscillate across species. However, whether analogous design principles govern the gene expression output of circadian clocks is unknown. Herein, we performed a comparative analysis of rhythmic gene expression in eight diverse species and captured four common distribution patterns of cycling gene expression across these species. We hypothesized that maintenance of reduced energetic costs constrains the evolution of rhythmic gene expression. Our large-scale computational simulations support this hypothesis by showing that selection against high-energy expenditure completely regenerates all cycling gene patterns. Moreover, we find that the late- and early-phase peaks of rhythmic expression have been subjected to this type of selective pressure. Therefore, energetic costs have constricted the cycling transcriptome throughout evolutionary history.

Overview

The claims and statistics of this paper haven’t been checked yet.

Run the check — free, no account needed. It reads the open-access text and checks the sources it cites.

A few free checks a day · papers already verified open instantly · results are public

Integrity signals

Registry

Crossref · 10.1101/2022.06.14.496129

Cites

1 of 1 references verified0 citation errors · 0 not checkable

Statistics

Figures

Graphical abstract
Graphical abstract CC BY-NC-ND · PubMed Central
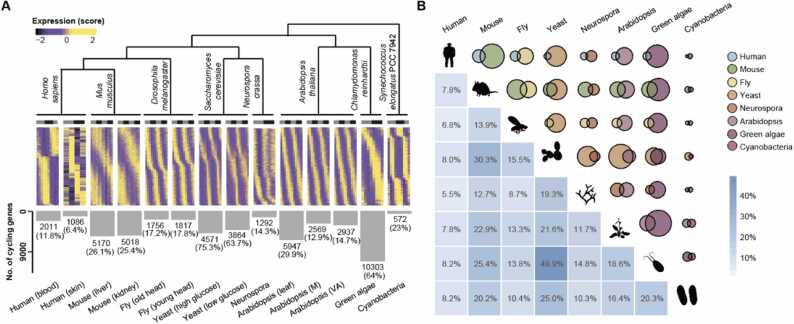
Fig. 1 Cycling gene expression in 8 species. (A) Heatmaps of rhythmic gene expression in eight species, including Homo sapiens, Mus musculus, Drosophila melanogaster, Saccharomyces cerevisiae, Neurospora crassa, Arabidopsis thaliana, Chlamydomonas reinhardtii and Synechococus elongates. The number and proportion of identified cycling genes in each transcriptome are indicated near the bottom of the panel. Cycling genes were identified by MetaCycle with adjusted p values < 0.05 after a Benjamini-Hochberg procedure. (B) Venn diagrams displaying the intersection of cycling genes between any two species. Different colors represent different species, while the size of the circle indicates the number of cycling genes identified. The proportion of the overlaps are indicated below, with higher percentages highlighted by a darker color. Average values were used for species with two or more associated tissues/conditions.
Fig. 1 Cycling gene expression in 8 species. (A) Heatmaps of rhythmic gene expression in eight species, including Homo sapiens, Mus musculus, Drosophila melanogaster, Saccharomyces cerevisiae, Neurospora crassa, Arabidopsis thaliana, Chlamydomonas reinhardtii and Synechococus elongates. The number and proportion of identified cycling genes in each transcriptome are indicated near the bottom of the panel. Cycling genes were identified by MetaCycle with adjusted p values < 0.05 after a Benjamini-Hochberg procedure. (B) Venn diagrams displaying the intersection of cycling genes between any two species. Different colors represent different species, while the size of the circle indicates the number of cycling genes identified. The proportion of the overlaps are indicated below, with higher percentages highlighted by a darker color. Average values were used for species with two or more associated tissues/conditions.CC BY-NC-ND · PubMed Central
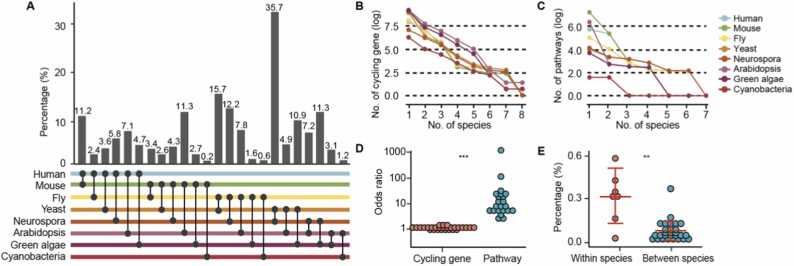
Fig. 2 Functional enrichment analysis of cycling genes across species. (A) The proportion of conserved pathways between any species pair. Bar plots represent the proportion of conserved pathways, which were calculated by the number of shared enriched pathways divided by the total number of enriched pathways between the two species. Different species are labeled by distinct colors and detailed comparison information is highlighted below the panel. (B) The trends of shared cycling genes across species. As more species are included, the number of shared cycling genes drops significantly. Lines of different colors represent distinct species and values obtained after logarithmic transformation are shown. (C) The trends of shared functional pathways of cycling genes across species. Only enriched pathways are included in the plot. The number of shared enriched pathways of cycling genes drops significantly as more species are considered. Lines of different colors represent distinct species and values obtained after logarithmic transformation are shown for the number of enriched pathways. (D) Dot plot showing the comparison of shared cycling genes versus their enriched pathways across species. Odds ratio of both shared cycling genes and shared pathways between species pairs are plotted, and statistical significance was determined by a Wilcoxon rank sum test (*** indicates p < 0.001). Odds ratio was determined by Fisher’s Exact Test. (E) Dot plot showing the comparison of conserved enriched pathways between and within species. Proportion of conserved enriched pathways is plotted and significance levels were determined by a Wilcoxon rank sum test (** indicates p < 0.01).
Fig. 2 Functional enrichment analysis of cycling genes across species. (A) The proportion of conserved pathways between any species pair. Bar plots represent the proportion of conserved pathways, which were calculated by the number of shared enriched pathways divided by the total number of enriched pathways between the two species. Different species are labeled by distinct colors and detailed comparison information is highlighted below the panel. (B) The trends of shared cycling genes across species. As more species are included, the number of shared cycling genes drops significantly. Lines of different colors represent distinct species and values obtained after logarithmic transformation are shown. (C) The trends of shared functional pathways of cycling genes across species. Only enriched pathways are included in the plot. The number of shared enriched pathways of cycling genes drops significantly as more species are considered. Lines of different colors represent distinct species and values obtained after logarithmic transformation are shown for the number of enriched pathways. (D) Dot plot showing the comparison of shared cycling genes versus their enriched pathways across species. Odds ratio of both shared cycling genes and shared pathways between species pairs are plotted, and statistical significance was determined by a Wilcoxon rank sum test (*** indicates p < 0.001). Odds ratio was determined by Fisher’s Exact Test. (E) Dot plot showing the comparison of conserved enriched pathways between and within species. Proportion of conserved enriched pathways is plotted and significance levels were determined by a Wilcoxon rank sum test (** indicates p < 0.01).CC BY-NC-ND · PubMed Central
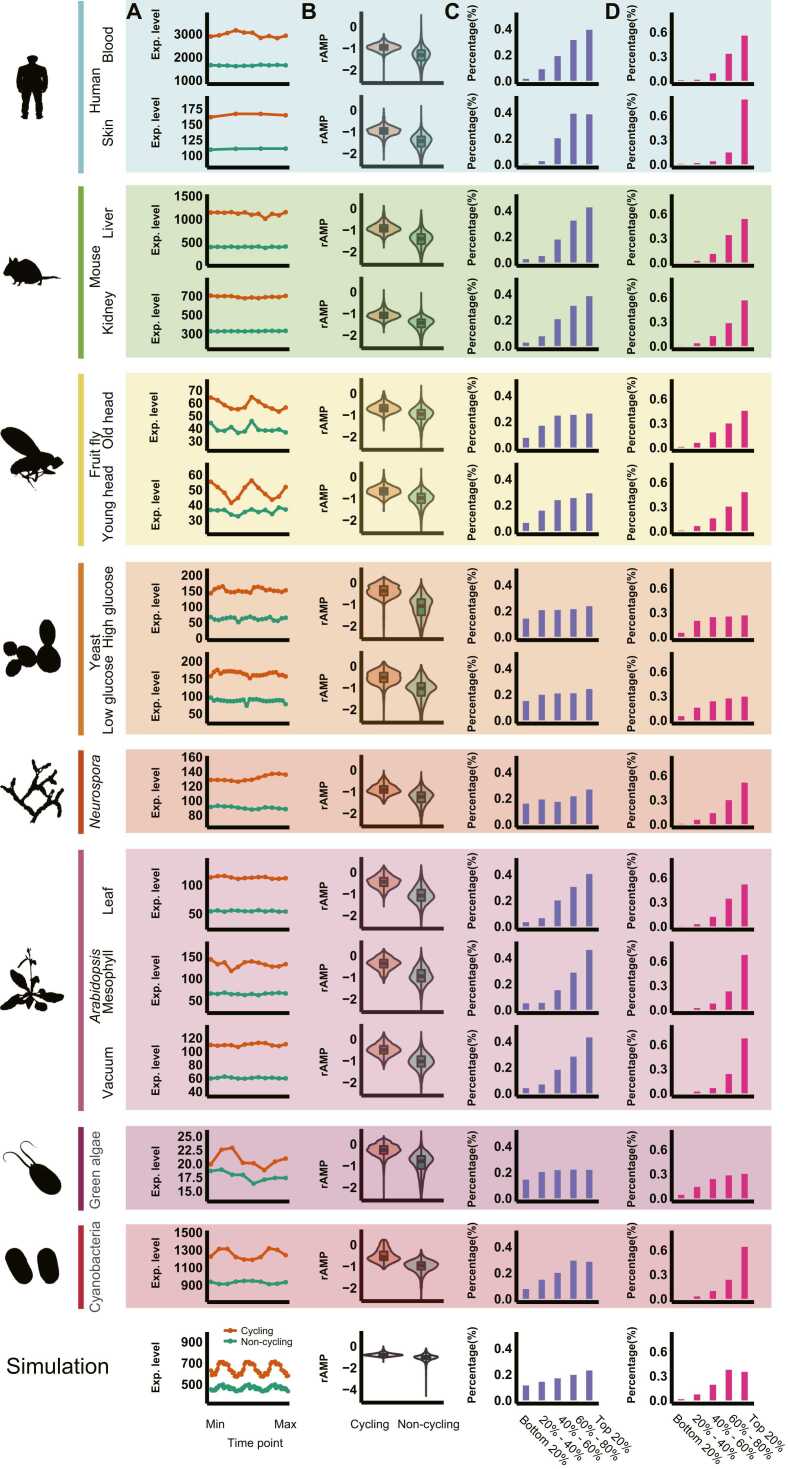
Fig. 3 Conserved distribution patterns of cycling genes across species. (A) Mean expression levels of cycling genes versus other genes for each time point. Red lines represent cycling genes while green lines represent non-cycling genes in each plot. p values < 0.005 for all comparisons between the expression of cycling genes with other genes for each time point (total of 244 comparisons), Wilcoxon rank sum test. (B) Violin plots showing comparisons of rAMP between cycling genes and other non-cycling genes. Red boxes represent cycling genes while green boxes represent non-cycling genes. p < 7.046 × 10−190 in each of the 15 comparisons, Wilcoxon rank sum test. (C-D) Proportions of cycling genes in each category grouped by mean expression level (C) and rAMP. (D). Five groups were calculated, from the bottom 20% to the top 20%. Percentages were calculated as the number of cycling genes in that group divided by the total number of cycling genes identified in the cycling transcriptome of each species. Logarithmic values for both of the parameters are shown.
Fig. 3 Conserved distribution patterns of cycling genes across species. (A) Mean expression levels of cycling genes versus other genes for each time point. Red lines represent cycling genes while green lines represent non-cycling genes in each plot. p values < 0.005 for all comparisons between the expression of cycling genes with other genes for each time point (total of 244 comparisons), Wilcoxon rank sum test. (B) Violin plots showing comparisons of rAMP between cycling genes and other non-cycling genes. Red boxes represent cycling genes while green boxes represent non-cycling genes. p < 7.046 × 10−190 in each of the 15 comparisons, Wilcoxon rank sum test. (C-D) Proportions of cycling genes in each category grouped by mean expression level (C) and rAMP. (D). Five groups were calculated, from the bottom 20% to the top 20%. Percentages were calculated as the number of cycling genes in that group divided by the total number of cycling genes identified in the cycling transcriptome of each species. Logarithmic values for both of the parameters are shown.CC BY-NC-ND · PubMed Central
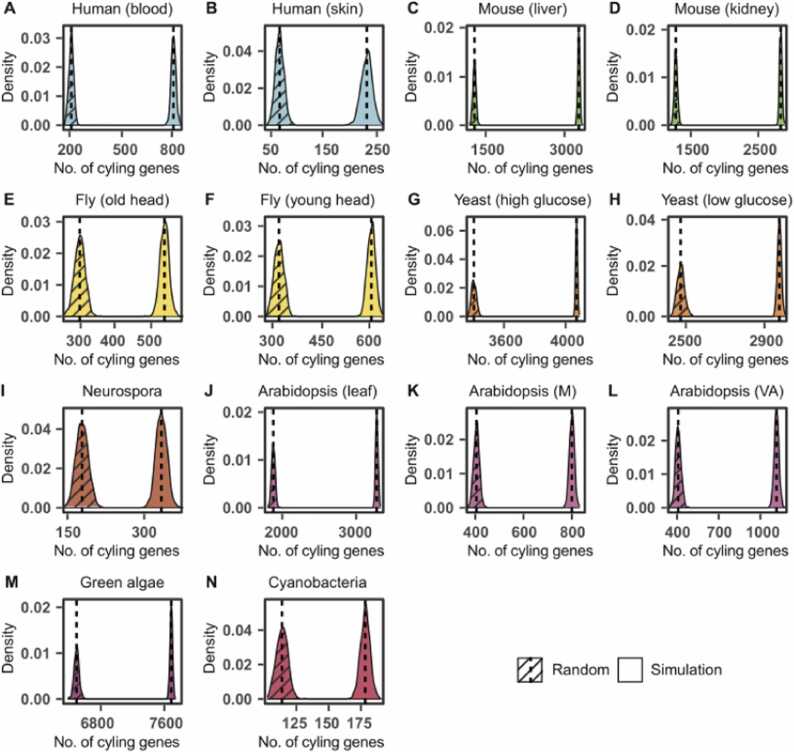
Fig. 4 Prediction of cycling genes based on expression level and rAMP. Results are plotted for all species (A-N), with controls indicated by slashes. Controls were defined as predictions of cycling genes without considerations for expression levels or regulation ranges. Different species are distinguished by different colors and 1000 simulations were performed for each distribution curve. Vertical lines represent the means of each distribution peak.
Fig. 4 Prediction of cycling genes based on expression level and rAMP. Results are plotted for all species (A-N), with controls indicated by slashes. Controls were defined as predictions of cycling genes without considerations for expression levels or regulation ranges. Different species are distinguished by different colors and 1000 simulations were performed for each distribution curve. Vertical lines represent the means of each distribution peak.CC BY-NC-ND · PubMed Central
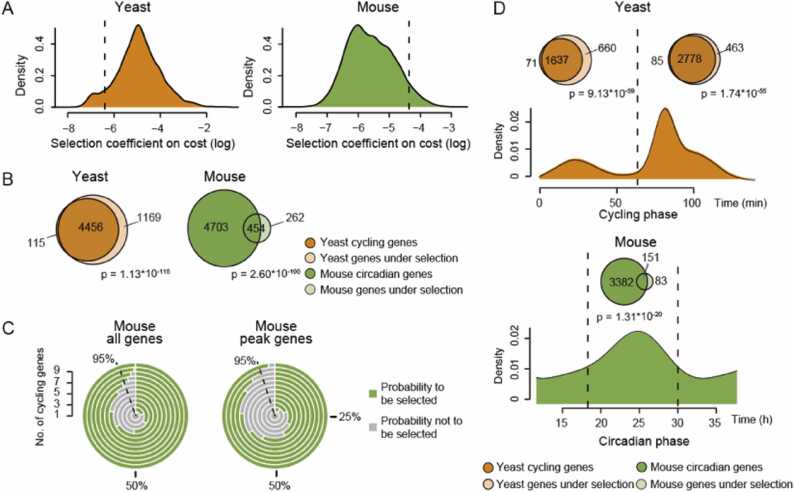
Fig. 5 Energy cost constrains the cycling transcriptomes of yeast and mice. (A) Distribution of fractional cost for each gene in the cycling transcriptome of yeast and mice. Vertical lines represent the threshold for selection, which was determined by the effective population size. (B) Venn diagrams illustrate the intersection between cycling genes and genes whose expression passed the cost selection threshold in yeast and mice. Odds ratio = 10.87 and 5.23 for yeast and mice, respectively. (C) Radial bar chart visualization on the selection of co-expressed genes. Equal or greater than 95% chance to be under selection is indicated by a dash line. (D) Enrichment of cost-selected genes in both the early and late circadian expression peaks. Venn diagrams showing the overlaps between cost-selected genes and cycling genes whose phase is located in either the early or late peak. Odds ratio = 8.17 and 9.87 for yeast early and late peaks, respectively; Odds ratio = 7.04 and 3.06 for mouse early and late peaks, respectively. Fisher’s exact tests were used to determine significance levels for each enrichment.
Fig. 5 Energy cost constrains the cycling transcriptomes of yeast and mice. (A) Distribution of fractional cost for each gene in the cycling transcriptome of yeast and mice. Vertical lines represent the threshold for selection, which was determined by the effective population size. (B) Venn diagrams illustrate the intersection between cycling genes and genes whose expression passed the cost selection threshold in yeast and mice. Odds ratio = 10.87 and 5.23 for yeast and mice, respectively. (C) Radial bar chart visualization on the selection of co-expressed genes. Equal or greater than 95% chance to be under selection is indicated by a dash line. (D) Enrichment of cost-selected genes in both the early and late circadian expression peaks. Venn diagrams showing the overlaps between cost-selected genes and cycling genes whose phase is located in either the early or late peak. Odds ratio = 8.17 and 9.87 for yeast early and late peaks, respectively; Odds ratio = 7.04 and 3.06 for mouse early and late peaks, respectively. Fisher’s exact tests were used to determine significance levels for each enrichment.CC BY-NC-ND · PubMed Central

Verification

Claims the paper makes

The claims and statistics of this paper haven’t been checked yet.

Run the check — free, no account needed. It reads the open-access text and checks the sources it cites.

A few free checks a day · papers already verified open instantly · results are public

Self-check

Percentages, sums and reported differences re-computed from the paper’s own numbers.

The self-check needs the paper’s full text.

Citations

Cites

Research works printed but not linked: 66

  1. 10.1038/nrg.2016.150 · DOI
  2. 10.1101/sqb.2015.80.027490 · DOI
  3. 10.1146/annurev-genet-102209-163432 · DOI
  4. 2015, TRP channels: a missing bond in the entrainment mechanism of peripheral clocks throughout evolution, Temperature (Austin, 2, 522, 10.1080/23328940.2015.1115803 · DOI
  5. 10.1038/nrg1633 · DOI
  6. 10.1038/35088576 · DOI
  7. 10.1016/S0092-8674(00)80245-7 · DOI · Paper page
  8. 10.1126/science.1107373 · DOI
  9. 10.1016/S0092-8674(03)00074-6 · DOI
  10. Allada, R. , White, N. E. , So, W. V. , Hall, J. C. & Rosbash, M . A mutant Drosophila homolog of mammalian Clock disrupts circadian rhythms and transcription of period and timeless. Cell 93 (1998). · DOI
  11. 10.1126/science.281.5382.1519 · DOI
  12. 10.1126/science.1102540 · DOI · Paper page
  13. 10.1126/science.1061320 · DOI
  14. 10.1016/S0092-8674(00)81464-6 · DOI
  15. 10.1016/j.cub.2012.07.025 · DOI
  16. Boothroyd, C. E. & Young, M. W . The in(put)s and out(put)s of the Drosophila circadian clock. Ann. N. Y. Acad. Sci. 1129, 350–357 (2008). · DOI
  17. 10.1016/S0092-8674(02)00722-5 · DOI
  18. 10.1073/pnas.1408886111 · DOI · Paper page
  19. 10.1126/science.aao0318 · DOI
  20. 2019, BMAL1-Driven Tissue Clocks Respond Independently to Light to Maintain Homeostasis, Cell, 177, 1436, 10.1016/j.cell.2019.05.009 · DOI
  21. 10.1016/j.cell.2017.07.035 · DOI
  22. 10.1073/pnas.0909591106 · DOI · Paper page
  23. Weger, B. D. et al. Systematic analysis of differential rhythmic liver gene expression mediated by the circadian clock and feeding rhythms. Proc. Natl Acad. Sci. USA 118 (2021). · DOI
  24. 10.1126/science.1256682 · DOI · Paper page
  25. 10.1101/gr.128876.111 · DOI
  26. 10.1073/pnas.1217154110 · DOI · Paper page
  27. Wu, G. et al. Population-level rhythms in human skin with implications for circadian medicine. Proc. Natl. Acad. Sci. USA 115 (2018). · DOI
  28. 10.1038/ncomms14529 · DOI
  29. 2015, Cycling Transcriptional Networks Optimize Energy Utilization on a Genome Scale, Cell Rep, 13, 1868, 10.1016/j.celrep.2015.10.043 · DOI
  30. 10.1073/pnas.1418963111 · DOI
  31. 10.1038/nature13919 · DOI
  32. 2014, Prevalence, evolution, and cis-regulation of diel transcription in Chlamydomonas reinhardtii, G3 (Bethesda), 4, 2461, 10.1534/g3.114.015032 · DOI
  33. 10.1073/pnas.0902587106 · DOI
  34. 10.1093/bioinformatics/btw405 · DOI
  35. 10.1038/75556 · DOI · Paper page
  36. 10.1093/nar/gkaa1113 · DOI · Paper page
  37. 10.1093/nar/gky1038 · DOI
  38. Cheng, Y. , Chi, Y. , Zhang, L. & Wang, G. Z . A single factor dominates the behavior of rhythmic genes in mouse organs. BMC Genomics 20, 879 (2019). · DOI
  39. 10.1038/nature11088 · DOI
  40. Hartl, D. L. , Clark, A. G. & Clark, A. G. Principles of population genetics. Vol. 116 (Sinauer associates Sunderland, MA, 1997).
  41. 10.1093/molbev/msi126 · DOI · Paper page
  42. 10.1073/pnas.1514974112 · DOI · Paper page
  43. 2016, Robotic Nudges: The Ethics of Engineering a More Socially Just Human Being, Science and Engineering Ethics, 22, 31, 10.1007/s11948-015-9636-2 · DOI
  44. Wagner, A . Energy costs constrain the evolution of gene expression. J Exp Zool B Mol. Dev. Evol. 308, 322–324. · DOI
  45. 10.1101/gr.195404.115 · DOI
  46. 10.1093/molbev/mss105 · DOI
  47. 2017, Circadian Reprogramming in the Liver Identifies Metabolic Pathways of Aging, Cell, 170, 664, 10.1016/j.cell.2017.07.042 · DOI
  48. 2000, Fisher, Medawar, Hamilton and the evolution of aging, Genetics, 156, 927, 10.1093/genetics/156.3.927 · DOI · Paper page
  49. 10.1038/35041682 · DOI · Paper page
  50. 2017, Keeping the Rhythm while Changing the Lyrics: Circadian Biology in Aging, Cell, 170, 599, 10.1016/j.cell.2017.07.039 · DOI
  51. 10.1371/journal.pbio.1000062 · DOI
  52. 10.1126/science.1226339 · DOI · Paper page
  53. 10.1016/j.cmet.2012.11.004 · DOI
  54. 10.1038/ng940 · DOI
  55. 10.1101/gr.1649303 · DOI
  56. 10.1101/gr.641103 · DOI
  57. 10.1016/j.cell.2017.04.015 · DOI
  58. 10.1186/s13059-015-0721-2 · DOI · Paper page
  59. 10.1186/s13059-019-1832-y · DOI · Paper page
  60. 10.1038/nprot.2013.092 · DOI
  61. 2019, Simphony: simulating large-scale, rhythmic data, PeerJ, 7, e6985, 10.7717/peerj.6985 · DOI
  62. 10.1073/pnas.0605420103 · DOI · Paper page
  63. 10.1038/msb.2010.112 · DOI
  64. Gerashchenko, M. V. , Peterfi, Z. , Yim, S. H. & Gladyshev, V. N . Translation elongation rate varies among organs and decreases with age. Nucleic Acids Res. 49, e9 (2021). · DOI · Paper page
  65. 10.1038/nature02046 · DOI · Paper page
  66. 10.1126/science.1158441 · DOI · Paper page

Metadata

Authors
Cheng, Y., Chi, Y., Sun, L., & Wang, G.-Z.
Affiliations
Shanghai Institute of Nutrition and Health (CN)
Corresponding author
Wang, Guang-Zhong
Venue
Computational and Structural Biotechnology Journal
Publisher
openRxiv
Published
2022-06-15
Volume
21
Pages
4301-4311
ISSN
2001-0370 (ISSN-L)
OpenAlex
W4386385534
Cited by
3
References
1
Citations by year
2025: 3
FWCI
0.45
Type
journal article
Language
en
Open access
Licence
cc-by-nc-nd
Locations
  • Computational and Structural Biotechnology Journal (publishedVersion, cc-by-nc-nd)
  • bioRxiv (Cold Spring Harbor Laboratory) (acceptedVersion, cc-by-nc-nd)
  • PubMed Central (publishedVersion, cc-by-nc-nd)
  • PubMed (publishedVersion)
  • DOAJ (DOAJ: Directory of Open Access Journals) (submittedVersion, cc-by-sa)
Funders
  • National Natural Science Foundation of China (81827901, 2017SHZDZX01, 31600960, 31871333)
  • Shanghai Institutes for Biological Sciences, Chinese Academy of Sciences
  • Science and Technology Commission of Shanghai Municipality (2017SHZDZX01)
Topics
  • Life Sciences › Neuroscience › Endocrine and Autonomic Systems › Circadian rhythm and melatonin
  • Life Sciences › Agricultural and Biological Sciences › Plant Science › Plant Molecular Biology Research
  • Life Sciences › Biochemistry, Genetics and Molecular Biology › Genetics › Evolution and Genetic Dynamics
Keywords
circadian clock, rhythmic gene expression, evolutionary constraints, energetic cost, transcriptional regulation, autoregulatory loop, comparative genomics, selection pressure, transcriptome

About these checks

Registry, retraction, Cites and statistics results are computed, not judged, with one exception: a printed reference that no index lists is read once by a model before it counts as a citation error. Claims are extracted by a model and kept only when their quote appears verbatim in the text; each cited source is then checked, with a model’s help, for whether it says what the claim relies on. Those verdicts can be wrong — read the claim’s quote and the cited source before relying on one.

Statistics and arithmetic are recomputed, not judged.

Confidence bands are shown only for fields calibrated on our annotated test set. None is calibrated yet, so no band is shown.

What counts as a claim ›How we measure confidence ›How we check this ›

Are you an author, or do you see a problem with this page? Request a review