PreprintCited by 12Ion channel regulation and functionIon Channels and ReceptorsNicotinic Acetylcholine Receptors Study

The DOI matches its Crossref record; 2 of the 2 references it cites were found in a registry or an index.

Structural basis for excitatory neuropeptide signaling

Open access
Kalienkova, Valeria, Dandamudi, Mowgli, Paulino, Cristina, Lynagh, Timothy·2023·Nature Structural & Molecular Biology

Preprint — published as 10.1038/s41594-023-01198-y · Paper page

Abstract

Rapid chemo-electric signaling between neurons is mediated by ligand-gated ion channels, cell-surface proteins with an extracellular ligand-binding domain and a membrane-spanning ion channel domain 1 . The degenerin/epithelial sodium channel (DEG/ENaC) superfamily, which occurs throughout the animal kingdom, is unique in its diversity of gating stimuli, with some DEG/ENaCs gated by conventional ligands such as neuropeptides, and others gated by e.g. pH, mechanical force, or enzymatic activity 2-5 . The mechanism by which ligands bind to and activate DEG/ENaCs is poorly understood. We have therefore dissected the structural basis for neuropeptide binding and gating in a neuropeptide-gated DEG/ENaC, FMRFamide-gated sodium channel 1 (FaNaC1) from the annelid worm Malacoceros fuliginosus 6 , using cryo-electron microscopy. High-resolution structures of FaNaC1 in the ligand-free resting state and in several ligand-bound states reveal the ligand-binding site and capture the ligand-induced conformational changes that mediate channel gating. Complementary mutagenesis experiments confirm the functional roles of particular amino acid residues implicated by the structures. Our results illuminate ligand-induced channel gating in DEG/ENaCs and offer a structural template for the experimental dissection of channel pharmacology and ion conduction in a characteristically metazoan ion channel superfamily.

Overview

The claims and statistics of this paper haven’t been checked yet.

Run the check — free, no account needed. It reads the open-access text and checks the sources it cites.

A few free checks a day · papers already verified open instantly · results are public

Integrity signals

Registry

Crossref · 10.1101/2023.04.29.538817

Cites

2 of 2 references verified0 citation errors · 0 not checkable

Statistics

Figures

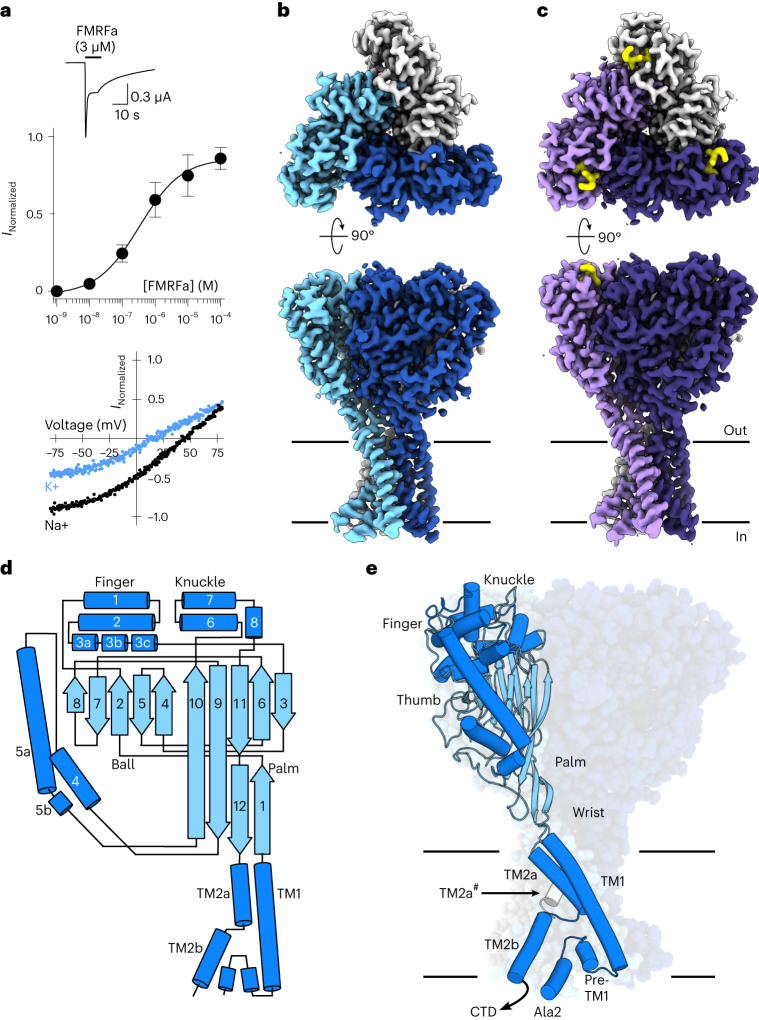
Fig. 1 Malacoceros fuliginosus FaNaC1 architecture. a, Top, example two-electrode voltage clamp current in a FaNaC1-expressing oocyte in response to FMRFa (application indicated by black bar). Middle, mean concentration-dependent FMRFa-gated current amplitudes normalized to maximum (mean ± s.e.m., n = 4 oocytes). Bottom, FMRFa-gated (3 μM) current amplitude at different oocyte membrane voltages in extracellular Na+- or K+-based solutions. b,c, Cryo-EM density maps of FaNaC1 (subunits in blues) (b) and FaNaC1/FMRFa (subunits in purples, FMRFa in yellow) (c), viewed from the extracellular side (top) and from within the lipid bilayer (bottom). Lines indicate bilayer. d, Schematic of major secondary structure elements. α-helices, dark blue; β-strands, light blue. e, FaNaC1 model highlighting one subunit, colored as in d. Ala2, amino acid residue immediately following starting methionine. CTD, C-terminal tail, not resolved; TM2a#, adjacent subunit. Source data
Fig. 1 Malacoceros fuliginosus FaNaC1 architecture. a, Top, example two-electrode voltage clamp current in a FaNaC1-expressing oocyte in response to FMRFa (application indicated by black bar). Middle, mean concentration-dependent FMRFa-gated current amplitudes normalized to maximum (mean ± s.e.m., n = 4 oocytes). Bottom, FMRFa-gated (3 μM) current amplitude at different oocyte membrane voltages in extracellular Na+- or K+-based solutions. b,c, Cryo-EM density maps of FaNaC1 (subunits in blues) (b) and FaNaC1/FMRFa (subunits in purples, FMRFa in yellow) (c), viewed from the extracellular side (top) and from within the lipid bilayer (bottom). Lines indicate bilayer. d, Schematic of major secondary structure elements. α-helices, dark blue; β-strands, light blue. e, FaNaC1 model highlighting one subunit, colored as in d. Ala2, amino acid residue immediately following starting methionine. CTD, C-terminal tail, not resolved; TM2a#, adjacent subunit. Source dataCC BY · PubMed Central
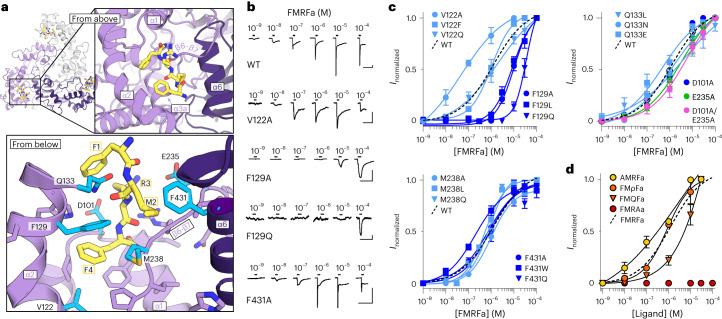
Fig. 2 FMRFa binding site. a, Ligand-binding site in FaNaC1/FMRFa structure, viewed from the extracellular space (‘from above’, top) and from below the FMRFa-binding site (bottom). Subunits shaded in purples, FMRFa yellow. Residues tested via mutagenesis cyan and labeled. b, Example FMRFa-gated currents in oocytes expressing indicated WT and mutant channels. Scale bars, x, 30 s; y, 1 µA (WT, V122A and F129A) or 200 nA (F129Q and F431A). c, Mean (± s.e.m., n = 4 oocytes) normalized currents in response to increasing FMRFa concentrations at indicated mutants. Data points beyond saturating concentrations omitted for clarity. WT curve repeated from Fig. 1a. d, Mean (± s.e.m., n = 3 oocytes for AMRFa and 4 oocytes for all other peptides) normalized currents in response to increasing concentrations of different ligands at WT FaNaC1. Data points beyond saturating concentrations omitted for clarity. WT curve repeated from Fig. 1a. Source data
Fig. 2 FMRFa binding site. a, Ligand-binding site in FaNaC1/FMRFa structure, viewed from the extracellular space (‘from above’, top) and from below the FMRFa-binding site (bottom). Subunits shaded in purples, FMRFa yellow. Residues tested via mutagenesis cyan and labeled. b, Example FMRFa-gated currents in oocytes expressing indicated WT and mutant channels. Scale bars, x, 30 s; y, 1 µA (WT, V122A and F129A) or 200 nA (F129Q and F431A). c, Mean (± s.e.m., n = 4 oocytes) normalized currents in response to increasing FMRFa concentrations at indicated mutants. Data points beyond saturating concentrations omitted for clarity. WT curve repeated from Fig. 1a. d, Mean (± s.e.m., n = 3 oocytes for AMRFa and 4 oocytes for all other peptides) normalized currents in response to increasing concentrations of different ligands at WT FaNaC1. Data points beyond saturating concentrations omitted for clarity. WT curve repeated from Fig. 1a. Source dataCC BY · PubMed Central
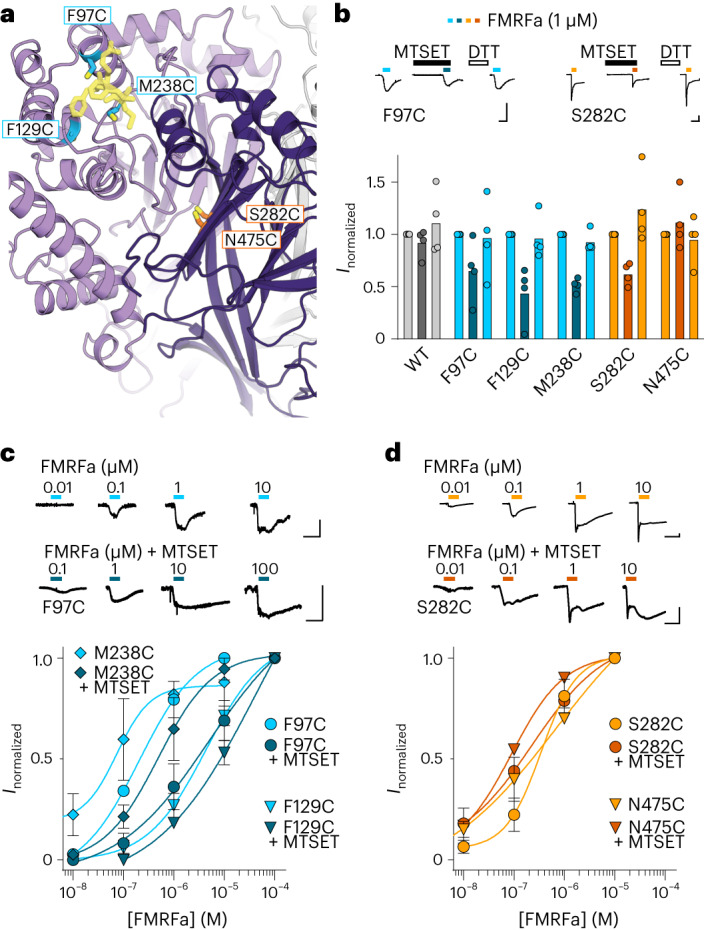
Fig. 3 Chemical modification of FMRFa binding site and intersubunit interface. a, Illustration of cysteine substitutions in FMRFa binding site and previously identified interfacial site. b, FMRFa-gated currents with and without MTSET (300 μM) and after dithiothreitol (DTT) (2 mM) in oocytes expressing indicated FaNaC1 constructs. Top, example recordings. Bottom, mean (columns) and individual (dots, n = 4 oocytes) current amplitude normalized to that in the absence of MTSET. Scale bars, x, 10 s; y, 100 nA. c,d, Top, concentration-dependent FMRFa-gated currents in oocytes expressing indicated FaNaC1 constructs. Bottom, mean (±s.e.m., n = 4 oocytes) concentration-dependent current amplitude normalized to maximum current in the absence of MTSET. Scale bars in c and d, x, 10 s; y, 50 nA. Source data
Fig. 3 Chemical modification of FMRFa binding site and intersubunit interface. a, Illustration of cysteine substitutions in FMRFa binding site and previously identified interfacial site. b, FMRFa-gated currents with and without MTSET (300 μM) and after dithiothreitol (DTT) (2 mM) in oocytes expressing indicated FaNaC1 constructs. Top, example recordings. Bottom, mean (columns) and individual (dots, n = 4 oocytes) current amplitude normalized to that in the absence of MTSET. Scale bars, x, 10 s; y, 100 nA. c,d, Top, concentration-dependent FMRFa-gated currents in oocytes expressing indicated FaNaC1 constructs. Bottom, mean (±s.e.m., n = 4 oocytes) concentration-dependent current amplitude normalized to maximum current in the absence of MTSET. Scale bars in c and d, x, 10 s; y, 50 nA. Source dataCC BY · PubMed Central
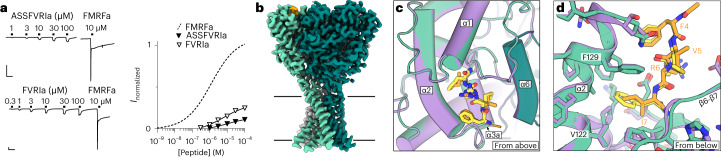
Fig. 4 Partial agonist binding in the FMRFa site. a, Left, FaNaC1 currents gated by ASSFVRIa, FVRIa and FMRFa. Scale bars, x, 30 s; y, 250 nA. Right, average (± s.e.m., n = 4 oocytes for FVRI and 5 oocyes for ASSFVRIa) ASSFVRIa- and FVRI-gated current amplitude normalized to 10 μM FMRFa on the same cells. FMRFa curve repeated from Fig. 1a for display. b, Cryo-EM map of FaNaC1/ASSFVRIa. FaNaC1 subunits shaded in greens, ASSFVRIa orange. c, Overlay of FaNaC1/FMRFa (purple/yellow) and FaNaC1/ASSFVRIa (teal/orange) models viewed from above. d, Magnified view of overlay from c viewed from below. Source data
Fig. 4 Partial agonist binding in the FMRFa site. a, Left, FaNaC1 currents gated by ASSFVRIa, FVRIa and FMRFa. Scale bars, x, 30 s; y, 250 nA. Right, average (± s.e.m., n = 4 oocytes for FVRI and 5 oocyes for ASSFVRIa) ASSFVRIa- and FVRI-gated current amplitude normalized to 10 μM FMRFa on the same cells. FMRFa curve repeated from Fig. 1a for display. b, Cryo-EM map of FaNaC1/ASSFVRIa. FaNaC1 subunits shaded in greens, ASSFVRIa orange. c, Overlay of FaNaC1/FMRFa (purple/yellow) and FaNaC1/ASSFVRIa (teal/orange) models viewed from above. d, Magnified view of overlay from c viewed from below. Source dataCC BY · PubMed Central
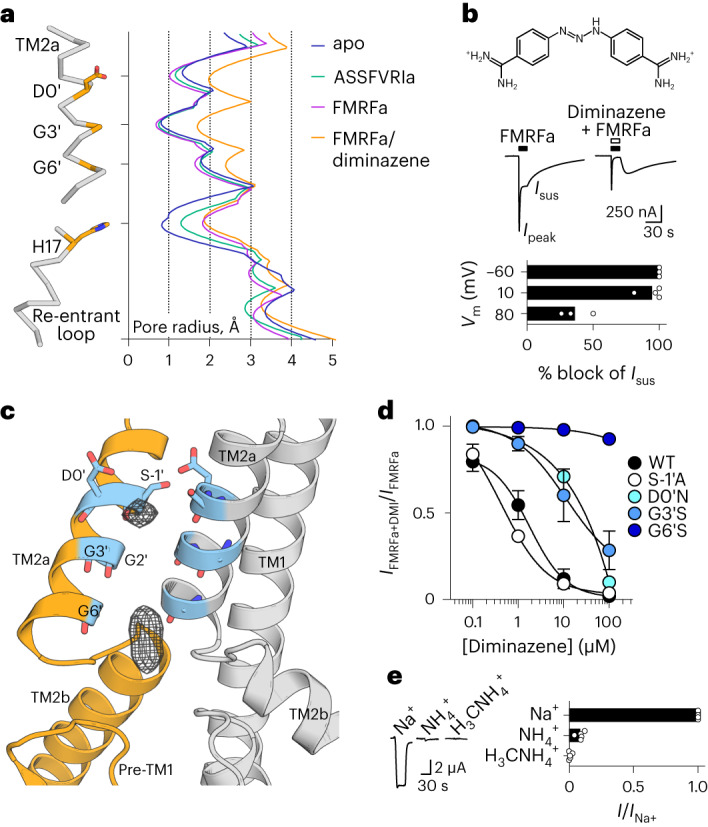
Fig. 5 FaNaC1/FMRFa/diminazene structure. a, Pore-lining residues in FaNaC1/FMRFa/diminazene structure (left) and pore radius for all four cryo-EM structures calculated in HOLE53 (right). b, Top, diminazene structure (ionized at pH 7.4). Middle, peak (Ipeak) and sustained (Isus) FMRFa (3 µM)-gated currents through FaNaC1 in the absence and presence of diminazene (10 μM). Bottom, % block (individual data points, n = 3 oocytes at −60 mV, 4 at 10 mV, 3 at 80 mV; and means, bars) of Isus by diminazene at three different membrane potentials. c, Magnified view of FaNaC1/FMRFa/diminazene model, showing nonprotein cryo-EM density in the pore as mesh. d, Concentration-dependent block of Isus by diminazene at WT and mutant channels (mean ± s.e.m., n = 4 oocytes, except D0′N—see Source data). e, FMRFa-gated current amplitude (Vm = −60 mV; individual data points (n = 5) and means, bars) in extracellular solutions based on different cations. Source data
Fig. 5 FaNaC1/FMRFa/diminazene structure. a, Pore-lining residues in FaNaC1/FMRFa/diminazene structure (left) and pore radius for all four cryo-EM structures calculated in HOLE53 (right). b, Top, diminazene structure (ionized at pH 7.4). Middle, peak (Ipeak) and sustained (Isus) FMRFa (3 µM)-gated currents through FaNaC1 in the absence and presence of diminazene (10 μM). Bottom, % block (individual data points, n = 3 oocytes at −60 mV, 4 at 10 mV, 3 at 80 mV; and means, bars) of Isus by diminazene at three different membrane potentials. c, Magnified view of FaNaC1/FMRFa/diminazene model, showing nonprotein cryo-EM density in the pore as mesh. d, Concentration-dependent block of Isus by diminazene at WT and mutant channels (mean ± s.e.m., n = 4 oocytes, except D0′N—see Source data). e, FMRFa-gated current amplitude (Vm = −60 mV; individual data points (n = 5) and means, bars) in extracellular solutions based on different cations. Source dataCC BY · PubMed Central
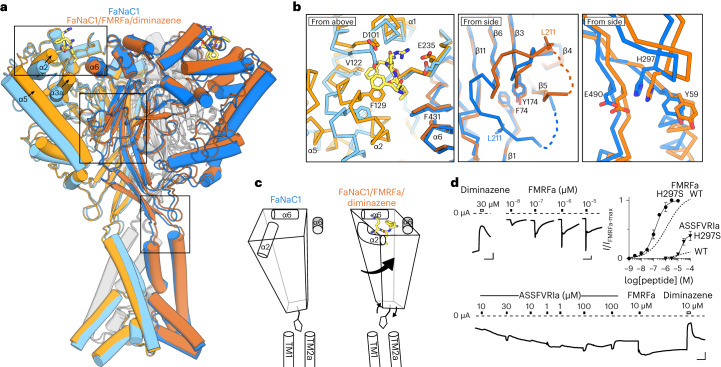
Fig. 6 FaNaC1 gating mechanism. a, Overlay of ligand-free FaNaC1 (blue) and FaNaC1/FMRFa/diminazene (orange) structures. Adjacent subunit in darker shades. b, Magnified views of boxed regions, left to right: ligand binding site; palm domain; β-turn–TM2a/TM1 interactions. Selected side chains shown as sticks and labeled. c, Illustration of one subunit (left subunit in a) moving during gating: peripheral rolling, internal stasis and β-turn moving outward to allow channel expansion. α6 helix from adjacent subunit in gray. d, Top left and bottom, example recordings from oocytes expressing mutant H297S FaNaC1 channels (scale bars, x, 30 s; y, 1 µA). Top right, mean (± s.e.m., n = 5 oocytes) responses of H297S channels to FMRFa and ASSFVRIa normalized to maximum FMRFa-gated current (I/Imax-FMRFa), compared to WT channels. WT curves repeated from Figs. 1a and 4a. Source data
Fig. 6 FaNaC1 gating mechanism. a, Overlay of ligand-free FaNaC1 (blue) and FaNaC1/FMRFa/diminazene (orange) structures. Adjacent subunit in darker shades. b, Magnified views of boxed regions, left to right: ligand binding site; palm domain; β-turn–TM2a/TM1 interactions. Selected side chains shown as sticks and labeled. c, Illustration of one subunit (left subunit in a) moving during gating: peripheral rolling, internal stasis and β-turn moving outward to allow channel expansion. α6 helix from adjacent subunit in gray. d, Top left and bottom, example recordings from oocytes expressing mutant H297S FaNaC1 channels (scale bars, x, 30 s; y, 1 µA). Top right, mean (± s.e.m., n = 5 oocytes) responses of H297S channels to FMRFa and ASSFVRIa normalized to maximum FMRFa-gated current (I/Imax-FMRFa), compared to WT channels. WT curves repeated from Figs. 1a and 4a. Source dataCC BY · PubMed Central
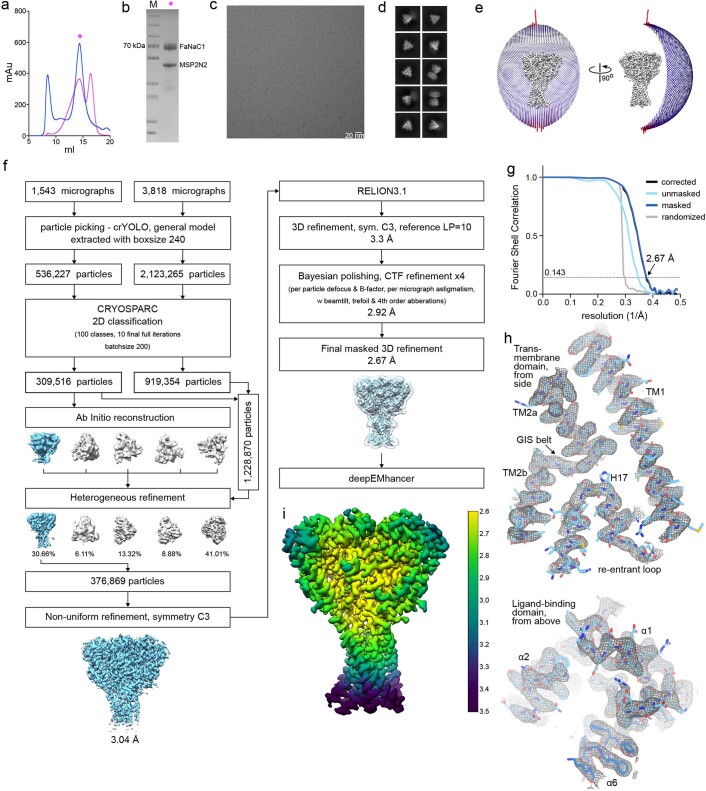
Extended Data Fig. 1 Ligand-free FaNaC1 structure determination by cryo-EM. (a) Size exclusion profiles of detergent-solubilised (blue) and nanodisc-reconstituted (magenta) Malacoceros FaNaC1. Samples were analysed on a Superose 6 Increase 10/300 column. (b) SDS-PAGE of the main peak fraction, which was used for sample preparation for cryo-EM. Protein was purified and reconstituted into lipid nanodiscs three times with similar size exclusion profiles (a) and gel migration (b). Representative cryo-EM image of 5361 micrographs (c) and 2D classes (d) of vitrified FaNaC1 in apo state. (e) Angular distribution of the particles included in the final C3-symmetrised map. The length and the colour of the sticks represent the number of particles. (f) Schematic representation of the processing workflow, the mask used in the final refinement iteration is displayed as a transparent outline. (g) FSC plot used for resolution estimation (0.143 cut-off criteria). (h) Density corresponding to the transmembrane domain and ligand-binding domain shown as grey mesh, deepEMhancer map used for visualization is contoured at 4.5 σ. The respective fitted model is shown in blue. (i) Final deepEMhancer-postprocessed map coloured according to the local resolution estimation in Relion. Source data
Extended Data Fig. 1 Ligand-free FaNaC1 structure determination by cryo-EM. (a) Size exclusion profiles of detergent-solubilised (blue) and nanodisc-reconstituted (magenta) Malacoceros FaNaC1. Samples were analysed on a Superose 6 Increase 10/300 column. (b) SDS-PAGE of the main peak fraction, which was used for sample preparation for cryo-EM. Protein was purified and reconstituted into lipid nanodiscs three times with similar size exclusion profiles (a) and gel migration (b). Representative cryo-EM image of 5361 micrographs (c) and 2D classes (d) of vitrified FaNaC1 in apo state. (e) Angular distribution of the particles included in the final C3-symmetrised map. The length and the colour of the sticks represent the number of particles. (f) Schematic representation of the processing workflow, the mask used in the final refinement iteration is displayed as a transparent outline. (g) FSC plot used for resolution estimation (0.143 cut-off criteria). (h) Density corresponding to the transmembrane domain and ligand-binding domain shown as grey mesh, deepEMhancer map used for visualization is contoured at 4.5 σ. The respective fitted model is shown in blue. (i) Final deepEMhancer-postprocessed map coloured according to the local resolution estimation in Relion. Source dataCC BY · PubMed Central
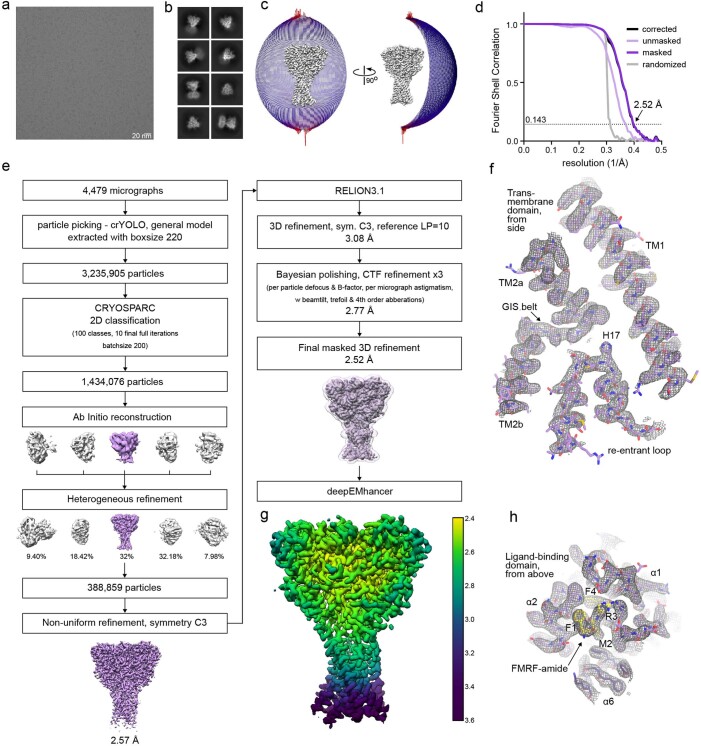
Extended Data Fig. 2 FMRFa-bound FaNaC1 structure determination by cryo-EM. Representative cryo-EM image of 4479 micrographs (a) and 2D classes (b) of vitrified FaNaC1 in presence of FMRFa. (c) Angular distribution of the particles included in the final C3-symmetrised map. The length and the colour of the sticks represent the number of particles. (d) FSC plot used for resolution estimation (0.143 cut-off criteria). (e) Schematic representation of the processing workflow, the mask used in the final refinement iteration is displayed as a transparent outline. (f) Density corresponding to the transmembrane domain shown as grey mesh, deepEMhancer map used for visualization is contoured at 4.5 σ. The respective fitted model is shown in purple. (g) Final deepEMhancer-postprocessed map coloured according to the local resolution estimation in Relion. (h) Close-up view of the ligand-binding site, deepEMhancer map is displayed as grey mesh contoured at 4.5 σ, fitted atomic model is displayed in purple, FMRFa molecule is shown in yellow.
Extended Data Fig. 2 FMRFa-bound FaNaC1 structure determination by cryo-EM. Representative cryo-EM image of 4479 micrographs (a) and 2D classes (b) of vitrified FaNaC1 in presence of FMRFa. (c) Angular distribution of the particles included in the final C3-symmetrised map. The length and the colour of the sticks represent the number of particles. (d) FSC plot used for resolution estimation (0.143 cut-off criteria). (e) Schematic representation of the processing workflow, the mask used in the final refinement iteration is displayed as a transparent outline. (f) Density corresponding to the transmembrane domain shown as grey mesh, deepEMhancer map used for visualization is contoured at 4.5 σ. The respective fitted model is shown in purple. (g) Final deepEMhancer-postprocessed map coloured according to the local resolution estimation in Relion. (h) Close-up view of the ligand-binding site, deepEMhancer map is displayed as grey mesh contoured at 4.5 σ, fitted atomic model is displayed in purple, FMRFa molecule is shown in yellow.CC BY · PubMed Central
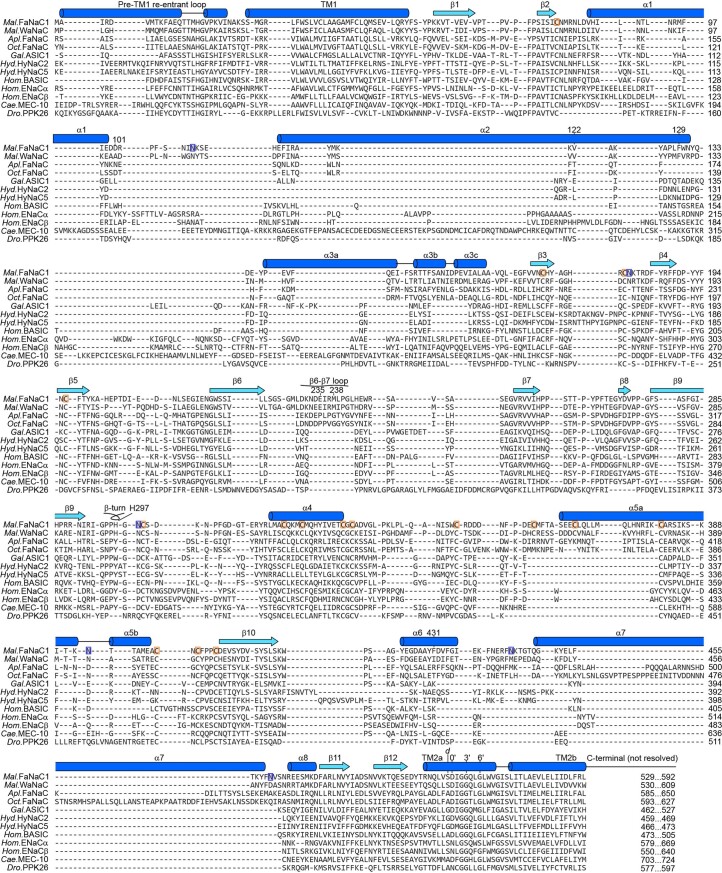
Extended Data Fig. 3 Amino acid sequence alignment of FaNaCs and other DEG/ENaCs. Malacoceros fuliginosus (Mal., bristle worm) FaNaC1 and WaNaC, Aplysia kurodai (Apl., sea slug) FaNaC, Octopus bimaculoides (Oct.) FaNaC, Gallus gallus (Gal., chicken) ASIC1, Hydra vulgaris (Hyd.) HyNaC, human (Hom.) BASIC and ENaC, Caenorhabditis elegans (Cae.) MEC-10, and Drosophila melanogaster (Dro.) PPK26 were extracted from an existing alignment of 544 DEG/ENaCs21 and manually adjusted in α1-α3 to reflect secondary structure (dark blue α-helices, light blue β-strands) of FaNaC1 (present work) and ASIC114. Selected FaNaC1 residues discussed in main text are numbered. ‘Prime’ numbering (for example 0’, 3’, 6’) for better comparison of TM2 residues33. d, position of gain-of-function degenerin mutations46. Orange boxes, FaNaC1 disulfide-forming cysteines. Blue boxes, FaNaC1 glycosylation sites.
Extended Data Fig. 3 Amino acid sequence alignment of FaNaCs and other DEG/ENaCs. Malacoceros fuliginosus (Mal., bristle worm) FaNaC1 and WaNaC, Aplysia kurodai (Apl., sea slug) FaNaC, Octopus bimaculoides (Oct.) FaNaC, Gallus gallus (Gal., chicken) ASIC1, Hydra vulgaris (Hyd.) HyNaC, human (Hom.) BASIC and ENaC, Caenorhabditis elegans (Cae.) MEC-10, and Drosophila melanogaster (Dro.) PPK26 were extracted from an existing alignment of 544 DEG/ENaCs21 and manually adjusted in α1-α3 to reflect secondary structure (dark blue α-helices, light blue β-strands) of FaNaC1 (present work) and ASIC114. Selected FaNaC1 residues discussed in main text are numbered. ‘Prime’ numbering (for example 0’, 3’, 6’) for better comparison of TM2 residues33. d, position of gain-of-function degenerin mutations46. Orange boxes, FaNaC1 disulfide-forming cysteines. Blue boxes, FaNaC1 glycosylation sites.CC BY · PubMed Central
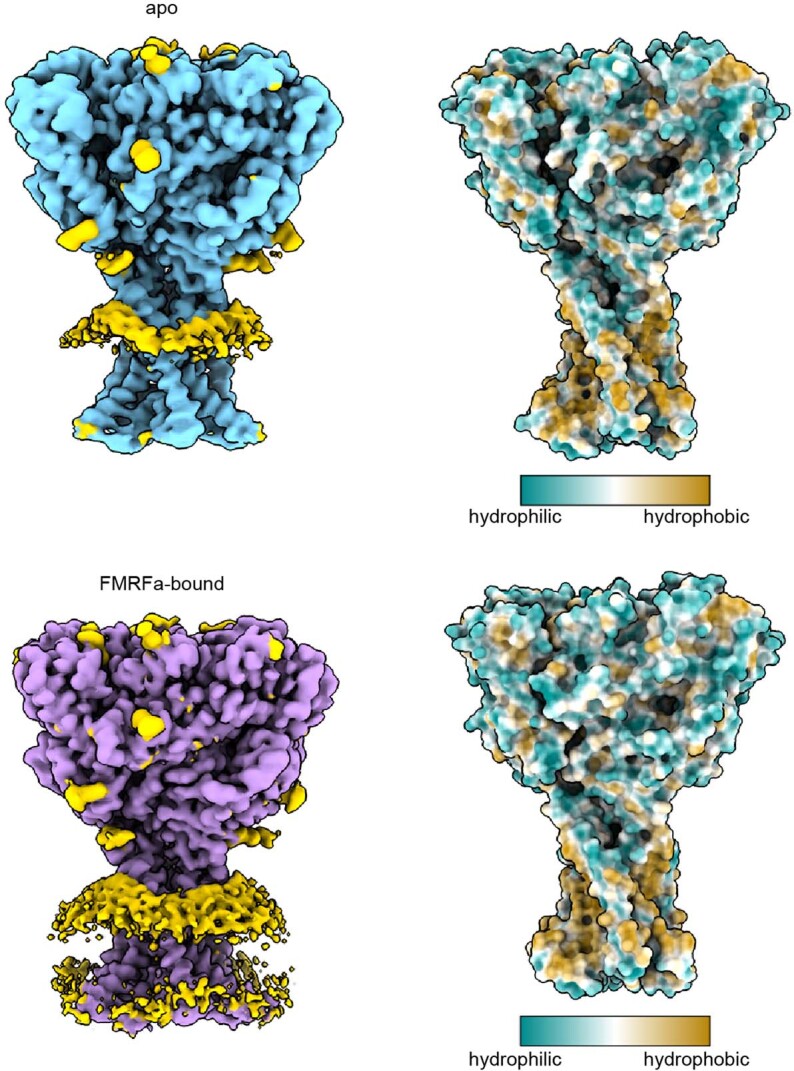
Extended Data Fig. 4 Effect of FaNaC1 on the surrounding lipid bilayer. Shown are unmasked refined maps of FaNaC1 in apo- (blue) and FMRFa-bound (purple) states, density corresponding to nanodisc and glycosylation sites are shown in yellow. Right, surface representation of the refined models coloured according to hydrophobicity.
Extended Data Fig. 4 Effect of FaNaC1 on the surrounding lipid bilayer. Shown are unmasked refined maps of FaNaC1 in apo- (blue) and FMRFa-bound (purple) states, density corresponding to nanodisc and glycosylation sites are shown in yellow. Right, surface representation of the refined models coloured according to hydrophobicity.CC BY · PubMed Central
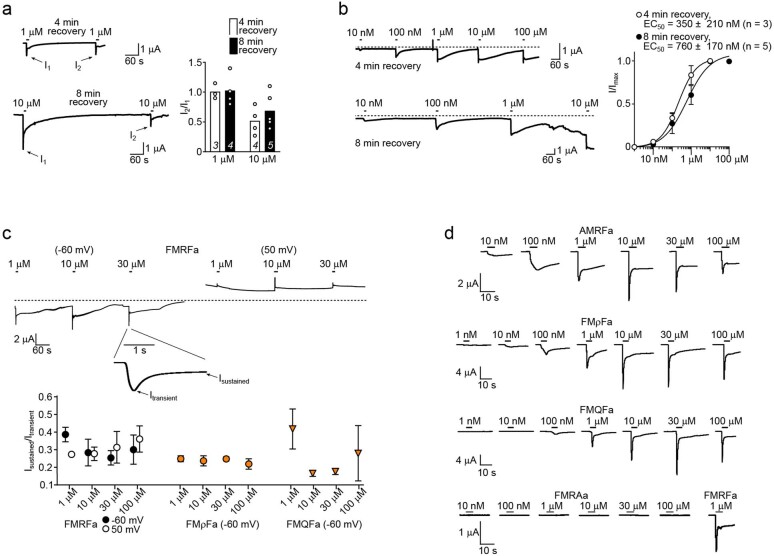
Extended Data Fig. 5 Measurement of FMRFa and other peptide potency. (a) Left, example recordings, and right, individual (points) and mean (columns; n = x oocytes indicated in italics on columns) amplitude of a second FMRFa-gated current (‘I2’) relative to a first (‘I1’) after four minutes or eight minutes recovery, for 1 µM- and 10 µM-gated currents. (b) Left, example recordings (dashed line, zero current baseline), and right, mean ± SEM (n = 3 or 5 oocytes as indicated) FMRFa concentration-dependent current amplitude (‘I/Imax’) with four-minute or eight-minute recovery between applications. Note how in the bottom-left recording, leak current develops after ~20 minutes due to oocyte membrane rupture. (c) Upper, example recordings of currents gated by high FMRFa concentrations at different membrane potentials. Lower, mean ± SEM (n = 3 oocytes) ratio of current after five seconds (‘Isustained’) to initial peak current (‘Itransient’), at different potentials or with different peptide ligands. This ratio is similar at different membrane potentials and with different peptide ligands, indicating a similar level of desensitization at each potential and with each ligand. (d) Example recordings of currents gated by increasing concentrations of different peptide ligands. Source data
Extended Data Fig. 5 Measurement of FMRFa and other peptide potency. (a) Left, example recordings, and right, individual (points) and mean (columns; n = x oocytes indicated in italics on columns) amplitude of a second FMRFa-gated current (‘I2’) relative to a first (‘I1’) after four minutes or eight minutes recovery, for 1 µM- and 10 µM-gated currents. (b) Left, example recordings (dashed line, zero current baseline), and right, mean ± SEM (n = 3 or 5 oocytes as indicated) FMRFa concentration-dependent current amplitude (‘I/Imax’) with four-minute or eight-minute recovery between applications. Note how in the bottom-left recording, leak current develops after ~20 minutes due to oocyte membrane rupture. (c) Upper, example recordings of currents gated by high FMRFa concentrations at different membrane potentials. Lower, mean ± SEM (n = 3 oocytes) ratio of current after five seconds (‘Isustained’) to initial peak current (‘Itransient’), at different potentials or with different peptide ligands. This ratio is similar at different membrane potentials and with different peptide ligands, indicating a similar level of desensitization at each potential and with each ligand. (d) Example recordings of currents gated by increasing concentrations of different peptide ligands. Source dataCC BY · PubMed Central
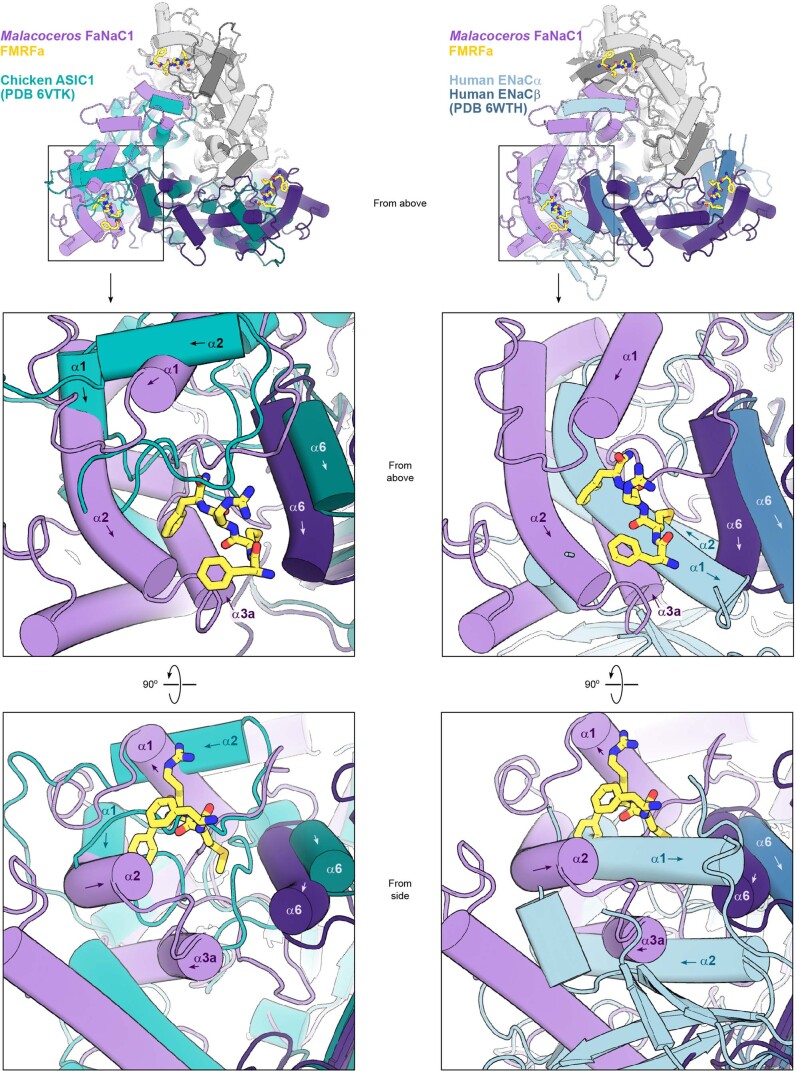
Extended Data Fig. 6 Comparison of FaNaC1 and other DEG/ENaC structures. Upper panels, Malacoceros FaNaC1/FMRFa structure (purple and white subunits, yellow FMRFa) overlaid on two chicken ASIC1 subunits (light teal and dark teal; left) and overlaid on two human ENaC subunits (light blue and dark blue; right), viewed from the extracellular space (‘from above’). Mid panels, magnified views of upper panels. Selected helices labelled (arrows indicate direction of peptide backbone). Lower panels, the same site, viewed from the side.
Extended Data Fig. 6 Comparison of FaNaC1 and other DEG/ENaC structures. Upper panels, Malacoceros FaNaC1/FMRFa structure (purple and white subunits, yellow FMRFa) overlaid on two chicken ASIC1 subunits (light teal and dark teal; left) and overlaid on two human ENaC subunits (light blue and dark blue; right), viewed from the extracellular space (‘from above’). Mid panels, magnified views of upper panels. Selected helices labelled (arrows indicate direction of peptide backbone). Lower panels, the same site, viewed from the side.CC BY · PubMed Central
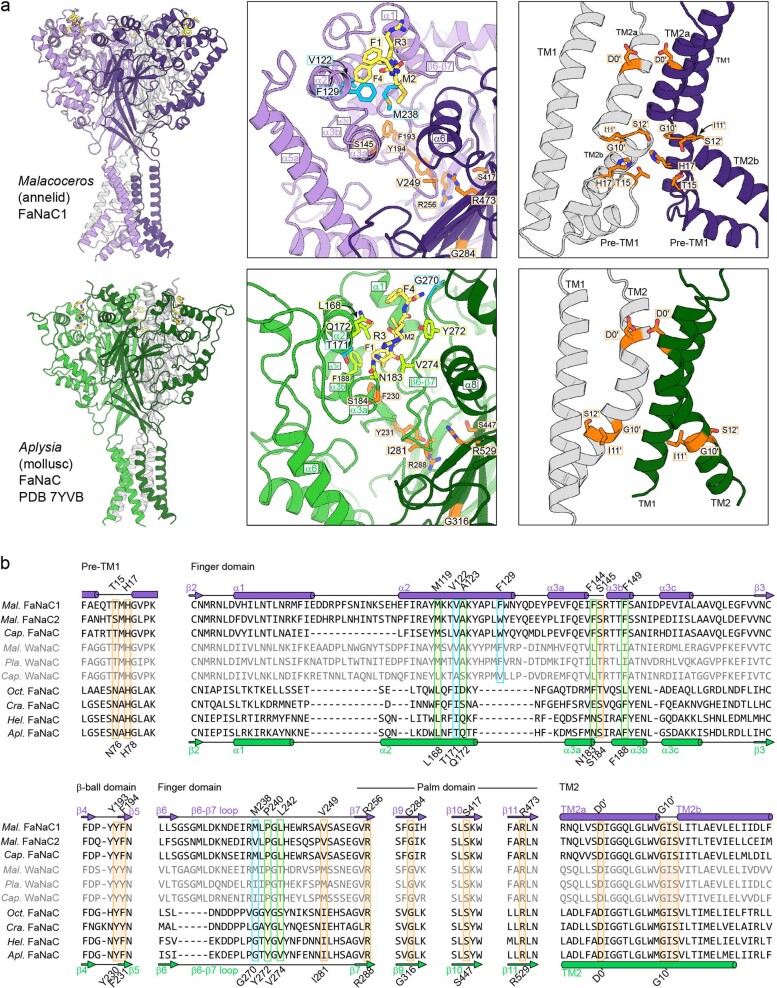
Extended Data Fig. 7 Comparison of Malacoceros FaNaC1 and Aplysia FaNaC. (a) Side view (left), magnified side view of FMRFa-binding site (middle), and magnified side view of channel domain with front subunit removed for clarity (right) of Malacoceros FaNaC1 and Aplysia FaNaC from elsewhere30. Selected Malacoceros FaNaC1 ligand-binding residues cyan, Aplysia FaNaC ligand-binding residues light green, conserved residues in interfacial site and channel domain orange. (b) Amino acid sequence alignment of annelid FaNaCs (upper three; Mal., Malacoceros fuliginosus; Cap., Capitella teleta), annelid Wamide-gated Na+ channels (WaNaCs, grey; Pla., Platynereis dumerilii), and mollusc FaNaCs (lower four; Oct., Octopus bimaculoides; Cra., Crassostrea gigantea; Hel., Helix aspersa; Apl., Aplysia californica). Secondary structure elements for Malacoceros and Aplysia FaNaCs are indicated and residues are highlighted according to (a).
Extended Data Fig. 7 Comparison of Malacoceros FaNaC1 and Aplysia FaNaC. (a) Side view (left), magnified side view of FMRFa-binding site (middle), and magnified side view of channel domain with front subunit removed for clarity (right) of Malacoceros FaNaC1 and Aplysia FaNaC from elsewhere30. Selected Malacoceros FaNaC1 ligand-binding residues cyan, Aplysia FaNaC ligand-binding residues light green, conserved residues in interfacial site and channel domain orange. (b) Amino acid sequence alignment of annelid FaNaCs (upper three; Mal., Malacoceros fuliginosus; Cap., Capitella teleta), annelid Wamide-gated Na+ channels (WaNaCs, grey; Pla., Platynereis dumerilii), and mollusc FaNaCs (lower four; Oct., Octopus bimaculoides; Cra., Crassostrea gigantea; Hel., Helix aspersa; Apl., Aplysia californica). Secondary structure elements for Malacoceros and Aplysia FaNaCs are indicated and residues are highlighted according to (a).CC BY · PubMed Central
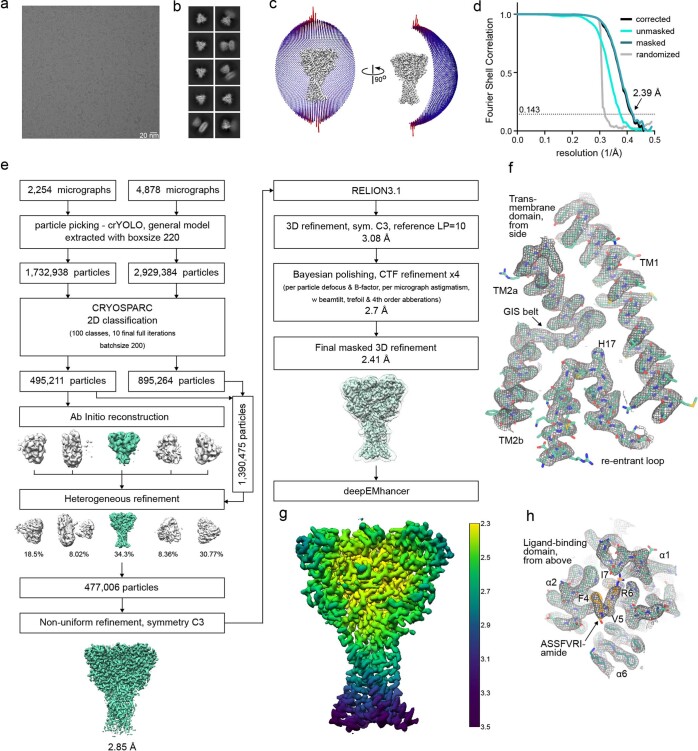
Extended Data Fig. 8 ASSFVRIa-bound FaNaC1 structure determination by cryo-EM. Representative cryo-EM image of 7132 micrographs (a) and 2D classes (b) of vitrified FaNaC1 in ASSFVRIa-bound state. (c) Angular distribution of the particles included in the final C3-symmetrised map. The length and the colour of the sticks represent the number of particles. (d) FSC plot used for resolution estimation (0.143 cut-off criteria). (e) Schematic representation of the processing workflow, the mask used in the final refinement iteration is displayed as a transparent outline. (f) Density corresponding to the transmembrane domain shown as grey mesh, deepEMhancer map used for visualization is contoured at 4.5 σ. The respective fitted model is shown in teal. (g) Final deepEMhancer-postprocessed map coloured according to the local resolution estimation in Relion. (h) Close-up view of the ligand-binding site, deepEMhancer map is displayed as grey mesh contoured at 4.5 σ, fitted atomic model is displayed in teal, FMRFa molecule is shown in orange.
Extended Data Fig. 8 ASSFVRIa-bound FaNaC1 structure determination by cryo-EM. Representative cryo-EM image of 7132 micrographs (a) and 2D classes (b) of vitrified FaNaC1 in ASSFVRIa-bound state. (c) Angular distribution of the particles included in the final C3-symmetrised map. The length and the colour of the sticks represent the number of particles. (d) FSC plot used for resolution estimation (0.143 cut-off criteria). (e) Schematic representation of the processing workflow, the mask used in the final refinement iteration is displayed as a transparent outline. (f) Density corresponding to the transmembrane domain shown as grey mesh, deepEMhancer map used for visualization is contoured at 4.5 σ. The respective fitted model is shown in teal. (g) Final deepEMhancer-postprocessed map coloured according to the local resolution estimation in Relion. (h) Close-up view of the ligand-binding site, deepEMhancer map is displayed as grey mesh contoured at 4.5 σ, fitted atomic model is displayed in teal, FMRFa molecule is shown in orange.CC BY · PubMed Central
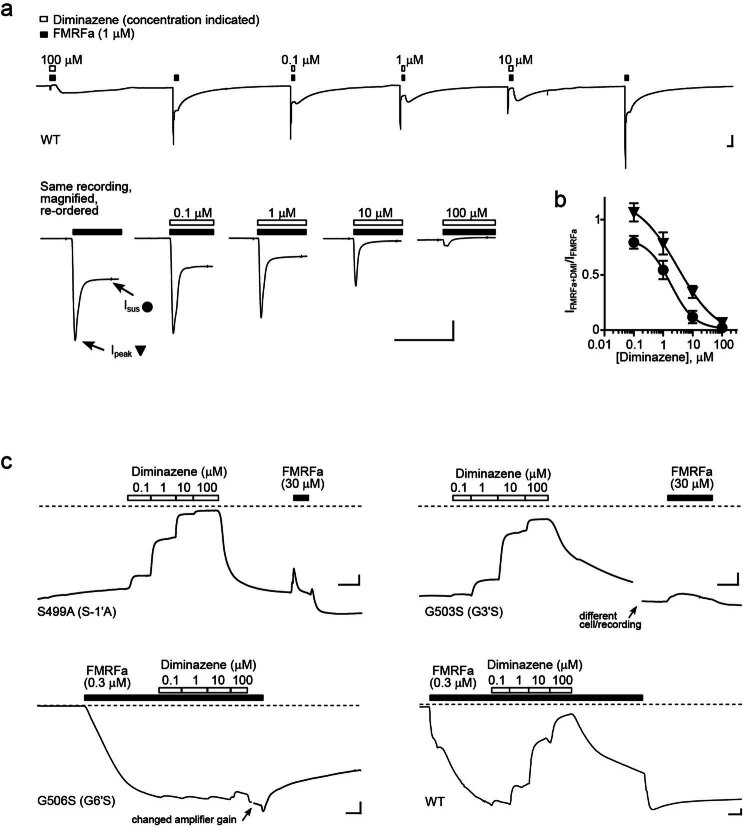
Extended Data Fig. 9 Effects of diminazene on mutant FaNaC1 channels. (a) 1 μM FMRF-gated currents with and without diminazene in an oocyte expressing wildtype (WT) FaNaC1. Lower panel shows a magnified view, illustrating the inhibition of peak and sustained current by diminazene. Scale bars: x, 5 s; y, 0.2 µA. (b) Mean ± SEM normalized peak (n = 4 oocytes) and sustained (n = 7 oocytes) current amplitude in the presence of increasing concentrations of diminazene. (c) Effect of diminazene and FMRFa on constitutive currents in oocytes expressing indicated mutant FaNaC1 channels (upper panel) and effect of diminazene on sustained 0.3 μM FMRFa-gated currents in oocytes expressing mutant or WT FaNaC1 (lower panel; mean ± SEM shown in Fig. 4d). Scale bars: x, 5 s; y, 0.1 µA. Source data
Extended Data Fig. 9 Effects of diminazene on mutant FaNaC1 channels. (a) 1 μM FMRF-gated currents with and without diminazene in an oocyte expressing wildtype (WT) FaNaC1. Lower panel shows a magnified view, illustrating the inhibition of peak and sustained current by diminazene. Scale bars: x, 5 s; y, 0.2 µA. (b) Mean ± SEM normalized peak (n = 4 oocytes) and sustained (n = 7 oocytes) current amplitude in the presence of increasing concentrations of diminazene. (c) Effect of diminazene and FMRFa on constitutive currents in oocytes expressing indicated mutant FaNaC1 channels (upper panel) and effect of diminazene on sustained 0.3 μM FMRFa-gated currents in oocytes expressing mutant or WT FaNaC1 (lower panel; mean ± SEM shown in Fig. 4d). Scale bars: x, 5 s; y, 0.1 µA. Source dataCC BY · PubMed Central
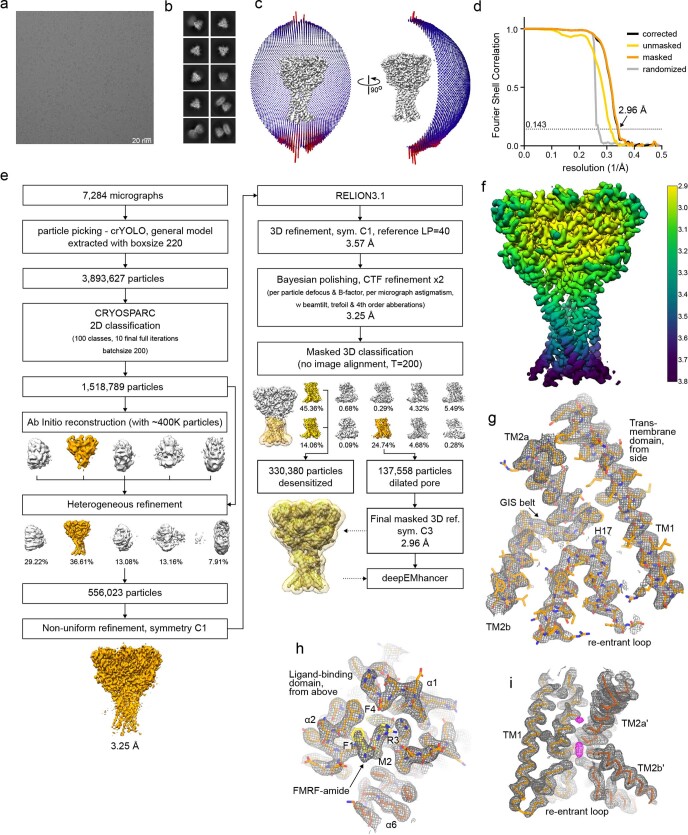
Extended Data Fig. 10 FMRFa-bound FaNaC1 in the presence of diminazene, structure determination by cryo-EM. Representative cryo-EM image of 7284 micrographs (a) and 2D classes (b) of vitrified FaNaC1 in FMRFa-bound state supplemented with diminazene. (c) Angular distribution of the particles included in the final C3-symmetrised map. The length and the colour of the sticks represent the number of particles. (d) FSC plot used for resolution estimation (0.143 cut-off criteria). (e) Schematic representation of the processing workflow, the mask used in the final refinement iteration is displayed as a transparent outline. (f) Final deepEMhancer-postprocessed map coloured according to the local resolution estimation in Relion. (g) Density corresponding to the transmembrane domain shown as grey mesh, deepEMhancer map used for visualization is contoured at 4 σ. The respective fitted model is shown in orange. (h) Close-up view of the ligand-binding site, deepEMhancer map is displayed as grey mesh contoured at 4 σ, fitted atomic model is displayed in orange, FMRFa molecule is shown in yellow. (i) Unassigned density in the pore region displayed in magenta, the surrounding protein density in grey, fitted atomic model is shown as Cα-trace in hues of orange. One subunit is not displayed for clarity.
Extended Data Fig. 10 FMRFa-bound FaNaC1 in the presence of diminazene, structure determination by cryo-EM. Representative cryo-EM image of 7284 micrographs (a) and 2D classes (b) of vitrified FaNaC1 in FMRFa-bound state supplemented with diminazene. (c) Angular distribution of the particles included in the final C3-symmetrised map. The length and the colour of the sticks represent the number of particles. (d) FSC plot used for resolution estimation (0.143 cut-off criteria). (e) Schematic representation of the processing workflow, the mask used in the final refinement iteration is displayed as a transparent outline. (f) Final deepEMhancer-postprocessed map coloured according to the local resolution estimation in Relion. (g) Density corresponding to the transmembrane domain shown as grey mesh, deepEMhancer map used for visualization is contoured at 4 σ. The respective fitted model is shown in orange. (h) Close-up view of the ligand-binding site, deepEMhancer map is displayed as grey mesh contoured at 4 σ, fitted atomic model is displayed in orange, FMRFa molecule is shown in yellow. (i) Unassigned density in the pore region displayed in magenta, the surrounding protein density in grey, fitted atomic model is shown as Cα-trace in hues of orange. One subunit is not displayed for clarity.CC BY · PubMed Central

Verification

Claims the paper makes

The claims and statistics of this paper haven’t been checked yet.

Run the check — free, no account needed. It reads the open-access text and checks the sources it cites.

A few free checks a day · papers already verified open instantly · results are public

Self-check

Percentages, sums and reported differences re-computed from the paper’s own numbers.

The self-check needs the paper’s full text.

Citations

Cites

Research works printed but not linked: 72

  1. 10.1101/cshperspect.a009662 · DOI
  2. 10.1113/JP283335 · DOI
  3. 10.1124/pr.114.009225 · DOI
  4. 10.1038/nature09201 · DOI · Paper page
  5. 10.1016/j.jbc.2022.102086 · DOI
  6. 10.3389/fphys.2014.00160 · DOI
  7. 10.1101/2022.06.28.497943 · DOI
  8. 10.1007/BF00382698 · DOI
  9. 10.1016/0306-4522(80)90149-9 · DOI
  10. 10.1016/j.cell.2014.01.011 · DOI
  11. 10.1038/nature25782 · DOI
  12. 10.1113/JP278707 · DOI
  13. 10.1038/nature06163 · DOI
  14. 10.7554/eLife.59038 · DOI
  15. 10.1098/rstb.2019.0761 · DOI · Paper page
  16. 10.1016/j.cub.2021.09.005 · DOI · Paper page
  17. 10.1074/jbc.M706849200 · DOI · Paper page
  18. 10.1038/378730a0 · DOI
  19. 10.1186/s12915-014-0084-2 · DOI · Paper page
  20. 10.1242/jeb.151092 · DOI
  21. 10.1371/journal.pbio.3001321 · DOI
  22. 10.7554/eLife.56527 · DOI
  23. 10.1101/2023.02.01.526556 · DOI
  24. 10.1242/jeb.200.18.2377 · DOI
  25. 10.1523/JNEUROSCI.21-15-05559.2001 · DOI
  26. 10.1098/rspb.1957.0018 · DOI
  27. 10.7554/eLife.24630 · DOI
  28. 10.1101/2022.05.24.493282 · DOI
  29. 10.1124/mol.117.110064 · DOI
  30. 10.1074/jbc.271.18.10433 · DOI
  31. 10.1016/j.neuropharm.2010.01.011 · DOI
  32. 10.1007/BF01868651 · DOI
  33. 10.1085/jgp.202112899 · DOI
  34. 10.1085/jgp.201411220 · DOI
  35. 10.1093/emboj/16.5.899 · DOI
  36. 10.1007/s004240051097 · DOI
  37. 10.1093/emboj/20.20.5595 · DOI
  38. 10.1016/S0896-6273(00)81144-7 · DOI
  39. 10.1038/s41598-018-37426-5 · DOI
  40. 10.1124/mol.118.112375 · DOI
  41. 10.1074/jbc.M604109200 · DOI
  42. 10.1074/jbc.M706811200 · DOI
  43. 10.1152/physiol.00006.2012 · DOI
  44. 10.1016/S0014-5793(01)02081-6 · DOI
  45. 10.1074/jbc.M115.710251 · DOI
  46. 10.1038/s42003-022-04399-1 · DOI
  47. 10.7554/eLife.81613 · DOI
  48. 10.1126/science.aau2486 · DOI
  49. 10.1085/jgp.58.6.599 · DOI
  50. 10.1016/j.str.2016.03.004 · DOI
  51. 10.1007/978-1-62703-293-3_10 · DOI
  52. 10.1016/j.str.2006.01.013 · DOI
  53. 10.1038/nprot.2014.173 · DOI
  54. 10.1038/nsmb.1727 · DOI
  55. 10.1016/S0076-6879(09)64011-8 · DOI
  56. 10.1107/s205979832100334x · DOI
  57. 10.1016/j.jsb.2005.07.007 · DOI
  58. 10.1016/j.jsb.2017.03.007 · DOI
  59. 10.1038/nmeth.4193 · DOI
  60. 10.1016/j.jsb.2015.08.008 · DOI
  61. 10.1038/s42003-019-0437-z · DOI
  62. 10.7554/eLife.42166 · DOI
  63. 10.1038/nmeth.4169 · DOI · Paper page
  64. 10.1038/s42003-021-02399-1 · DOI
  65. 10.1107/S0907444904019158 · DOI · Paper page
  66. 10.1107/S0907444904011679 · DOI
  67. 10.1107/S2059798318002425 · DOI
  68. 10.1107/S0907444909052925 · DOI · Paper page
  69. 10.1002/jcc.20084 · DOI
  70. 10.1002/pro.3235 · DOI · Paper page
  71. 10.1016/S0263-7855(97)00009-X · DOI
  72. 10.1093/nar/gku1189 · DOI

Metadata

Authors
Kalienkova, V., Dandamudi, M., Paulino, C., & Lynagh, T.
Affiliations
  • University of Groningen (NL)
  • University of Bergen (NO)
Corresponding author
  • Paulino, Cristina
  • Lynagh, Timothy
Venue
Nature Structural & Molecular Biology
Publisher
openRxiv
Published
2023-04-29
Volume
31
Issue
4
Pages
717-726
ISSN
1545-9985 (ISSN-L)
OpenAlex
W4391680694
Cited by
12
References
2
Citations by year
2026: 2 · 2025: 7 · 2024: 3
FWCI
1.63
Type
journal article
Language
en
Open access
Licence
cc-by
Locations
  • Nature Structural & Molecular Biology (publishedVersion, cc-by)
  • bioRxiv (Cold Spring Harbor Laboratory) (acceptedVersion, cc-by)
  • PubMed Central (publishedVersion, cc-by)
  • PubMed (publishedVersion)
  • NORA - Norwegian Open Research Archives (submittedVersion, other-oa)
  • University of Groningen research database (University of Groningen / Centre for Information Technology) (submittedVersion, cc-by)
Funders
  • Schweizerischer Nationalfonds zur Förderung der Wissenschaftlichen Forschung (722.017.001, 740.018.016, 203053, 234817)
  • Nederlandse Organisatie voor Wetenschappelijk Onderzoek (722.017.001, 740.018.016)
  • Norges Forskningsråd (234817)
Topics
  • Life Sciences › Biochemistry, Genetics and Molecular Biology › Molecular Biology › Ion channel regulation and function
  • Life Sciences › Neuroscience › Sensory Systems › Ion Channels and Receptors
  • Life Sciences › Biochemistry, Genetics and Molecular Biology › Molecular Biology › Nicotinic Acetylcholine Receptors Study
Keywords
Malacoceros fuliginosus, ligand binding sites, channel gating, ligand-induced conformational change, ionic conduction
MeSH terms
Ligands, Neuropeptides, Ion Channel Gating, Cryoelectron Microscopy, Epithelial Sodium Channels

About these checks

Registry, retraction, Cites and statistics results are computed, not judged, with one exception: a printed reference that no index lists is read once by a model before it counts as a citation error. Claims are extracted by a model and kept only when their quote appears verbatim in the text; each cited source is then checked, with a model’s help, for whether it says what the claim relies on. Those verdicts can be wrong — read the claim’s quote and the cited source before relying on one.

Statistics and arithmetic are recomputed, not judged.

Confidence bands are shown only for fields calibrated on our annotated test set. None is calibrated yet, so no band is shown.

What counts as a claim ›How we measure confidence ›How we check this ›

Are you an author, or do you see a problem with this page? Request a review