

The DOI matches its Crossref record; 1 of the 1 references it cites were found in a registry or an index.
Reliable interpretability of biology-inspired deep neural networks
Open accessPreprint — published as 10.1038/s41540-023-00310-8
Abstract
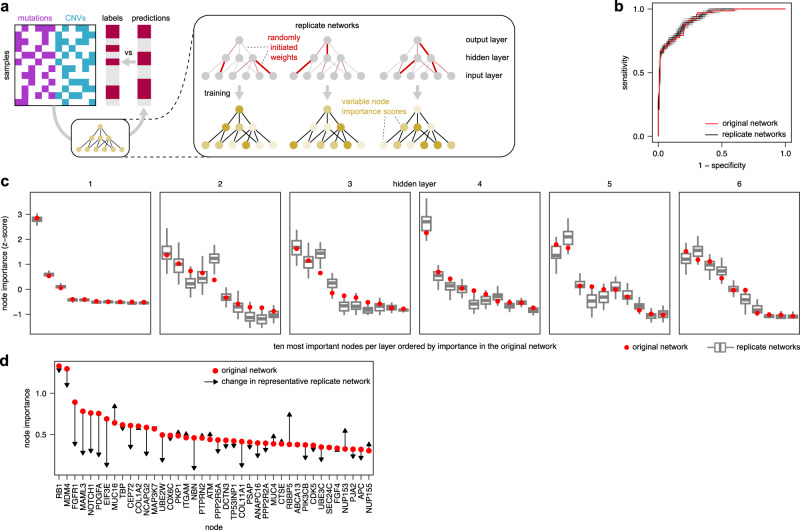
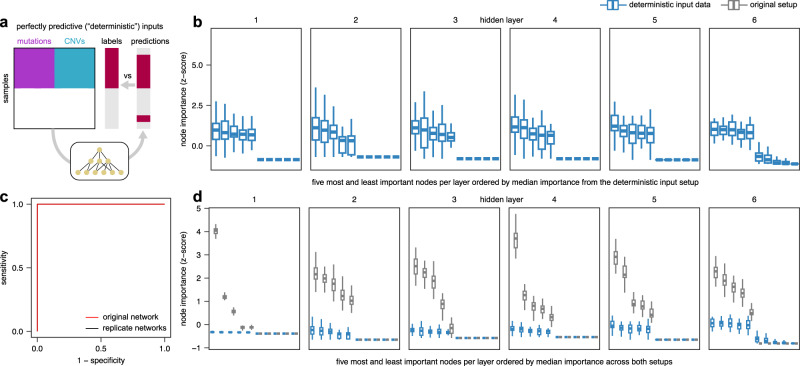
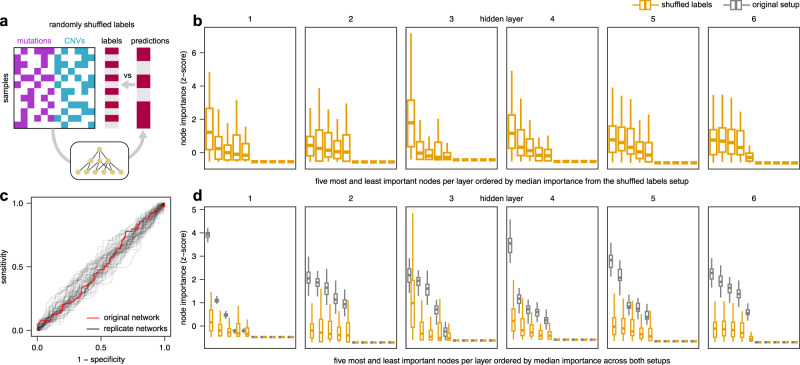
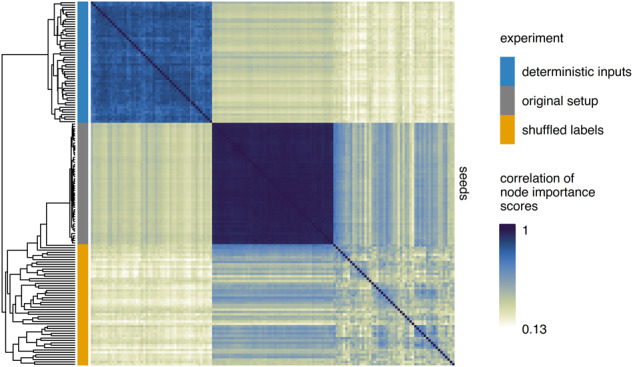
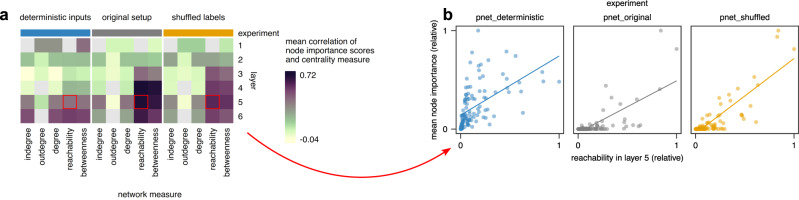
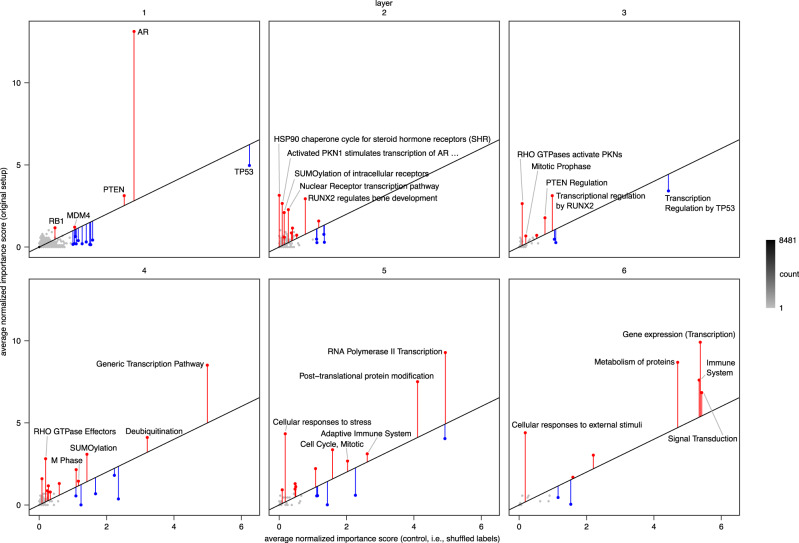
Deep neural networks display impressive performance but suffer from limited interpretability. Biology-inspired deep learning, where the architecture of the computational graph is based on biological knowledge, enables unique interpretability where real-world concepts are encoded in hidden nodes, which can be ranked by importance and thereby interpreted. In such models trained on single-cell transcriptomes, we previously demonstrated that node-level interpretations lack robustness upon repeated training and are influenced by biases in biological knowledge. Similar studies are missing for related models. Here, we test and extend our methodology for reliable interpretability in P-NET, a biology-inspired model trained on patient mutation data. We observe variability of interpretations and susceptibility to knowledge biases, and identify the network properties that drive interpretation biases. We further present an approach to control the robustness and biases of interpretations, which leads to more specific interpretations. In summary, our study reveals the broad importance of methods to ensure robust and bias-aware interpretability in biology-inspired deep learning.
Overview
The claims and statistics of this paper haven’t been checked yet.
Run the check — free, no account needed. It reads the open-access text and checks the sources it cites.
Integrity signals
Registry
Cites
Statistics
Figures
Verification
Claims the paper makes
The claims and statistics of this paper haven’t been checked yet.
Run the check — free, no account needed. It reads the open-access text and checks the sources it cites.
Self-check
Percentages, sums and reported differences re-computed from the paper’s own numbers.
The self-check needs the paper’s full text.
Citations
Cites
Highly accurate protein structure prediction with AlphaFold
Jumper, J., Evans, R., Pritzel, A., Green, T., Figurnov, M., Ronneberger, O., Tunyasuvunakool, K., Bates, R., Žídek, A., Potapenko, A., et al. (2021) · Nature · doi:10.1038/s41586-021-03819-2 · Cited by 43,764
Research works printed but not linked: 50
- 10.1038/nature14539 · DOI · Paper page
- 10.1038/nature21056 · DOI · Paper page
- 2020, Explainable AI: A Review of Machine Learning Interpretability Methods, Entropy, 23, 18, 10.3390/e23010018 · DOI · Paper page
- Doshi-Velez, F. & Kim, B . Towards A Rigorous Science of Interpretable Machine Learning. Preprint at http://arxiv.org/abs/1702.08608 (2017). · arXiv
- Miller, T . Explanation in Artificial Intelligence: Insights from the Social Sciences. Preprint at http://arxiv.org/abs/1706.07269 (2018). · arXiv
- 2022, xxAI - Beyond Explainable AI, 13200, 13, 10.1007/978-3-031-04083-2_2 · DOI
- Ribeiro, M. T. , Singh, S. & Guestrin, C . ‘Why Should I Trust You?’: Explaining the Predictions of Any Classifier. Preprint at http://arxiv.org/abs/1602.04938 (2016). · DOI · Paper page
- Lundberg, S. & Lee, S.-I . A Unified Approach to Interpreting Model Predictions. Preprint at http://arxiv.org/abs/1705.07874 (2017). · arXiv
- 2022, Obtaining genetics insights from deep learning via explainable artificial intelligence, Nat. Rev. Genet, 24, 125
- 2023, A systematic review of biologically-informed deep learning models for cancer: fundamental trends for encoding and interpreting oncology data, BMC Bioinformatics, 24, 198, 10.1186/s12859-023-05262-8 · DOI
- 10.1126/science.aat8464 · DOI · Paper page
- 2022, GraphGONet: a self-explaining neural network encapsulating the Gene Ontology graph for phenotype prediction on gene expression, Bioinformatics, 38, 2504, 10.1093/bioinformatics/btac147 · DOI
- 2018, Using deep learning to model the hierarchical structure and function of a cell, Nat. Methods, 15, 290, 10.1038/nmeth.4627 · DOI · Paper page
- 10.1186/s13059-020-02100-5 · DOI · Paper page
- 10.1038/s41586-021-03922-4 · DOI · Paper page
- 10.1016/j.ccell.2020.09.014 · DOI · Paper page
- 10.1073/pnas.1900654116 · DOI · Paper page
- 2022, CLEVR-XAI: A benchmark dataset for the ground truth evaluation of neural network explanations, Inf. Fusion, 81, 14, 10.1016/j.inffus.2021.11.008 · DOI
- 10.15252/msb.20156651 · DOI · Paper page
- 10.1038/s41467-022-30684-y · DOI
- 2022, Knowledge-guided deep learning models of drug toxicity improve interpretation, Patterns, 3, 100565, 10.1016/j.patter.2022.100565 · DOI
- 10.1186/s12859-018-2500-z · DOI
- 10.1101/2023.04.16.537073 · DOI
- 10.1101/2021.01.28.428664 · DOI · Paper page
- 2021, ParsVNN: parsimony visible neural networks for uncovering cancer-specific and drug-sensitive genes and pathways, NAR Genomics Bioinforma, 3, lqab097, 10.1093/nargab/lqab097 · DOI
- 10.1101/2022.09.20.508703 · DOI
- 2022, A Deep Neural Network for Gastric Cancer Prognosis Prediction Based on Biological Information Pathways, J. Oncol, 2022, 1
- 2022, MPVNN: Mutated Pathway Visible Neural Network architecture for interpretable prediction of cancer-specific survival risk, Bioinformatics, 38, 5026, 10.1093/bioinformatics/btac636 · DOI
- 10.1038/s41556-022-01072-x · DOI · Paper page
- 10.1101/2023.01.20.524948 · DOI
- 10.1101/2023.02.02.526909 · DOI
- 10.1101/2023.04.07.535998 · DOI
- 10.1101/2022.10.21.513161 · DOI
- 10.1101/2023.01.31.23285308 · DOI
- Qiu, L. , Khormali, A. & Liu, K . Deep Biological Pathway Informed Pathology-Genomic Multimodal Survival Prediction. Preprint at http://arxiv.org/abs/2301.02383 (2023). · arXiv
- Jaume, G. et al. Modeling Dense Multimodal Interactions Between Biological Pathways and Histology for Survival Prediction. Preprint at http://arxiv.org/abs/2304.06819 (2023). · arXiv
- 2023, SigPrimedNet: A Signaling-Informed Neural Network for scRNA-seq Annotation of Known and Unknown Cell Types, Biology, 12, 579, 10.3390/biology12040579 · DOI
- 2023, PAUSE: principled feature attribution for unsupervised gene expression analysis, Genome Biol, 24, 81, 10.1186/s13059-023-02901-4 · DOI
- 2021, GenNet framework: interpretable deep learning for predicting phenotypes from genetic data, Commun. Biol, 4, 1094, 10.1038/s42003-021-02622-z · DOI
- 2017, Unsupervised Extraction of Stable Expression Signatures from Public Compendia with an Ensemble of Neural Networks, Cell Syst, 5, 63, 10.1016/j.cels.2017.06.003 · DOI
- 10.1038/nrg1272 · DOI · Paper page
- 10.1371/journal.pbio.1001869 · DOI
- 10.1101/cshperspect.a030452 · DOI
- 10.1016/j.cell.2018.06.039 · DOI · Paper page
- 10.1073/pnas.1902651116 · DOI · Paper page
- 10.1371/journal.pone.0017258 · DOI
- 10.1038/nm.4333 · DOI · Paper page
- 2023, Evaluating explainability for graph neural networks, Sci. Data, 10, 144, 10.1038/s41597-023-01974-x · DOI · Paper page
- Hadley Wickham . ggplot2: Elegant Graphics for Data Analysis. (Springer-Verlag, 2016). · DOI
- 2022, Complex heatmap visualization, iMeta, 1, e43, 10.1002/imt2.43 · DOI
Metadata
- Authors
- Esser-Skala, W., & Fortelny, N.
- Affiliations
- University of Salzburg (AT)
- Corresponding author
- Fortelny, Nikolaus
- Venue
- npj Systems Biology and Applications
- Publisher
- openRxiv
- Published
- 2023-07-18
- Volume
- 9
- Issue
- 1
- Pages
- 50-50
- ISSN
- 2056-7189 (ISSN-L)
- PMC
- PMC10564878
- OpenAlex
- W4387495568
- Cited by
- 37
- References
- 1
- Citations by year
- 2026: 11 · 2025: 15 · 2024: 11
- FWCI
- 3.48
- Type
- journal article
- Language
- en
- Open access
- gold
- doi.org
- Licence
- cc-by
- Locations
- npj Systems Biology and Applications (publishedVersion, cc-by)
- bioRxiv (Cold Spring Harbor Laboratory) (acceptedVersion, cc-by)
- PubMed Central (publishedVersion, cc-by)
- PubMed (publishedVersion)
- DOAJ (DOAJ: Directory of Open Access Journals) (submittedVersion, cc-by-sa)
- Topics
- Physical Sciences › Computer Science › Artificial Intelligence › Explainable Artificial Intelligence (XAI)
- Life Sciences › Biochemistry, Genetics and Molecular Biology › Molecular Biology › Bioinformatics and Genomic Networks
- Life Sciences › Biochemistry, Genetics and Molecular Biology › Molecular Biology › Single-cell and spatial transcriptomics
- Keywords
- interpretability, P-NET, knowledge bias, node importance ranking, single-cell transcriptomics
- MeSH terms
- Humans, Models, Biological, Mutation, Neural Networks, Computer, Transcriptome
About these checks
Registry, retraction, Cites and statistics results are computed, not judged, with one exception: a printed reference that no index lists is read once by a model before it counts as a citation error. Claims are extracted by a model and kept only when their quote appears verbatim in the text; each cited source is then checked, with a model’s help, for whether it says what the claim relies on. Those verdicts can be wrong — read the claim’s quote and the cited source before relying on one.
Statistics and arithmetic are recomputed, not judged.
Confidence bands are shown only for fields calibrated on our annotated test set. None is calibrated yet, so no band is shown.
What counts as a claim ›How we measure confidence ›How we check this ›
Are you an author, or do you see a problem with this page? Request a review
