PreprintCited by 7Enzyme Structure and FunctionRedox biology and oxidative stressAdvanced Electron Microscopy Techniques and Applications

The DOI matches its Crossref record; 1 of the 1 references it cites were found in a registry or an index.

Structural and biochemical characterization of a widespread enterobacterial peroxidase encapsulin

Open access
Ubilla-Rodriguez, Natalia C., Andreas, Michael P., Giessen, Tobias W.·2024·Advanced Science

Preprint — published as 10.1002/advs.202415827

Abstract

Encapsulins are self-assembling protein compartments found in prokaryotes and specifically encapsulate dedicated cargo enzymes. The most abundant encapsulin cargo class are Dye-decolorizing Peroxidases (DyPs). It has been previously suggested that DyP encapsulins are involved in oxidative stress resistance and bacterial pathogenicity due to DyPs’ inherent ability to reduce and detoxify hydrogen peroxide while oxidizing a broad range of organic co-substrates. Here, we report the structural and biochemical analysis of a DyP encapsulin widely found across enterobacteria. Using bioinformatic approaches, we show that this DyP encapsulin is encoded by a conserved transposon-associated operon, enriched in enterobacterial pathogens. Through low pH and peroxide exposure experiments, we highlight the stability of this DyP encapsulin under harsh conditions and show that DyP catalytic activity is highest at low pH. We determine the structure of the DyP-loaded shell and free DyP via cryo-electron microscopy, revealing the structural basis for DyP cargo loading and peroxide preference. Our work lays the foundation to further explore the substrate range and physiological functions of enterobacterial DyP encapsulins.

Overview

The claims and statistics of this paper haven’t been checked yet.

Run the check — free, no account needed. It reads the open-access text and checks the sources it cites.

A few free checks a day · papers already verified open instantly · results are public

Integrity signals

Registry

Crossref · 10.1101/2024.11.27.625667

Cites

1 of 1 references verified0 citation errors · 0 not checkable

Statistics

Figures

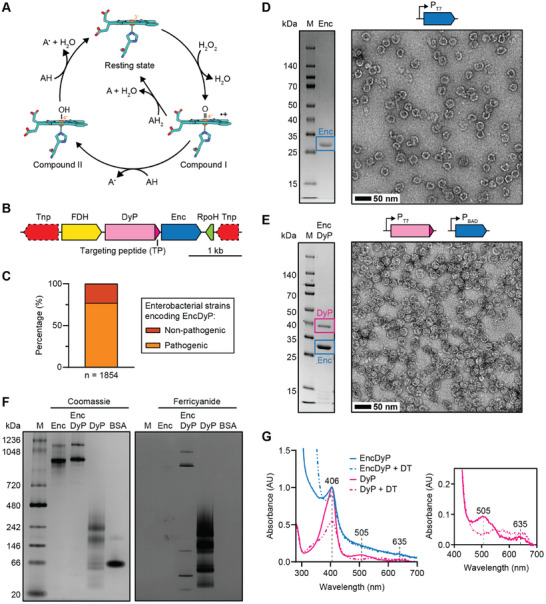
Figure 1 Identification and heterologous production of an enterobacterial DyP encapsulin. A) Proposed catalytic cycle for DyPs. The active site heme group and proximal histidine ligand are shown as stick models in cyan. Iron is shown as an orange sphere. The catalytic cycle starts with the ferric resting state. Next, hydrogen peroxide coordinates to the heme iron and, likely mediated by acid‐base catalysis, a net loss of water then yields the radical cation oxoferryl species Compound I. In this step, the two oxygens of H2O2 are reduced (one oxygen lost as water, the other still bound to iron) resulting in oxidation of the heme iron and porphyrin ring. This intermediate is then reduced in either two successive one‐electron transfers via the intermediate Compound II state, or a single two‐electron transfer from an appropriate electron‐donating co‐substrate, to the initial ferric resting state. A: electron‐donating organic co‐substrate. B) Representative DyP encapsulin operon. C) Distribution of DyP encapsulins in enterobacteria. D) SDS‐PAGE gel (left) and negative stain TEM micrograph (right) of the purified Enc shell. M: molecular weight marker. Scale bar: 50 nm. E) SDS‐PAGE gel (left) and TEM micrograph (right) of purified DyP‐loaded Enc resulting from staggered co‐expression. Scale bar: 50 nm. F) Native PAGE analysis of free DyP and EncDyP. Coomassie staining shown on the left, ferricyanide staining shown on the right. Ferricyanide staining after 3,3′‐diaminobenzidine (DAB) and H2O2 exposure allows for the in‐gel detection of peroxidase activity. In the presence of H2O2, DAB is oxidized resulting in a polymerized brown precipitate which is further oxidized by ferricyanide leading to an enhanced in‐gel signal. BSA: bovine serum albumin. G) UV–Vis analysis of free DyP and EncDyP. Full spectrum shown on the left, zoomed‐in region shown on the right. The Soret peak is visible at 406 nm. Upon reduction, a decrease in the Soret peak and loss of the two minor absorbance peaks at 505 and 635 nm is observed. Further, a minor broad absorbance peak in the region of 500 to 700 nm, characteristic for DyPs, is observed upon reduction.[ 53 ] DT: dithionite. AU: absorbance units.
Figure 1 Identification and heterologous production of an enterobacterial DyP encapsulin. A) Proposed catalytic cycle for DyPs. The active site heme group and proximal histidine ligand are shown as stick models in cyan. Iron is shown as an orange sphere. The catalytic cycle starts with the ferric resting state. Next, hydrogen peroxide coordinates to the heme iron and, likely mediated by acid‐base catalysis, a net loss of water then yields the radical cation oxoferryl species Compound I. In this step, the two oxygens of H2O2 are reduced (one oxygen lost as water, the other still bound to iron) resulting in oxidation of the heme iron and porphyrin ring. This intermediate is then reduced in either two successive one‐electron transfers via the intermediate Compound II state, or a single two‐electron transfer from an appropriate electron‐donating co‐substrate, to the initial ferric resting state. A: electron‐donating organic co‐substrate. B) Representative DyP encapsulin operon. C) Distribution of DyP encapsulins in enterobacteria. D) SDS‐PAGE gel (left) and negative stain TEM micrograph (right) of the purified Enc shell. M: molecular weight marker. Scale bar: 50 nm. E) SDS‐PAGE gel (left) and TEM micrograph (right) of purified DyP‐loaded Enc resulting from staggered co‐expression. Scale bar: 50 nm. F) Native PAGE analysis of free DyP and EncDyP. Coomassie staining shown on the left, ferricyanide staining shown on the right. Ferricyanide staining after 3,3′‐diaminobenzidine (DAB) and H2O2 exposure allows for the in‐gel detection of peroxidase activity. In the presence of H2O2, DAB is oxidized resulting in a polymerized brown precipitate which is further oxidized by ferricyanide leading to an enhanced in‐gel signal. BSA: bovine serum albumin. G) UV–Vis analysis of free DyP and EncDyP. Full spectrum shown on the left, zoomed‐in region shown on the right. The Soret peak is visible at 406 nm. Upon reduction, a decrease in the Soret peak and loss of the two minor absorbance peaks at 505 and 635 nm is observed. Further, a minor broad absorbance peak in the region of 500 to 700 nm, characteristic for DyPs, is observed upon reduction.[ 53 ] DT: dithionite. AU: absorbance units.CC BY · PubMed Central
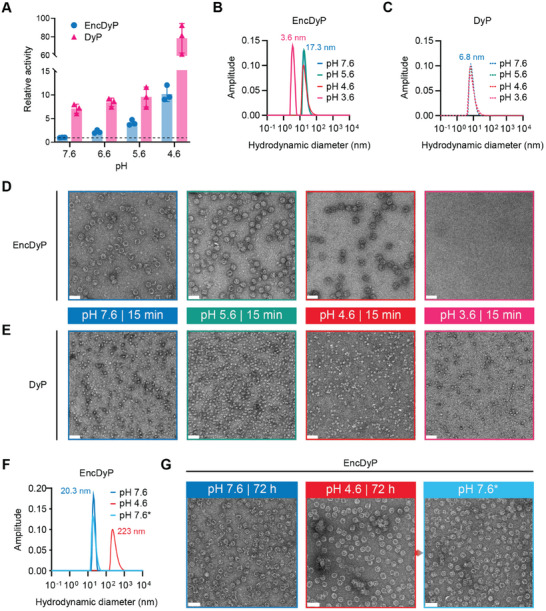
Figure 2 Low pH activity and stability analysis. A) Relative activity comparison of free DyP and EncDyP at different pH values. Values were normalized to EncDyP at pH 7.6 (dotted line). Individual data points of three independent replicates are shown. B) Representative DLS analysis of EncDyP after 15 min incubation at different pH values. Colors for pH values correspond to the ones used in panles D,E). All DLS analyses were carried out in triplicate. C) Representative DLS analysis of free DyP after 15 min incubation at different pH values. All DLS analyses were carried out in triplicate D) Negative stain TEM micrographs of EncDyPs after incubation for 15 min at the indicated pH values. Scale bars: 50 nm. E) TEM micrographs of free DyP after incubation for 15 min at the indicated pH values. Scale bars: 50 nm. F) Representative DLS analysis of EncDyP after 72 h exposure at different pH values. All DLS analyses were carried out in triplicate G) TEM micrographs of EncDyP after 72 h incubation at pH 7.6 (left) and pH 4.6 (middle). A further sample (right) was buffer‐exchanged back into pH 7.6 buffer after 72 h pH 4.6 incubation. *: indicates that the sample was incubated at pH 4.6 before reversing pH to 7.6. Scale bars: 50 nm.
Figure 2 Low pH activity and stability analysis. A) Relative activity comparison of free DyP and EncDyP at different pH values. Values were normalized to EncDyP at pH 7.6 (dotted line). Individual data points of three independent replicates are shown. B) Representative DLS analysis of EncDyP after 15 min incubation at different pH values. Colors for pH values correspond to the ones used in panles D,E). All DLS analyses were carried out in triplicate. C) Representative DLS analysis of free DyP after 15 min incubation at different pH values. All DLS analyses were carried out in triplicate D) Negative stain TEM micrographs of EncDyPs after incubation for 15 min at the indicated pH values. Scale bars: 50 nm. E) TEM micrographs of free DyP after incubation for 15 min at the indicated pH values. Scale bars: 50 nm. F) Representative DLS analysis of EncDyP after 72 h exposure at different pH values. All DLS analyses were carried out in triplicate G) TEM micrographs of EncDyP after 72 h incubation at pH 7.6 (left) and pH 4.6 (middle). A further sample (right) was buffer‐exchanged back into pH 7.6 buffer after 72 h pH 4.6 incubation. *: indicates that the sample was incubated at pH 4.6 before reversing pH to 7.6. Scale bars: 50 nm.CC BY · PubMed Central
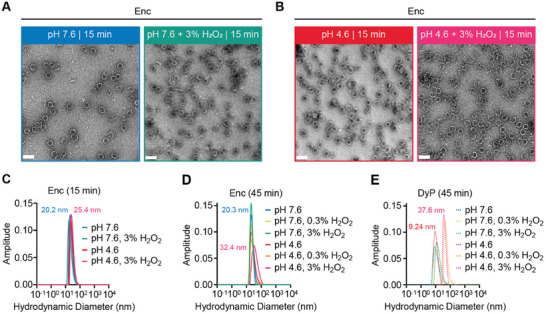
Figure 3 Stability analysis of individual components under simultaneous acid and peroxide stress. A) Negative stain TEM micrographs of Enc shells in the absence (left) or presence (right) of high peroxide stress at pH 7.6. Scale bars: 50 nm. B) TEM micrographs of Enc shells in the absence (left) or presence (right) of high peroxide stress at pH 4.6. Scale bars: 50 nm. C) Representative DLS analysis of the Enc shell samples shown in panels A) and B). D) Representative DLS analysis of Enc shells after 45 min incubation at different pH values and peroxide concentrations. E) Representative DLS analysis of DyP after 45 min incubation at different pH values and peroxide concentrations. All DLS analyses were carried out in triplicate.
Figure 3 Stability analysis of individual components under simultaneous acid and peroxide stress. A) Negative stain TEM micrographs of Enc shells in the absence (left) or presence (right) of high peroxide stress at pH 7.6. Scale bars: 50 nm. B) TEM micrographs of Enc shells in the absence (left) or presence (right) of high peroxide stress at pH 4.6. Scale bars: 50 nm. C) Representative DLS analysis of the Enc shell samples shown in panels A) and B). D) Representative DLS analysis of Enc shells after 45 min incubation at different pH values and peroxide concentrations. E) Representative DLS analysis of DyP after 45 min incubation at different pH values and peroxide concentrations. All DLS analyses were carried out in triplicate.CC BY · PubMed Central
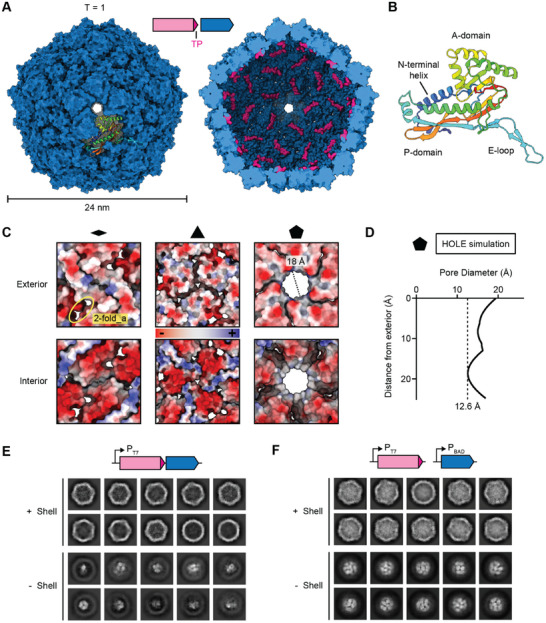
Figure 4 Cryo‐EM analysis of the DyP‐loaded Enc shell. A) Exterior (left) and interior (right) view of the Enc shell. An individual Enc protomer is shown in the context of the shell in rainbow coloring. Targeting peptides (TPs) are shown in pink. B) The Enc protomer adopts the HK97 phage‐like fold. Conserved domains are labeled. Structural model colored in rainbow. C) Two‐fold (left), three‐fold (middle), and five‐fold (right) pores shown as electrostatic surfaces. Both exterior (top) and interior (bottom) views are shown. The two‐fold_a pores are also highlighted. D) Pore diameter calculation of the five‐fold pore via HOLE simulations. The vertical dotted line indicates the narrowest point of the pore. E) 2D class averages of EncDyP—produced using a two‐gene operon—before (top) and after (bottom) shell subtraction. F) 2D class averages of EncDyP—produced via staggered expression of DyP and Enc—before (top) and after (bottom) shell subtraction. Substantially increased cargo‐loading can be observed.
Figure 4 Cryo‐EM analysis of the DyP‐loaded Enc shell. A) Exterior (left) and interior (right) view of the Enc shell. An individual Enc protomer is shown in the context of the shell in rainbow coloring. Targeting peptides (TPs) are shown in pink. B) The Enc protomer adopts the HK97 phage‐like fold. Conserved domains are labeled. Structural model colored in rainbow. C) Two‐fold (left), three‐fold (middle), and five‐fold (right) pores shown as electrostatic surfaces. Both exterior (top) and interior (bottom) views are shown. The two‐fold_a pores are also highlighted. D) Pore diameter calculation of the five‐fold pore via HOLE simulations. The vertical dotted line indicates the narrowest point of the pore. E) 2D class averages of EncDyP—produced using a two‐gene operon—before (top) and after (bottom) shell subtraction. F) 2D class averages of EncDyP—produced via staggered expression of DyP and Enc—before (top) and after (bottom) shell subtraction. Substantially increased cargo‐loading can be observed.CC BY · PubMed Central
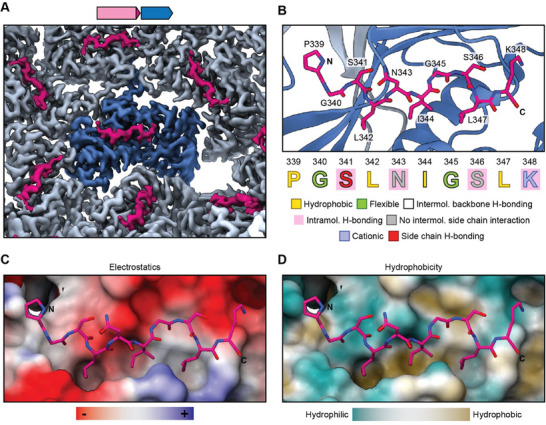
Figure 5 The structural basis for DyP cargo loading. A) Cryo‐EM density highlighting TP binding to individual Enc protomers. A central protomer is highlighted in dark blue and TPs are shown in pink. B) Structural model of the TP binding site. The TP is shown in stick representation (pink) while the Enc protomer is shown in ribbon representation (dark blue). The TP sequence and the different observed interactions are highlighted. C) TP‐shell interaction highlighting the electrostatics of the TP binding site. D) TP binding site highlighting the hydrophobic groove characteristic for TP‐shell interactions in many Family 1 encapsulin systems.
Figure 5 The structural basis for DyP cargo loading. A) Cryo‐EM density highlighting TP binding to individual Enc protomers. A central protomer is highlighted in dark blue and TPs are shown in pink. B) Structural model of the TP binding site. The TP is shown in stick representation (pink) while the Enc protomer is shown in ribbon representation (dark blue). The TP sequence and the different observed interactions are highlighted. C) TP‐shell interaction highlighting the electrostatics of the TP binding site. D) TP binding site highlighting the hydrophobic groove characteristic for TP‐shell interactions in many Family 1 encapsulin systems.CC BY · PubMed Central
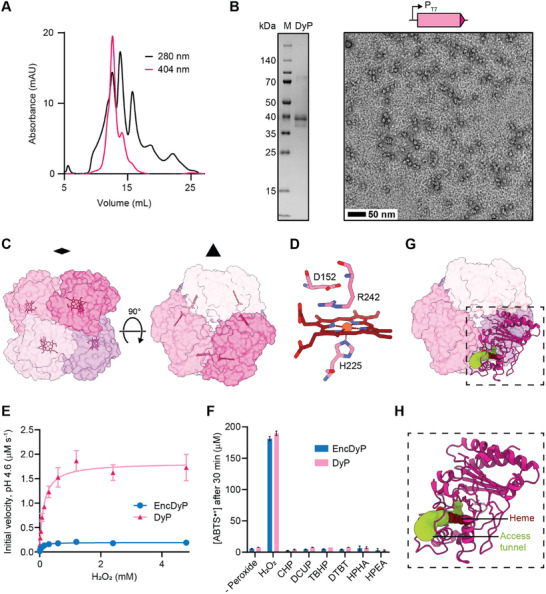
Figure 6 Structural and functional analysis of free DyP. A) Size exclusion chromatogram of free DyP using a Superdex S‐200 column highlighting the presence of multiple DyP oligomeric states. B) SDS‐PAGE gel (left) and TEM micrograph (right) of purified free DyP. Scale bar: 50 nm. C) Structural model of the D3 symmetrical DyP hexamer shown along the two‐fold (left) and three‐fold (right) symmetry axis in surface representation. Individual subunits are colored, and heme cofactors are shown as stick models. D) Structure of the DyP active site shown in stick representation. The proximal histidine coordinating the heme iron (H225) and the conserved distal residues (D152 and R242) are highlighted. E) Saturation kinetics analysis of free DyP and EncDyP. Assays were carried out in triplicate. F) Peroxide preference of free DyP and EncDyP. CHP: cumene hydroperoxide. DCUP: dicumyl peroxide. TBHP: tert‐butyl hydroperoxide. DTBP: di‐tert‐butyl peroxide. HPHA: hydroperoxyl‐hexadecatrienoic acid. HPEA: hydroperoxyl‐eicosadienoic acid. ABTS: 2,2′‐azino‐bis(3‐ethylbenzothiazoline‐6‐sulfonic acid. Assays were carried out in triplicate. G) Access tunnel (yellow green) to the heme active site in the context of the DyP hexamer. H) Zoom‐in showing an individual subunit and the corresponding heme access tunnel.
Figure 6 Structural and functional analysis of free DyP. A) Size exclusion chromatogram of free DyP using a Superdex S‐200 column highlighting the presence of multiple DyP oligomeric states. B) SDS‐PAGE gel (left) and TEM micrograph (right) of purified free DyP. Scale bar: 50 nm. C) Structural model of the D3 symmetrical DyP hexamer shown along the two‐fold (left) and three‐fold (right) symmetry axis in surface representation. Individual subunits are colored, and heme cofactors are shown as stick models. D) Structure of the DyP active site shown in stick representation. The proximal histidine coordinating the heme iron (H225) and the conserved distal residues (D152 and R242) are highlighted. E) Saturation kinetics analysis of free DyP and EncDyP. Assays were carried out in triplicate. F) Peroxide preference of free DyP and EncDyP. CHP: cumene hydroperoxide. DCUP: dicumyl peroxide. TBHP: tert‐butyl hydroperoxide. DTBP: di‐tert‐butyl peroxide. HPHA: hydroperoxyl‐hexadecatrienoic acid. HPEA: hydroperoxyl‐eicosadienoic acid. ABTS: 2,2′‐azino‐bis(3‐ethylbenzothiazoline‐6‐sulfonic acid. Assays were carried out in triplicate. G) Access tunnel (yellow green) to the heme active site in the context of the DyP hexamer. H) Zoom‐in showing an individual subunit and the corresponding heme access tunnel.CC BY · PubMed Central

Verification

Claims the paper makes

The claims and statistics of this paper haven’t been checked yet.

Run the check — free, no account needed. It reads the open-access text and checks the sources it cites.

A few free checks a day · papers already verified open instantly · results are public

Self-check

Percentages, sums and reported differences re-computed from the paper’s own numbers.

The self-check needs the paper’s full text.

Citations

Cites

Research works printed but not linked: 89

  1. 10.1042/BJ20120957 · DOI
  2. 10.1016/j.ceb.2013.12.007 · DOI
  3. 10.1016/j.biochi.2015.03.021 · DOI
  4. Goel, D. ; Sinha, S. Naturally occurring protein nano compartments: Basic structure, function, and genetic engineering. In Nano Express, Institute of Physics: 2021; Vol. 2. · DOI
  5. 10.1021/jacs.5b11734 · DOI
  6. 10.1146/annurev.micro.112408.134211 · DOI
  7. 10.1016/j.mib.2021.05.010 · DOI
  8. 10.1146/annurev-biochem-040320-102858 · DOI
  9. 10.1016/j.mib.2021.05.009 · DOI
  10. 10.1016/j.pbi.2016.03.009 · DOI
  11. 10.1111/1462-2920.16283 · DOI
  12. 10.1093/femsle/fnx176 · DOI
  13. 10.1016/j.mib.2021.05.011 · DOI
  14. 10.1016/j.mib.2021.04.008 · DOI
  15. 10.1007/s00253-005-0295-0 · DOI
  16. 10.7554/eLife.46070 · DOI
  17. 10.1016/j.str.2022.01.008 · DOI
  18. 10.7554/eLife.59288 · DOI
  19. 10.1126/sciadv.adk9345 · DOI
  20. 10.1002/pro.5129 · DOI
  21. 10.1038/s41467-024-54175-4 · DOI · Paper page
  22. 10.1073/pnas.2025658118 · DOI
  23. 10.1074/jbc.M114.570119 · DOI
  24. 10.1080/10409238.2017.1337709 · DOI
  25. 10.1002/cbic.202400535 · DOI
  26. 10.1016/J.JSB.2023.108022 · DOI
  27. 10.1038/nsmb.1473 · DOI
  28. 10.1016/j.coviro.2019.02.001 · DOI
  29. 10.1038/s41467-021-25071-y · DOI
  30. 10.1038/s41598-019-56533-5 · DOI
  31. 10.1016/j.mex.2022.101787 · DOI
  32. 10.1021/acs.biomac.2c01424 · DOI
  33. 10.1039/d3tb00288h · DOI
  34. 10.3390/ijms232415591 · DOI
  35. 10.1016/j.synbio.2021.09.001 · DOI
  36. 10.1016/j.vaccine.2018.05.034 · DOI
  37. 10.1002/bit.25159 · DOI
  38. 10.1021/acssynbio.0c00636 · DOI
  39. 10.1021/acssynbio.2c00391 · DOI
  40. 10.1002/wnan.1685 · DOI
  41. 10.1002/bit.27564 · DOI
  42. 10.1021/acsnano.4c08186 · DOI
  43. 10.3390/vaccines12091020 · DOI
  44. 10.1021/acsnano.4c00949 · DOI
  45. 10.1002/anie.202218413 · DOI
  46. 10.1002/anie.202110318 · DOI
  47. 10.1038/nmicrobiol.2017.29 · DOI
  48. 10.1002/pro.5073 · DOI
  49. 10.1016/j.bbrep.2022.101401 · DOI
  50. 10.3390/ijms22115556 · DOI
  51. 10.1038/srep08245 · DOI
  52. 10.1186/s13568-019-0779-4 · DOI
  53. 10.1074/jbc.M706996200 · DOI
  54. 10.1007/s10295-013-1371-6 · DOI · Paper page
  55. Kim, J. S. ; And; Shoda, M. Purification and Characterization of a Novel Peroxidase from Geotrichum candidum Dec 1 Involved in Decolorization of Dyes; 1999. https://journals.asm.org/journal/aem. · DOI · Paper page
  56. 10.1021/bi200427h · DOI
  57. 10.1074/jbc.M115.658807 · DOI · Paper page
  58. 10.1111/j.1742-4658.2011.08161.x · DOI
  59. 10.1111/febs.12234 · DOI
  60. 10.1016/j.crstbi.2020.09.002 · DOI
  61. 10.7554/eLife.74358 · DOI
  62. 10.1002/bab.2015 · DOI
  63. 10.32607/20758251-2011-3-4-38-54 · DOI
  64. 10.1107/S2052252523006437 · DOI
  65. 10.1016/j.copbio.2021.07.011 · DOI
  66. 10.1016/j.chom.2017.01.005 · DOI · Paper page
  67. 10.1128/JB.185.9.2731-2738.2003 · DOI
  68. 10.1128/AEM.00699-13 · DOI
  69. 10.1021/acs.biochem.5b00952 · DOI
  70. 10.1038/s41467-024-46880-x · DOI
  71. Ross, J. ; McIver, Z. ; Lambert, T. ; Piergentili, C. ; Bird, J. E. ; Gallagher, K. J. ; Cruickshank, F. L. ; James, P. ; Zarazúa-Arvizu, E. ; Horsfall, L. E. ;, et al. Pore dynamics and asymmetric cargo loading in an encapsulin nanocompartment; 2022. https://www.science.org. · DOI
  72. 10.1016/S0263-7855(97)00009-X · DOI
  73. 10.3390/ijms22126265 · DOI
  74. 10.1093/nar/gky309 · DOI
  75. 10.1016/j.csbj.2022.07.032 · DOI
  76. 10.1021/acsomega.3c07963 · DOI
  77. Barbosa, C. ; Silveira, C. M. ; Silva, D. ; Brissos, V. ; Hildebrandt, P. ; Martins, L. O. ; Todorovic, S . Immobilized dye-decolorizing peroxidase (DyP) and directed evolution variants for hydrogen peroxide biosensing. Biosensors and bioelectronics 2020, 153, 112055. · DOI
  78. 10.1016/j.abb.2014.12.022 · DOI
  79. 10.1038/nrmicro2128 · DOI · Paper page
  80. 10.1016/0003-2697(71)90375-7 · DOI
  81. 10.1017/s1431927603445911 · DOI
  82. 10.1016/j.jsb.2005.03.010 · DOI
  83. 10.1038/nmeth.4169 · DOI · Paper page
  84. 10.1038/s41586-024-07487-w · DOI · Paper page
  85. 10.1002/pro.3943 · DOI
  86. 10.1107/S2059798319011471 · DOI · Paper page
  87. 10.1107/S0907444910007493 · DOI · Paper page
  88. 10.1038/s41592-022-01488-1 · DOI · Paper page
  89. 10.1016/S0263-7855(97)00009-X · DOI

Metadata

Authors
Ubilla-Rodriguez, N. C., Andreas, M. P., & Giessen, T. W.
Affiliations
University of Michigan (US)
Corresponding author
Giessen, Tobias W.
Venue
Advanced Science
Publisher
openRxiv
Published
2024-11-27
Volume
12
Issue
21
Pages
e2415827-e2415827
ISSN
2198-3844 (ISSN-L)
OpenAlex
W4409086495
Cited by
7
References
1
Citations by year
2026: 5 · 2025: 2
FWCI
1.48
Type
journal article
Language
en
Open access
Locations
  • Advanced Science (publishedVersion, cc-by)
  • bioRxiv (Cold Spring Harbor Laboratory) (acceptedVersion, cc-by-nc)
  • PubMed Central (publishedVersion, cc-by)
  • PubMed (publishedVersion)
  • Deep Blue (University of Michigan) (submittedVersion)
  • PubMed Central (submittedVersion, cc-by-nc)
  • DOAJ (DOAJ: Directory of Open Access Journals) (submittedVersion, cc-by-sa)
Funders
  • National Institutes of Health
  • University of California, San Francisco
  • National Institute of General Medical Sciences (R01GM129325, R35GM133325)
  • National Institute of Allergy and Infectious Diseases
Topics
  • Life Sciences › Biochemistry, Genetics and Molecular Biology › Structural Biology › Enzyme Structure and Function
  • Life Sciences › Biochemistry, Genetics and Molecular Biology › Molecular Biology › Redox biology and oxidative stress
  • Life Sciences › Biochemistry, Genetics and Molecular Biology › Structural Biology › Advanced Electron Microscopy Techniques and Applications
Keywords
encapsulin, dye-decolorizing peroxidase, Enterobacteriaceae, hydrogen peroxide detoxification, oxidative stress resistance, bacterial pathogenicity, cryo-EM structure, cargo loading, pH-dependent catalytic activity

About these checks

Registry, retraction, Cites and statistics results are computed, not judged, with one exception: a printed reference that no index lists is read once by a model before it counts as a citation error. Claims are extracted by a model and kept only when their quote appears verbatim in the text; each cited source is then checked, with a model’s help, for whether it says what the claim relies on. Those verdicts can be wrong — read the claim’s quote and the cited source before relying on one.

Statistics and arithmetic are recomputed, not judged.

Confidence bands are shown only for fields calibrated on our annotated test set. None is calibrated yet, so no band is shown.

What counts as a claim ›How we measure confidence ›How we check this ›

Are you an author, or do you see a problem with this page? Request a review