

The DOI matches its Crossref record; 3 of the 3 references it cites were found in a registry or an index.
Protein Language Model Identifies Disordered, Conserved Motifs Implicated in Phase Separation
Open accessPreprint — published as 10.7554/elife.105309.3 · Paper page
Abstract
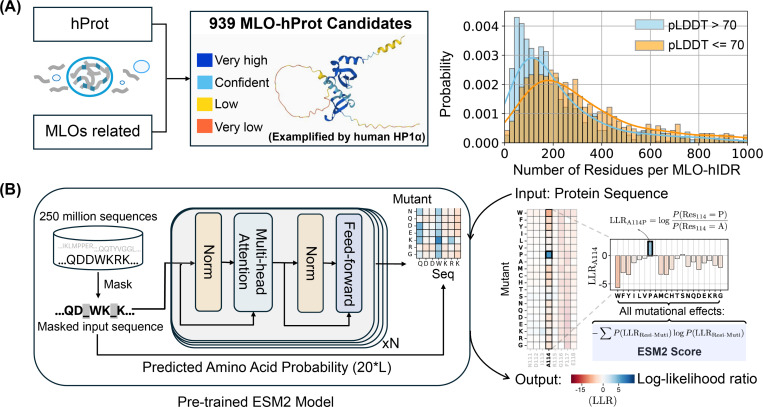
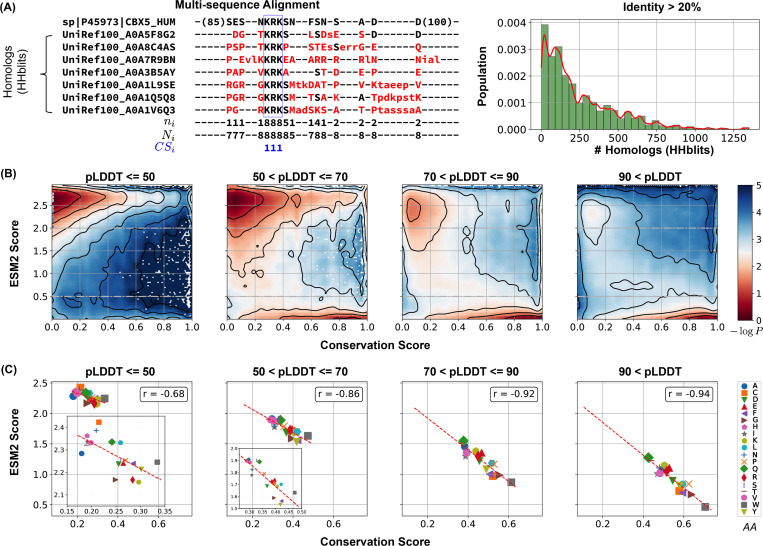
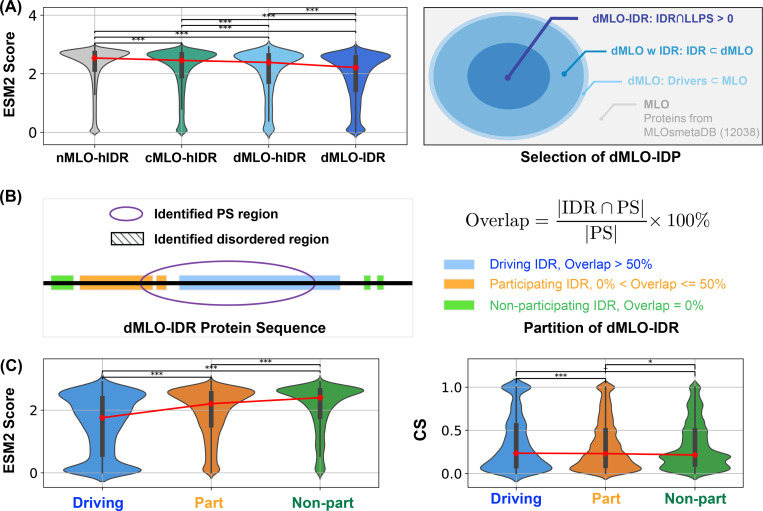
Intrinsically disordered regions (IDRs) play a critical role in phase separation and are essential for the formation of membraneless organelles (MLOs). Mutations within IDRs can disrupt their multivalent interaction networks, altering phase behavior and contributing to various diseases. Therefore, examining the evolutionary constraints of IDRs provides valuable insights into the relationship between protein sequences and phase separation. In this study, we utilized the ESM2 protein language model to map the residue-level mutational tolerance landscapes landscape of IDRs. Our findings reveal that IDRs, particularly those actively participating in phase separation, contain conserved amino acids. This conservation is evident through mutational constraints predicted by ESM2 and supported by direct analyses of multiple sequence alignments. These conserved, disordered amino acids include residues traditionally identified as “stickers” as well as “spacers” and frequently form continuous sequence motifs. The strong conservation, combined with their potential role in phase separation, suggests that these motifs may act as functional units under evolutionary selection to support stable MLO formation. Our findings underscore the insights into phase separation’s molecular grammar made possible through evolutionary analysis enabled by protein language models.
Overview
The claims and statistics of this paper haven’t been checked yet.
Run the check — free, no account needed. It reads the open-access text and checks the sources it cites.
Integrity signals
Registry
Cites
Statistics
Figures
Verification
Claims the paper makes
The claims and statistics of this paper haven’t been checked yet.
Run the check — free, no account needed. It reads the open-access text and checks the sources it cites.
Self-check
Percentages, sums and reported differences re-computed from the paper’s own numbers.
The self-check needs the paper’s full text.
Citations
Cites
Evolutionary-scale prediction of atomic level protein structure with a language model
Lin, Z., Akin, H., Rao, R., Hie, B., Zhu, Z., Lu, W., Smetanin, N., Verkuil, R., Kabeli, O., Shmueli, Y., et al. (2022) · doi:10.1101/2022.07.20.500902 · Cited by 5,990
Varadi, M., Bertoni, D., Magana, P., Paramval, U., Pidruchna, I., Radhakrishnan, M., Tsenkov, M., Nair, S., Mirdita, M., Yeo, J., et al. (2024) · Nucleic Acids Research · doi:10.1093/nar/gkad1011 · Cited by 2,052 · cited 1×
“The pLDDT scores for human proteins were retrieved from the AlphaFold Protein Structure Database 128 by selecting the Homo sapiens organisms (Reference Proteome ID: UP000005640).”
AlphaFold and Implications for Intrinsically Disordered Proteins
Ruff, K. M., & Pappu, R. V. (2021) · Journal of Molecular Biology · doi:10.1016/j.jmb.2021.167208 · Cited by 635 · cited 2×
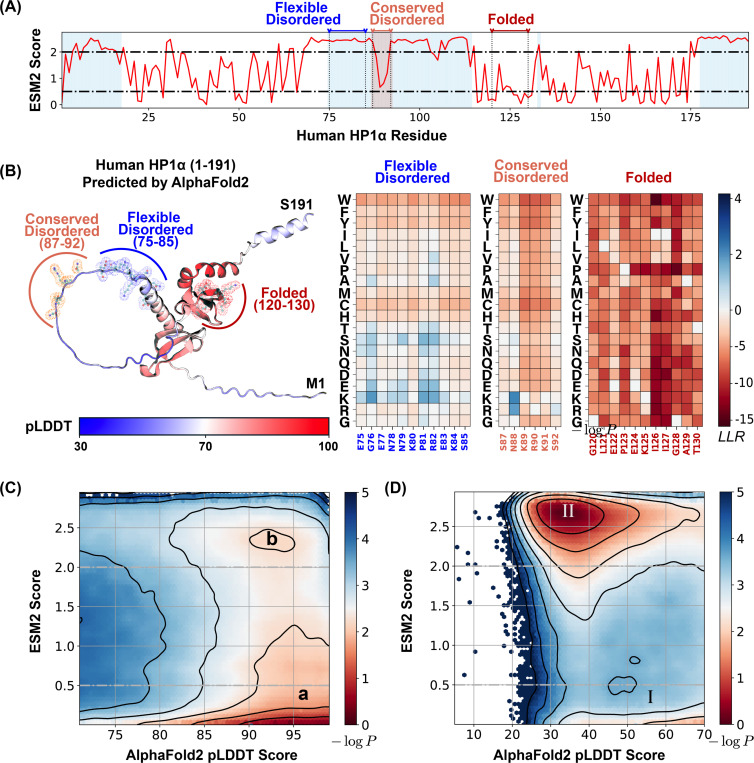
“82,83 We first analyzed the relationship between ESM2 and pLDDT scores for human Hete-rochromatin Protein 1 α (HP1 α , residues 1–191).”
Research works printed but not linked: 128
- 10.1038/s41580-022-00558-8 · DOI
- 10.1038/nrm.2017.7 · DOI
- 10.1146/annurev-biophys-121219-081629 · DOI
- 10.1021/acs.chemrev.2c00814 · DOI
- Ginell, G. M. ; Holehouse, A. S. In Phase-Separated Biomolecular Condensates: Methods and Protocols; Zhou, H.-X. , Spille, J.-H. , Banerjee, P. R. , Eds.; Springer US: New York, NY, 2023; pp 95–116. · DOI
- 2020, Maximum Entropy Optimized Force Field for Intrinsically Disordered Proteins, Journal of Chemical Theory and Computation, 16, 773, 10.1021/acs.jctc.9b00932 · DOI
- 2022, Molecular Determinants for the Layering and Coarsening of Biological Condensates, Aggregate, 3, e306, 10.1002/agt2.306 · DOI
- 2022, Unified Protein Force Field for Simulations of Liquid-Liquid Phase Separation, Biophysical Journal, 121, 356a, 10.1016/j.bpj.2021.11.969 · DOI
- 10.1016/j.bpj.2022.03.028 · DOI
- Latham, A. P. ; Zhu, L. ; Sharon, D. A. ; Ye, S. ; Willard, A. P. ; Zhang, X. ; Zhang, B. Microphase Separation Produces Interfacial Environment within Diblock Biomolecular Condensates. eLife 2024, 12. · DOI
- 2025, Toward Predictive Coarse-Grained Simulations of Biomolecular Condensates, Biochemistry, 64, 1750, 10.1021/acs.biochem.4c00737 · DOI
- 2024, OpenNucleome for High-Resolution Nuclear Structural and Dynamical Modeling, Biophysical Journal, 123, 297a, 10.1016/j.bpj.2023.11.1851 · DOI
- 10.1016/j.cell.2015.08.010 · DOI
- 10.1146/annurev-cellbio-100913-013325 · DOI · Paper page
- 10.1016/j.cell.2016.04.047 · DOI
- 10.1016/j.sbi.2020.09.004 · DOI
- 10.1016/j.molcel.2022.05.018 · DOI
- 2020, Biomolecular Phase Separation: From Molecular Driving Forces to Macroscopic Properties, Annual Review of Physical Chemistry, 71, turoverov
- 10.1016/j.tibs.2019.03.005 · DOI
- 10.1146/annurev-genet-112618-043527 · DOI
- 10.1016/j.devcel.2020.09.014 · DOI · Paper page
- 10.1002/pro.4093 · DOI
- 10.1073/pnas.2008122117 · DOI
- 10.1038/nphys3532 · DOI
- 10.1016/j.sbi.2023.102540 · DOI
- 10.1021/jacs.9b10066 · DOI
- 10.1021/acs.biochem.8b00056 · DOI
- 10.1063/1.1723621 · DOI
- 10.1021/j150415a018 · DOI
- 10.1371/journal.pcbi.1005941 · DOI
- 10.1016/j.coche.2019.03.004 · DOI
- 10.1038/s43588-021-00155-3 · DOI
- 10.1002/pro.4094 · DOI
- 2021, Consistent Force Field Captures Homologue-Resolved HP1 Phase Separation, Journal of Chemical Theory and Computation, 17, 3134, 10.1021/acs.jctc.0c01220 · DOI
- 10.1073/pnas.2111696118 · DOI
- 2021, Simulation of FUS Protein Condensates with an Adapted Coarse-Grained Model, Journal of Chemical Theory and Computation, 17, 525, 10.1021/acs.jctc.0c01064 · DOI
- 2023, Phase Separation of Protein Mixtures Is Driven by the Interplay of Homotypic and Heterotypic Interactions, Nature Communications, 14, 5527, 10.1038/s41467-023-41274-x · DOI
- Lotthammer, J. M. ; Ginell, G. M. ; Griffith, D. ; Emenecker, R. J. ; Holehouse, A. S. Direct Prediction of Intrinsically Disordered Protein Conformational Properties from Sequence. Nature Methods 2024, · DOI
- von Bülow, S. ; Tesei, G. ; Lindorff-Larsen, K. Prediction of Phase Separation Propensities of Disordered Proteins from Sequence. 2024. · DOI
- 10.1021/jacs.3c09195 · DOI
- 2024, Coarse-Grained Models to Study Protein–DNA Interactions and Liquid–Liquid Phase Separation, Journal of Chemical Theory and Computation, 20, 1717, 10.1021/acs.jctc.3c00525 · DOI
- 2023, OpenABC Enables Flexible, Simplified, and Efficient GPU Accelerated Simulations of Biomolecular Condensates, PLOS Computational Biology, 19, e1011442, 10.1371/journal.pcbi.1011442 · DOI
- 10.1016/j.cell.2018.06.006 · DOI
- 10.1021/acs.macromol.8b00661 · DOI
- 10.1371/journal.pcbi.1007028 · DOI
- 10.7554/eLife.62403 · DOI
- Harmon, T. S. ; Holehouse, A. S. ; Rosen, M. K. ; Pappu, R. V. Intrinsically Disordered Linkers Determine the Interplay between Phase Separation and Gelation in Multivalent Proteins. eLife 6, e30294. · DOI · Paper page
- 10.1038/s41557-021-00840-w · DOI
- 2022, Condensates Formed by Prion-like Low-Complexity Domains Have Small-World Network Structures and Interfaces Defined by Expanded Conformations, Nature Communications, 13, 7722, 10.1038/s41467-022-35370-7 · DOI
- 10.7554/eLife.56159 · DOI
- 10.1016/j.bpj.2024.05.026 · DOI
- 10.1371/journal.pone.0288388 · DOI
- 10.1146/annurev-biochem-072711-164947 · DOI · Paper page
- 10.1007/s00239-001-2309-6 · DOI
- 10.1016/j.compbiolchem.2012.10.001 · DOI
- Nunez-Castilla, J. ; Siltberg-Liberles, J. In Intrinsically Disordered Proteins: Methods and Protocols; Kragelund, B. B. , Skriver, K. , Eds.; Springer US: New York, NY, 2020; pp 147–177. · DOI
- 10.1371/journal.pone.0018093 · DOI · Paper page
- 10.1093/bioinformatics/btv663 · DOI
- 2022, The Length Scale of Multivalent Interactions Is Evolutionarily Conserved in Fungal and Vertebrate Phase-Separating Proteins, Genetics, 220, iyab184, 10.1093/genetics/iyab184 · DOI
- 2022, Discovering Molecular Features of Intrinsically Disordered Regions by Using Evolution for Contrastive Learning, PLOS Computational Biology, 18, e1010238, 10.1371/journal.pcbi.1010238 · DOI
- 10.1002/pro.4317 · DOI
- 2021, The Language of Proteins: NLP, Machine Learning & Protein Sequences, Computational and Structural Biotechnology Journal, 19, 1750, 10.1016/j.csbj.2021.03.022 · DOI
- 10.1073/pnas.2016239118 · DOI · Paper page
- 10.1093/bioinformatics/btaa003 · DOI
- 10.1038/s41592-019-0598-1 · DOI · Paper page
- 10.1093/bioinformatics/btac020 · DOI · Paper page
- Boutet, E. ; Lieberherr, D. ; Tognolli, M. ; Schneider, M. ; Bansal, P. ; Bridge, A. J. ; Poux, S. ; Bougueleret, L. ; Xenarios, I. In Plant Bioinformatics: Methods and Protocols; Edwards, D. , Ed.; Springer: New York, NY, 2016; pp 23–54. · DOI
- Vaswani, A. ; Shazeer, N. ; Parmar, N. ; Uszkoreit, J. ; Jones, L. ; Gomez, A. N. ; Kaiser, Ł. ; Polosukhin, I. Attention Is All You Need. Advances in Neural Information Processing Systems. 2017.
- Meier, J. ; Rao, R. ; Verkuil, R. ; Liu, J. ; Sercu, T. ; Rives, A. Language Models Enable Zero-Shot Prediction of the Effects of Mutations on Protein Function. Proceedings of the 35th International Conference on Neural Information Processing Systems. Red Hook, NY, USA, 2024; pp 29287–29303.
- Cagiada, M. ; Jonsson, N. ; Lindorff-Larsen, K. Decoding Molecular Mechanisms for Loss of Function Variants in the Human Proteome. 2024. · DOI
- 2024, Enhancing Missense Variant Pathogenicity Prediction with Protein Language Models Using VariPred, Scientific Reports, 14, 8136, 10.1038/s41598-024-51489-7 · DOI · Paper page
- 2025, Fine-Tuning the ESM2 Protein Language Model to Understand the Functional Impact of Missense Variants, Computational and Structural Biotech-nology Journal, 27, 2199, 10.1016/j.csbj.2025.05.022 · DOI
- 2024, Protein Stability Prediction by Fine-Tuning a Protein Language Model on a Mega-Scale Dataset, PLOS Computational Biology, 20, e1012248, 10.1371/journal.pcbi.1012248 · DOI
- 10.1093/bioinformatics/btae621 · DOI · Paper page
- 2023, THPLM: A Sequence-Based Deep Learning Framework for Protein Stability Changes Prediction upon Point Variations Using Pretrained Protein Language Model, Bioinformatics, 39, btad646, 10.1093/bioinformatics/btad646 · DOI
- 10.1038/s41588-023-01465-0 · DOI
- 2024, Improving Prediction Performance of General Protein Language Model by Domain-Adaptive Pretraining on DNA-binding Protein, Nature Communications, 15, 7838, 10.1038/s41467-024-52293-7 · DOI · Paper page
- Highly Accurate Protein Structure Prediction with AlphaFold | Nature. https://www.nature.com/articles/s41586-021-03819-2#citeas.
- Alderson, T. R. ; Pritišanac, I. ; Kolarić, Ð. ; Moses, A. M. ; Forman-Kay, J. D. Systematic Identification of Conditionally Folded Intrinsically Disordered Regions by AlphaFold2. Proceedings of the National Academy of Sciences of the United States of America 120, e2304302120. · DOI · Paper page
- Larson, A. G. ; Elnatan, D. ; Keenen, M. M. ; Trnka, M. J. ; Johnston, J. B. ; Burlingame, A. L. ; Agard, D. A. ; Redding, S. ; Narlikar, G. J. Liquid Droplet Formation by HP1α Suggests a Role for Phase Separation in Heterochromatin. Nature 2017, dirusso2023, 236–240. · DOI
- 10.1038/s41586-019-1669-2 · DOI
- 10.1073/pnas.2211855120 · DOI
- Brennan, L. ; Kim, H.-K. ; Colmenares, S. ; Ego, T. ; Kumar, A. ; Safran, S. ; Ryu, J.-K. ; Karpen, G. HP1a Promotes Chromatin Liquidity and Drives Spontaneous Heterochromatin Compartmentalization. 2024. · DOI
- 10.1128/MCB.21.7.2555-2569.2001 · DOI
- 10.1007/s00412-004-0324-2 · DOI
- 10.7554/eLife.63972) · DOI
- 10.1038/379096a0 · DOI
- 10.1006/jmbi.1999.3360 · DOI
- 10.1016/j.str.2013.06.020 · DOI
- 10.1016/j.sbi.2011.02.005 · DOI
- 10.1002/pro.2443 · DOI
- 10.1016/j.str.2013.08.001 · DOI
- 10.1186/s12859-016-1375-0 · DOI
- 10.1093/bib/bbac299 · DOI
- 10.1093/bib/bbac502 · DOI
- Sagawa, T. ; Kanao, E. ; Ogata, K. ; Imami, K. ; Ishihama, Y. Prediction of Protein Half-lives from Amino Acid Sequences by Protein Language Models. 2024. · DOI
- 2023, Prediction of Folding Patterns for Intrinsic Disordered Protein, Scientific Reports, 13, 20343, 10.1038/s41598-023-45969-5 · DOI
- 10.1038/s41570-020-0204-1 · DOI
- 2021, Integration of Data from Liquid–Liquid Phase Separation Databases Highlights Concentration and Dosage Sensitivity of LLPS Drivers, International Journal of Molecular Sciences, 22, 3017, 10.3390/ijms22063017 · DOI · Paper page
- 10.1002/pro.4858 · DOI
- 10.1093/nar/gkz848 · DOI
- 10.1093/nar/gkz847 · DOI
- 10.1093/nar/gkz1027 · DOI
- 10.1093/nar/gkz778 · DOI
- 10.1073/pnas.2019053118 · DOI
- 2022, Classification of Proteins Inducing Liquid–Liquid Phase Separation: Sequential, Structural and Functional Characterization, Journal of Biochemistry, 173, 255
- 10.1038/s41557-024-01489-x · DOI
- 10.1042/BST20230618 · DOI
- 10.1073/pnas.2000223117 · DOI
- 10.1016/j.molcel.2016.05.042 · DOI
- 10.1016/j.jmb.2021.167373 · DOI
- 10.1016/j.molcel.2018.02.004 · DOI
- 10.1074/jbc.RA118.006620 · DOI
- 2019, Single Amino Acid Substitutions in Stickers, but Not Spacers, Substantially Alter UBQLN2 Phase Transitions and Dense Phase Material Properties, The Journal of Physical Chemistry B, 123, 3618, 10.1021/acs.jpcb.9b01024 · DOI
- 10.1016/j.jbc.2023.105396 · DOI
- 10.7554/eLife.13571 · DOI
- 2019, Regulation of Zebrafish Dorsoventral Patterning by Phase Separation of RNA-binding Protein Rbm14, Cell Discovery, 5, 1
- 2018, Self-Interaction of NPM1 Modulates Multiple Mechanisms of Liquid–Liquid Phase Separation, Nature Communications, 9, 842, 10.1038/s41467-018-03255-3 · DOI
- 2021, Liquid–Liquid Phase Separation in Human Health and Diseases, Signal Transduction and Targeted Therapy, 6, 1
- 10.1093/nar/gkt1113 · DOI · Paper page
- 10.1093/nar/gkx1153 · DOI · Paper page
- 10.1093/bioinformatics/btac793 · DOI · Paper page
- 2023, CD-CODE: Crowdsourcing Condensate Database and Encyclopedia, Nature Methods, 20, 673, 10.1038/s41592-023-01831-0 · DOI
- 10.1093/bioinformatics/btm098 · DOI · Paper page
- 10.1093/bioinformatics/btu739 · DOI · Paper page
- 10.1038/nmeth.1818 · DOI · Paper page
- 10.1186/s12859-019-3019-7 · DOI · Paper page
- 10.1093/nar/gkw1081 · DOI
Metadata
- Authors
- Zhang, Y., Zheng, J., & Zhang, B.
- Affiliations
- Massachusetts Institute of Technology (US)
- Corresponding author
- Zhang, Bin
- Venue
- eLife
- Publisher
- openRxiv
- Published
- 2024-12-13
- Volume
- 14
- ISSN
- 2050-084X (ISSN-L)
- PMC
- PMC12330624
- OpenAlex
- W4415370047
- Cited by
- 10
- References
- 3
- Citations by year
- 2026: 7 · 2025: 3
- FWCI
- 2.99
- Type
- journal article
- Language
- en
- Open access
- gold
- doi.org
- Licence
- Locations
- eLife (publishedVersion, cc-by)
- bioRxiv (Cold Spring Harbor Laboratory) (acceptedVersion, cc-by)
- PubMed (publishedVersion)
- PubMed Central (submittedVersion, cc-by)
- Funders
- National Institute of General Medical Sciences (R35GM133580)
- Topics
- Life Sciences › Biochemistry, Genetics and Molecular Biology › Molecular Biology › Protein Structure and Dynamics
- Life Sciences › Biochemistry, Genetics and Molecular Biology › Molecular Biology › RNA Research and Splicing
- Life Sciences › Biochemistry, Genetics and Molecular Biology › Molecular Biology › RNA and protein synthesis mechanisms
- Keywords
- intrinsically disordered regions, phase separation, biomolecular condensates, protein language models, ESM-2, mutational tolerance, evolutionary conservation, conserved residues, sequence motifs, multivalent interactions, protein sequence evolution
About these checks
Registry, retraction, Cites and statistics results are computed, not judged, with one exception: a printed reference that no index lists is read once by a model before it counts as a citation error. Claims are extracted by a model and kept only when their quote appears verbatim in the text; each cited source is then checked, with a model’s help, for whether it says what the claim relies on. Those verdicts can be wrong — read the claim’s quote and the cited source before relying on one.
Statistics and arithmetic are recomputed, not judged.
Confidence bands are shown only for fields calibrated on our annotated test set. None is calibrated yet, so no band is shown.
What counts as a claim ›How we measure confidence ›How we check this ›
Are you an author, or do you see a problem with this page? Request a review
