CoChat

Fibroblast growth factor receptor substrate 2 interactome mapping reveals novel candidate interactors associated with migration and invasion

Open access

Preprint — published as 10.1186/s12964-026-02943-8

The DOI matches its Crossref record; 1 of the 1 references it cites were found in a registry or an index.

Abstract

The scaffold protein FRS2 is central to FGFR signaling, linking receptor activation to MAPK/ERK and PI3K/AKT pathways. Elevated FRS2 expression correlates with aggressive tumor phenotypes and poor prognosis across multiple cancers, including the pediatric cerebellar tumor medulloblastoma (MB). Here, we characterized FRS2’s subcellular localization and interactome in MB cells, employing live-cell imaging, phosphoproteomics, immunoprecipitation, and APEX2-based proximity labeling. We found that increased FRS2 expression is associated with increased motile and invasive behavior in MB tumor cells. We furthermore identified novel candidate FRS2-associated proteins involved in actin cytoskeleton remodeling, cell junction assembly, and translation initiation, which indicate a growth factor-dependent reorganization of the FRS2 signalosome. Our data furthermore indicate a regulatory role of FRS2 in directing subcellular distribution of the cell junction and cell motility regulator TJP1. Our findings highlight the relevance of FRS2 as a mediator of cell motility and invasiveness and provide candidate proteins associated with FRS2 that are involved in cellular processes governing migration and invasion. This study thus provides a framework for exploring the FRS2 interactome as a possible target to attenuate FGFR-driven oncogenic processes with next-generation therapeutic strategies.

Overview

The claims and statistics of this paper haven’t been checked yet.

Free: it reads the open-access text and checks the first 5 claims that cite a source we can check. Create a free account to check every claim.

A few free checks a day · papers already verified open instantly · results are public

Integrity signals

Registry

Crossref · 10.1101/2025.09.23.678042

Cites

1 of 1 references verified0 citation errors · 0 not checkable

Statistics

Figures

Fig. 1 FRS2 expression is elevated across multiple cancer types, including MB. A Pie chart showing the absolute number of TCGA PanCancer Atlas tumor samples with increased FRS2 levels. A Z-score threshold of ± 2, relative to mean expression in diploid samples, was applied as the cutoff for panels A–C. B Relative frequency of FRS2 overexpression across tumor diagnoses. C Absolute frequency of FRS2 genomic alteration types in cancer patients. D FRS2 expression from bulk RNA-seq data across the human lifespan in the brain (left) and cerebellum (right). The x-axis denotes age in years; the vertical dashed line marks birth. The y-axis shows expression values in reads per kilobase of transcript per million mapped reads (RPKM). E Comparative analysis of FRS2 and FRS3 mRNA abundance in normal cerebellum versus MB tumor tissue and other brain regions, performed on the Affymetrix U133P2 platform. Statistical comparisons were made using one-way ANOVA with Kruskal–Wallis and Dunn’s multiple comparisons tests; significance is indicated as follows: ns p ≥ 0.05, *p ≤ 0.0332, **p ≤ 0.0021, ***p ≤ 0.0002, ****p ≤ 0.0001. F FRS2 and FRS3 mRNA abundance in non-metastatic MB patients (M0) versus patients with tumor cells detectable in the cerebrospinal fluid (M1), assessed by unpaired two-tailed Mann–Whitney test (ns: p > 0.05). G FRS2 and FRS3 mRNA expression across the 12 MB molecular subtypes defined in the Cavalli dataset [21]
Fig. 1 FRS2 expression is elevated across multiple cancer types, including MB. A Pie chart showing the absolute number of TCGA PanCancer Atlas tumor samples with increased FRS2 levels. A Z-score threshold of ± 2, relative to mean expression in diploid samples, was applied as the cutoff for panels A–C. B Relative frequency of FRS2 overexpression across tumor diagnoses. C Absolute frequency of FRS2 genomic alteration types in cancer patients. D FRS2 expression from bulk RNA-seq data across the human lifespan in the brain (left) and cerebellum (right). The x-axis denotes age in years; the vertical dashed line marks birth. The y-axis shows expression values in reads per kilobase of transcript per million mapped reads (RPKM). E Comparative analysis of FRS2 and FRS3 mRNA abundance in normal cerebellum versus MB tumor tissue and other brain regions, performed on the Affymetrix U133P2 platform. Statistical comparisons were made using one-way ANOVA with Kruskal–Wallis and Dunn’s multiple comparisons tests; significance is indicated as follows: ns p ≥ 0.05, *p ≤ 0.0332, **p ≤ 0.0021, ***p ≤ 0.0002, ****p ≤ 0.0001. F FRS2 and FRS3 mRNA abundance in non-metastatic MB patients (M0) versus patients with tumor cells detectable in the cerebrospinal fluid (M1), assessed by unpaired two-tailed Mann–Whitney test (ns: p > 0.05). G FRS2 and FRS3 mRNA expression across the 12 MB molecular subtypes defined in the Cavalli dataset [21]CC BY · PubMed Central
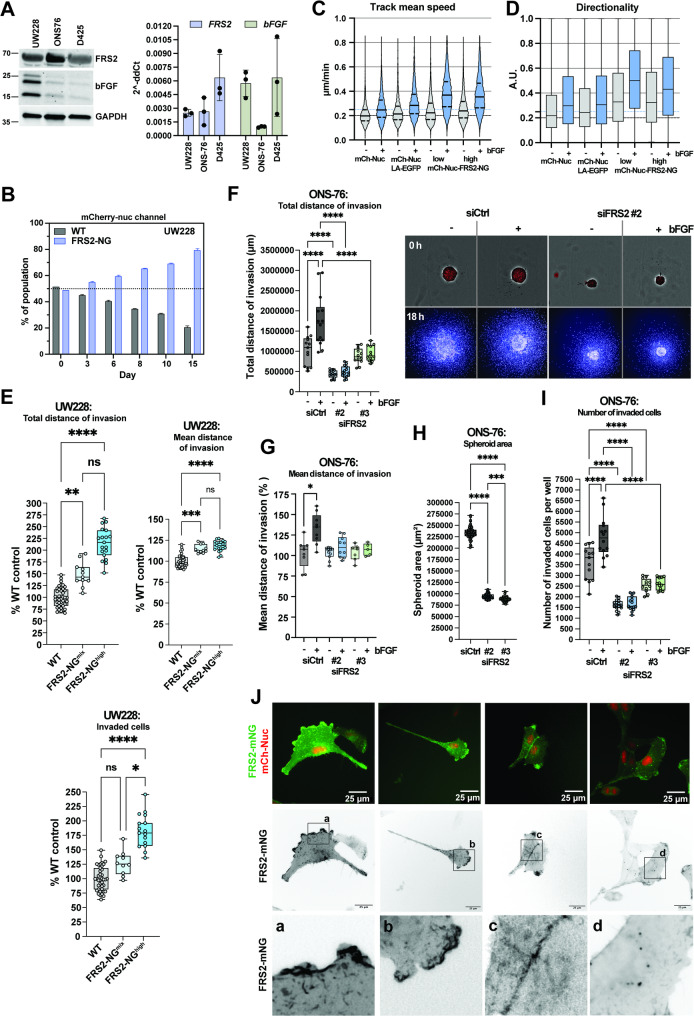
Fig. 2 Elevated FRS2 expression is associated with increased proliferation, 2D migration, and 3D collagen invasion in MB cell lines. A IB and RT-qPCR analyses of FRS2 and bFGF expression in UW228, ONS-76, and D425 MB cells. B Proliferation competition assay in which wild-type UW228 and UW228 FRS2-mNG/mCherry-Nuc (mCh-Nuc) cells were grown in co-culture. The relative proportion of FRS2-mNG-positive cells was monitored over two weeks by flow cytometry using the mCh-Nuc signal. C Mean track speed and (D) directionality from live-cell tracking of UW228 mCh-Nuc (−bFGF: n = 4’601; +bFGF: n = 4’746), UW228 mCh-Nuc/LA-EGFP (−bFGF: n = 4’403; +bFGF: n = 4’729), and UW228 mCh-Nuc/FRS2-mNG cells (mixed −bFGF: n = 9’660; mixed +bFGF: n = 12’052; high FRS2 −bFGF: n = 8’195; high FRS2 +bFGF: n = 8’283), in the presence or absence of 50 ng/mL bFGF. E Invasiveness of wild-type UW228 versus FRS2-mNG-expressing UW228 cells assessed in serum-free medium over 24 h. Total invasion distance is calculated as the sum of individual invasion distances multiplied by the number of invading cells. Dots represent individual spheroids (each comprising >2,500 cells) from technical replicates of n = 1 experiment. F Left: Total invasion distance of ONS-76 cells transfected with siCtrl or siFRS2. Right: Representative images of spheroids prior to collagen I embedding (upper panels, brightfield with segmentation overlay) and 18 h after embedding (lower panels). Nuclei are labeled with Hoechst and computationally segmented. G Mean invasion distance of ONS-76 cells transfected with siCtrl or two independent FRS2 siRNAs. H Spheroid area (µm²) at the time of collagen matrix embedding, 48 h post-transfection. I Total number of invading ONS-76 cells after siRNA transfection. J Representative fluorescence live-imaging stills of UW228 cells co-expressing FRS2-mNG and mCh-Nuc on collagen I-coated surfaces. Panels a–d show magnified views of regions indicated by black rectangles in inverted greyscale images of the mNG channel, illustrating FRS2-mNG localization at the leading edge (columns 1–2), cell–cell contacts (column 3), and intracellular vesicles (column 4). Scale bar, 25 µm. Statistical comparisons were performed using one-way ANOVA with multiple comparisons correction; significance is indicated as follows: *p ≤ 0.05, **p ≤ 0.01, ***p ≤ 0.001, ****p ≤ 0.0001
Fig. 2 Elevated FRS2 expression is associated with increased proliferation, 2D migration, and 3D collagen invasion in MB cell lines. A IB and RT-qPCR analyses of FRS2 and bFGF expression in UW228, ONS-76, and D425 MB cells. B Proliferation competition assay in which wild-type UW228 and UW228 FRS2-mNG/mCherry-Nuc (mCh-Nuc) cells were grown in co-culture. The relative proportion of FRS2-mNG-positive cells was monitored over two weeks by flow cytometry using the mCh-Nuc signal. C Mean track speed and (D) directionality from live-cell tracking of UW228 mCh-Nuc (−bFGF: n = 4’601; +bFGF: n = 4’746), UW228 mCh-Nuc/LA-EGFP (−bFGF: n = 4’403; +bFGF: n = 4’729), and UW228 mCh-Nuc/FRS2-mNG cells (mixed −bFGF: n = 9’660; mixed +bFGF: n = 12’052; high FRS2 −bFGF: n = 8’195; high FRS2 +bFGF: n = 8’283), in the presence or absence of 50 ng/mL bFGF. E Invasiveness of wild-type UW228 versus FRS2-mNG-expressing UW228 cells assessed in serum-free medium over 24 h. Total invasion distance is calculated as the sum of individual invasion distances multiplied by the number of invading cells. Dots represent individual spheroids (each comprising >2,500 cells) from technical replicates of n = 1 experiment. F Left: Total invasion distance of ONS-76 cells transfected with siCtrl or siFRS2. Right: Representative images of spheroids prior to collagen I embedding (upper panels, brightfield with segmentation overlay) and 18 h after embedding (lower panels). Nuclei are labeled with Hoechst and computationally segmented. G Mean invasion distance of ONS-76 cells transfected with siCtrl or two independent FRS2 siRNAs. H Spheroid area (µm²) at the time of collagen matrix embedding, 48 h post-transfection. I Total number of invading ONS-76 cells after siRNA transfection. J Representative fluorescence live-imaging stills of UW228 cells co-expressing FRS2-mNG and mCh-Nuc on collagen I-coated surfaces. Panels a–d show magnified views of regions indicated by black rectangles in inverted greyscale images of the mNG channel, illustrating FRS2-mNG localization at the leading edge (columns 1–2), cell–cell contacts (column 3), and intracellular vesicles (column 4). Scale bar, 25 µm. Statistical comparisons were performed using one-way ANOVA with multiple comparisons correction; significance is indicated as follows: *p ≤ 0.05, **p ≤ 0.01, ***p ≤ 0.001, ****p ≤ 0.0001CC BY · PubMed Central
Fig. 3 Canonical FGFR signaling is active in growth factor-stimulated MB cells and associated with the assembly of an FRS2-dependent signalosome. A IB analysis of D425 MB cells stimulated with 50 ng/mL bFGF for 5 min. The phosphorylation of FRS2 (Y436) and its interaction partners GAB1 (Y627) and SHP2 (Y580, Y542) as well as the activation of ERK1/2 (T202, Y204) and AKT (S473) pathways was detected using phosphospecific antibodies. B Vulcano plot of phosphoproteomic changes in D425 cells after 5 min stimulation with 50 ng/mL bFGF (n=3 biological replicates). Significantly downregulated sites (FDR ≤ 0.1, log2FC ≤ –0.6) are highlighted in blue and significantly upregulated (FDR ≤ 0.1, log2FC ≥ 0.6) in red. Phosphosites belonging to FGFR pathway members are indicated in blue. C Schematic of FRS2-dependent canonical FGFR signaling, encompassing the MAPK/ERK and PI3K/AKT branches. Kinases with bFGF-sensitive phospho sites are shown in blue. D IB of the eluate fraction of mNeonGreen-Trap IP performed in wild-type UW228 and FRS2-mNG-expressing UW228 cells (± 50 ng/mL bFGF, 5 min). E Vulcano plot of FRS2-mNG co-precipitated proteins identified by mass spectrometry. Significantly enriched proteins (FDR ≤ 0.05, log2FC ≥ 1) are highlighted in blue (n=3 biological replicates). F Venn diagram comparing proteins enriched in the FRS2-mNG co-IP (excluding mNeonGreen but including FRS2) with previously reported FRS2 interactors catalogued in the BioGRID database. G STRING network analysis of FRS2-mNG co-precipitated proteins, highlighting distinct interaction clusters among predicted FRS2-associated candidates.
Fig. 3 Canonical FGFR signaling is active in growth factor-stimulated MB cells and associated with the assembly of an FRS2-dependent signalosome. A IB analysis of D425 MB cells stimulated with 50 ng/mL bFGF for 5 min. The phosphorylation of FRS2 (Y436) and its interaction partners GAB1 (Y627) and SHP2 (Y580, Y542) as well as the activation of ERK1/2 (T202, Y204) and AKT (S473) pathways was detected using phosphospecific antibodies. B Vulcano plot of phosphoproteomic changes in D425 cells after 5 min stimulation with 50 ng/mL bFGF (n=3 biological replicates). Significantly downregulated sites (FDR ≤ 0.1, log2FC ≤ –0.6) are highlighted in blue and significantly upregulated (FDR ≤ 0.1, log2FC ≥ 0.6) in red. Phosphosites belonging to FGFR pathway members are indicated in blue. C Schematic of FRS2-dependent canonical FGFR signaling, encompassing the MAPK/ERK and PI3K/AKT branches. Kinases with bFGF-sensitive phospho sites are shown in blue. D IB of the eluate fraction of mNeonGreen-Trap IP performed in wild-type UW228 and FRS2-mNG-expressing UW228 cells (± 50 ng/mL bFGF, 5 min). E Vulcano plot of FRS2-mNG co-precipitated proteins identified by mass spectrometry. Significantly enriched proteins (FDR ≤ 0.05, log2FC ≥ 1) are highlighted in blue (n=3 biological replicates). F Venn diagram comparing proteins enriched in the FRS2-mNG co-IP (excluding mNeonGreen but including FRS2) with previously reported FRS2 interactors catalogued in the BioGRID database. G STRING network analysis of FRS2-mNG co-precipitated proteins, highlighting distinct interaction clusters among predicted FRS2-associated candidates.CC BY · PubMed Central
Fig. 4 Identification of proteins in FRS2 proximal proteome using APEX2-based proximity labeling. A Left: Cartoon depicting the fusion of an APEX2 peroxidase enzyme to the C-terminal end of FRS2 and the assumed proximity labeling range using biotin-phenoxyl radicals. Right: Immunofluorescence analysis of subcellular localization of FRS2-APEX2-V5 and FRS2-mNG in UW228 cells. B Comparative IB analysis of FRS2-APEX2-V5 expression and Biotin-HRP detection of biotinylated proteins after H2O2-treatment. C IB analysis of bFGF-induced phosphorylation of FRS2 (Y436) and ERK1/2 (T202, Y204) in WT and FRS2-APEX2-V5 (F-APX)-expressing UW228 cells. Fold change (FC) of endogenous FRS2 and F-APX phosphorylation and of pERK are shown. WT and F-APX without bFGF stimulation were used as baseline to calculate FC after bFGF stimulation. D Vulcano plot of proteins enriched in FRS2-APEX2-based proximity labeling assay in serum-free culture conditions (SFM). Significantly enriched proteins (FDR ≤ 0.05, log2FC ≥ 1) are shown in light blue. The bait control proteins FRS2 and APEX2 are shown in black (n=3 biological replicates). E Over representation analysis depicting enriched gene ontology terms (biological processes) of FRS2-APEX2-V5 labeled proteins. F Vulcano plot of FRS2-APEX2-V5 labeled proteins in bFGF-stimulated conditions (50 ng/mL bFGF stimulation for 5 min). Significantly enriched proteins (FDR ≤ 0.05, log2 FC ≥ 1) are shown in blue (n=3 biological replicates). Dots of proteins significantly enriched in the presence of bFGF are colored dark blue. The bait control proteins FRS2 and APEX2 are shown in black. G Venn diagram of proximity-labeled proteins detected in serum-free (SFM) and bFGF-stimulated (bFGF) conditions. FRS2 and APEX2 are included (overlapping fraction).
Fig. 4 Identification of proteins in FRS2 proximal proteome using APEX2-based proximity labeling. A Left: Cartoon depicting the fusion of an APEX2 peroxidase enzyme to the C-terminal end of FRS2 and the assumed proximity labeling range using biotin-phenoxyl radicals. Right: Immunofluorescence analysis of subcellular localization of FRS2-APEX2-V5 and FRS2-mNG in UW228 cells. B Comparative IB analysis of FRS2-APEX2-V5 expression and Biotin-HRP detection of biotinylated proteins after H2O2-treatment. C IB analysis of bFGF-induced phosphorylation of FRS2 (Y436) and ERK1/2 (T202, Y204) in WT and FRS2-APEX2-V5 (F-APX)-expressing UW228 cells. Fold change (FC) of endogenous FRS2 and F-APX phosphorylation and of pERK are shown. WT and F-APX without bFGF stimulation were used as baseline to calculate FC after bFGF stimulation. D Vulcano plot of proteins enriched in FRS2-APEX2-based proximity labeling assay in serum-free culture conditions (SFM). Significantly enriched proteins (FDR ≤ 0.05, log2FC ≥ 1) are shown in light blue. The bait control proteins FRS2 and APEX2 are shown in black (n=3 biological replicates). E Over representation analysis depicting enriched gene ontology terms (biological processes) of FRS2-APEX2-V5 labeled proteins. F Vulcano plot of FRS2-APEX2-V5 labeled proteins in bFGF-stimulated conditions (50 ng/mL bFGF stimulation for 5 min). Significantly enriched proteins (FDR ≤ 0.05, log2 FC ≥ 1) are shown in blue (n=3 biological replicates). Dots of proteins significantly enriched in the presence of bFGF are colored dark blue. The bait control proteins FRS2 and APEX2 are shown in black. G Venn diagram of proximity-labeled proteins detected in serum-free (SFM) and bFGF-stimulated (bFGF) conditions. FRS2 and APEX2 are included (overlapping fraction).CC BY · PubMed Central
Fig. 5 FRS2 connects FGFR signaling to cytoskeletal organization, intracellular transport, and translation initiation. A STRING protein network analysis of FRS2 interactor candidates identified by co-immunoprecipitation (star-shaped nodes) and APEX2 proximity labeling. B IB analysis of proteins co-immunoprecipitated with FRS2-mNG. Input, post-IP supernatant, and eluate fractions were probed with the indicated antibodies. Numbers below each panel represent the fold change in integrated density of the eluate from bFGF-stimulated cells relative to unstimulated controls. C–E Immunofluorescence analysis of PDLIM1 (C), WASF2 (D), and TJP1 (E) in UW228 cells expressing FRS2-mNG
Fig. 5 FRS2 connects FGFR signaling to cytoskeletal organization, intracellular transport, and translation initiation. A STRING protein network analysis of FRS2 interactor candidates identified by co-immunoprecipitation (star-shaped nodes) and APEX2 proximity labeling. B IB analysis of proteins co-immunoprecipitated with FRS2-mNG. Input, post-IP supernatant, and eluate fractions were probed with the indicated antibodies. Numbers below each panel represent the fold change in integrated density of the eluate from bFGF-stimulated cells relative to unstimulated controls. C–E Immunofluorescence analysis of PDLIM1 (C), WASF2 (D), and TJP1 (E) in UW228 cells expressing FRS2-mNGCC BY · PubMed Central
Fig. 6 FRS2 is required for TJP1 clustering following bFGF stimulation. A Confocal immunofluorescence imaging of HAP1 WT and HAP1 FRS2-KO cells stimulated with 50 ng/mL bFGF for 1 h. Green: F-actin (phalloidin); red: TJP1; blue: DNA (DAPI). Inverted greyscale images of each fluorescence channel are shown separately. B Orthogonal cross-section through confocal image stacks of HAP1 WT and HAP1 FRS2-KO cells stimulated with bFGF, as shown in (A). White arrows indicate basally clustered TJP1 between adjacent cell nuclei. C Quantification of TJP1 clustering. Clustered TJP1 signal intensity was quantified as the mean pixel intensity within a 20 × 20 pixel region of interest encompassing each TJP1 cluster (n = 81 per condition; n = 1 experiment). Center: Box plots showing the median and distribution of measurements across the four conditions. Statistical significance was assessed by one-way ANOVA with Kruskal–Wallis test. Significance is indicated as follows: ns p ≥ 0.05, ***p ≤ 0.0009, ****p <0.0001. Right: Frequency distribution of mean intensities for each condition. D Z-scores of TJP1 mRNA expression in two control datasets (normal brain regions and cerebellum, shown in green) and six primary MB patient datasets (shown in blue), analyzed on the Affymetrix U133P2 platform. Significant differences relative to the healthy cerebellum control were assessed by one-way ANOVA with Kruskal–Wallis and Dunn's multiple comparisons tests; significance is indicated as follows: ns p ≥ 0.05, *p ≤ 0.0332, **p ≤ 0.0021, ***p ≤ 0.0002, ****p ≤ 0.0001. E Left: Z-scores of TJP1 expression in cerebellar control (n = 109) and MB tumor samples (n = 1’314). Right: Z-scores of TJP1 expression in non-metastatic MB patients (M0) versus patients with tumor cells detectable in the cerebrospinal fluid (M+; Swartling dataset, GSE124814, n = 1’641). Statistical significance was assessed by unpaired two-tailed Mann–Whitney test: ns p ≥ 0.05, ****p ≤ 0.0001. F Kaplan–Meier curves of overall survival in MB patients stratified by high (red) or low (blue) TJP1 expression, derived from the PanCancer database. G Correlation plots of FRS2 versus TJP1 mRNA expression Z-scores across MB subgroups, with linear trendlines shown in blue
Fig. 6 FRS2 is required for TJP1 clustering following bFGF stimulation. A Confocal immunofluorescence imaging of HAP1 WT and HAP1 FRS2-KO cells stimulated with 50 ng/mL bFGF for 1 h. Green: F-actin (phalloidin); red: TJP1; blue: DNA (DAPI). Inverted greyscale images of each fluorescence channel are shown separately. B Orthogonal cross-section through confocal image stacks of HAP1 WT and HAP1 FRS2-KO cells stimulated with bFGF, as shown in (A). White arrows indicate basally clustered TJP1 between adjacent cell nuclei. C Quantification of TJP1 clustering. Clustered TJP1 signal intensity was quantified as the mean pixel intensity within a 20 × 20 pixel region of interest encompassing each TJP1 cluster (n = 81 per condition; n = 1 experiment). Center: Box plots showing the median and distribution of measurements across the four conditions. Statistical significance was assessed by one-way ANOVA with Kruskal–Wallis test. Significance is indicated as follows: ns p ≥ 0.05, ***p ≤ 0.0009, ****p <0.0001. Right: Frequency distribution of mean intensities for each condition. D Z-scores of TJP1 mRNA expression in two control datasets (normal brain regions and cerebellum, shown in green) and six primary MB patient datasets (shown in blue), analyzed on the Affymetrix U133P2 platform. Significant differences relative to the healthy cerebellum control were assessed by one-way ANOVA with Kruskal–Wallis and Dunn's multiple comparisons tests; significance is indicated as follows: ns p ≥ 0.05, *p ≤ 0.0332, **p ≤ 0.0021, ***p ≤ 0.0002, ****p ≤ 0.0001. E Left: Z-scores of TJP1 expression in cerebellar control (n = 109) and MB tumor samples (n = 1’314). Right: Z-scores of TJP1 expression in non-metastatic MB patients (M0) versus patients with tumor cells detectable in the cerebrospinal fluid (M+; Swartling dataset, GSE124814, n = 1’641). Statistical significance was assessed by unpaired two-tailed Mann–Whitney test: ns p ≥ 0.05, ****p ≤ 0.0001. F Kaplan–Meier curves of overall survival in MB patients stratified by high (red) or low (blue) TJP1 expression, derived from the PanCancer database. G Correlation plots of FRS2 versus TJP1 mRNA expression Z-scores across MB subgroups, with linear trendlines shown in blueCC BY · PubMed Central

Verification

Claims the paper makes

The claims and statistics of this paper haven’t been checked yet.

Free: it reads the open-access text and checks the first 5 claims that cite a source we can check. Create a free account to check every claim.

A few free checks a day · papers already verified open instantly · results are public

Self-check

Percentages, sums and reported differences re-computed from the paper’s own numbers.

The self-check needs the paper’s full text.

Citations

Cites

Show all 1 references

Research works printed but not linked: 68

  1. 10.1016/j.cell.2010.06.011 · DOI · Paper page
  2. 10.1007/s10495-013-0886-7 · DOI · Paper page
  3. 10.1016/j.chembiol.2014.05.013 · DOI · Paper page
  4. 10.1371/journal.pone.0017538 · DOI
  5. 10.1073/pnas.161259898 · DOI · Paper page
  6. 10.1016/S0092-8674(00)80252-4 · DOI · Paper page
  7. 10.1128/MCB.20.3.979-989.2000 · DOI · Paper page
  8. 10.1128/MCB.18.7.3966 · DOI · Paper page
  9. 10.1016/j.celrep.2018.05.083 · DOI · Paper page
  10. 10.1158/1541-7786.MCR-07-0283 · DOI
  11. 10.1158/0008-5472.CAN-12-2086 · DOI · Paper page
  12. 10.1186/s13000-021-01161-9 · DOI
  13. 10.1158/1541-7786.MCR-14-0407 · DOI
  14. 10.1242/dev.009910 · DOI
  15. 10.1074/jbc.M411356200 · DOI · Paper page
  16. 10.1371/journal.pone.0029739 · DOI
  17. 10.1074/jbc.M409230200 · DOI
  18. 10.1038/s41467-019-12507-9 · DOI · Paper page
  19. 10.1038/s41586-021-03592-2 · DOI · Paper page
  20. 10.1093/bioinformatics/btz066 · DOI
  21. 10.1016/j.ccell.2017.05.005 · DOI · Paper page
  22. 10.1038/nmeth.3179 · DOI · Paper page
  23. 10.1038/srep15338 · DOI
  24. 10.1006/meth.2001.1262 · DOI · Paper page
  25. 10.1038/nmeth.1322 · DOI · Paper page
  26. 10.1145/1739041.1739135 · DOI · Paper page
  27. 10.1021/acs.jproteome.2c00441 · DOI
  28. 10.1093/nar/gkv007 · DOI · Paper page
  29. 10.1038/s41592-019-0638-x · DOI · Paper page
  30. 10.1016/j.jprot.2013.10.023 · DOI · Paper page
  31. 10.1016/j.xpro.2020.100074 · DOI
  32. 10.1074/jbc.273.29.17987 · DOI · Paper page
  33. 10.1111/j.1349-7006.2008.00840.x · DOI · Paper page
  34. 10.3390/cancers11121985 · DOI
  35. 10.1007/s13402-022-00753-x · DOI
  36. 10.1038/s41586-019-1338-5 · DOI · Paper page
  37. 10.1038/s42003-022-03708-y · DOI
  38. 10.1038/nprot.2016.018 · DOI · Paper page
  39. 10.1016/j.cell.2019.10.011 · DOI · Paper page
  40. 10.1016/S1097-2765(02)00689-5 · DOI · Paper page
  41. 10.1016/j.cellsig.2006.06.003 · DOI
  42. 10.1074/jbc.274.14.9861 · DOI · Paper page
  43. 10.1128/MCB.21.13.4177-4187.2001 · DOI · Paper page
  44. 10.1038/sj.onc.1204290 · DOI
  45. 10.1152/ajplung.00372.2001 · DOI · Paper page
  46. 10.1038/nsb1294-898 · DOI
  47. 10.1016/j.molcel.2011.02.031 · DOI · Paper page
  48. 10.1091/mbc.E19-12-0705 · DOI
  49. 10.1038/ncb1125 · DOI · Paper page
  50. 10.1182/blood.V96.13.4236 · DOI · Paper page
  51. 10.1083/jcb.140.6.1383 · DOI · Paper page
  52. 10.1074/jbc.275.15.11100 · DOI · Paper page
  53. 10.1016/j.bbrc.2007.10.064 · DOI · Paper page
  54. 10.1073/pnas.0507021102 · DOI · Paper page
  55. 10.1006/bbrc.1999.0894 · DOI · Paper page
  56. 10.1016/j.cellsig.2017.10.003 · DOI
  57. 10.1038/sj.embor.7401097 · DOI
  58. 10.3390/ijms26052090 · DOI
  59. 10.1093/emboj/20.16.4370 · DOI · Paper page
  60. 10.1016/j.cell.2005.10.024 · DOI · Paper page
  61. 10.1186/s12964-020-00607-9 · DOI
  62. 10.1016/j.devcel.2020.10.006 · doi:10.1016/j.devcel.2020.10.006
  63. 10.1074/jbc.M210245200 · DOI
  64. 10.3892/ol.2018.9466 · DOI
  65. 10.1517/14728220902942330 · DOI
  66. 10.1074/jbc.RA117.000940 · DOI
  67. 10.1016/j.cpt.2022.12.004 · DOI
  68. 10.1016/j.ijbiomac.2025.142478 · DOI

Metadata

Authors
Kopp, L. L., Versamento, D., Ciraulo, B., Schönholzer, M. T., Hochuli, D., Lin, M.-S., & Baumgartner, M.
Affiliations
University Children's Hospital Zurich (CH)
Corresponding author
Baumgartner, Martin
Venue
Cell Communication and Signaling
Publisher
openRxiv
Published
2025-09-25
Volume
24
Issue
1
ISSN
1478-811X (ISSN-L)
OpenAlex
W7161983233
Cited by
0
References
1
FWCI
0.00
Type
journal article
Language
en
Open access
Locations
  • Cell Communication and Signaling (publishedVersion, cc-by)
  • bioRxiv (Cold Spring Harbor Laboratory) (acceptedVersion, cc-by)
  • PubMed (publishedVersion)
  • PubMed Central (publishedVersion, cc-by)
  • DOAJ (DOAJ: Directory of Open Access Journals) (submittedVersion)
Funders
Childhood Cancer Research Foundation Switzerland (n.a.)
Topics
  • Life Sciences › Biochemistry, Genetics and Molecular Biology › Molecular Biology › Fibroblast Growth Factor Research
  • Life Sciences › Biochemistry, Genetics and Molecular Biology › Cell Biology › Biotin and Related Studies
  • Life Sciences › Biochemistry, Genetics and Molecular Biology › Molecular Biology › Protein Kinase Regulation and GTPase Signaling
Keywords
FRS2, fibroblast growth factor receptor signaling, medulloblastoma, protein-protein interaction network, cell migration, tumor invasion, cell junctions, TJP1, actin cytoskeleton remodeling, translation initiation, subcellular localization, signalosome
MeSH terms
Cell Movement, Humans, Medulloblastoma, Membrane Proteins, Neoplasm Invasiveness, Protein Binding, Signal Transduction, Protein Interaction Mapping, Cell Line, Tumor, Adaptor Proteins, Signal Transducing

About these checks

Registry, retraction, Cites and statistics results are computed, not judged, with one exception: a printed reference that no index lists is read once by a model before it counts as a citation error. Claims are extracted by a model and kept only when their quote appears verbatim in the text; each cited source is then checked, with a model’s help, for whether it says what the claim relies on. Those verdicts can be wrong — read the claim’s quote and the cited source before relying on one.

Statistics and arithmetic are recomputed, not judged.

Confidence bands are shown only for fields calibrated on our annotated test set. None is calibrated yet, so no band is shown.

What counts as a claim ›How we measure confidence ›How we check this ›

Are you an author, or do you see a problem with this page? Request a review

How to cite

Cite CoChat for the checks on this page, and the paper for its own findings.

This page
CoChat. (2026). Citation check: Fibroblast growth factor receptor substrate 2 interactome mapping reveals novel candidate interactors associated with migration and invasion. https://app.cochat.ai/papers/10.1101/2025.09.23.678042
The paper
Kopp, L. L., Versamento, D., Ciraulo, B., Schönholzer, M. T., Hochuli, D., Lin, M.-S., & Baumgartner, M. (2025). Fibroblast growth factor receptor substrate 2 interactome mapping reveals novel candidate interactors associated with migration and invasion. Cell Communication and Signaling. https://doi.org/10.1101/2025.09.23.678042

Data sources

Bibliographic data: Semantic Scholar, OpenAlex, Crossref.

Contains information from the Semantic Scholar Academic Graph Datasets, made available under the ODC Attribution License (ODC-BY 1.0).

Semantic Scholar’s data is described in: Kinney, R., et al. (2023). The Semantic Scholar Open Data Platform. arXiv:2301.10140.