Student or educator? Sign up with your school email and get 6 months of Pro free.
Cited by 240

The DOI matches its Crossref record; 7 of the 7 references it cites were found in a registry or an index.

Social insect genomes exhibit dramatic evolution in gene composition and regulation while preserving regulatory features linked to sociality

Simola, Daniel F., Wissler, Lothar, Donahue, Greg, Waterhouse, Robert M., Helmkampf, Martin, Roux, Julien, Nygaard, Sanne, Glastad, Karl M., Hagen, Darren E., Viljakainen, Lumi, Reese, Justin T., Hunt, Brendan G., Graur, Dan, Elhaik, Eran, Kriventseva, Evgenia V., Wen, Jiayu, Parker, Brian J., Cash, Elizabeth, Privman, Eyal, Childers, Christopher P., Muñoz-Torres, Monica C., Boomsma, Jacobus J., Bornberg-Bauer, Erich, Currie, Cameron R., Elsik, Christine G., Suen, Garret, Goodisman, Michael A.D., Keller, Laurent, Liebig, Jürgen, Rawls, Alan, Reinberg, Danny, Smith, Chris D., Smith, Chris R., Tsutsui, Neil, Wurm, Yannick, Zdobnov, Evgeny M., Berger, Shelley L., Gadau, Jürgen·2013·Genome Research

Abstract

Genomes of eusocial insects code for dramatic examples of phenotypic plasticity and social organization. We compared the genomes of seven ants, the honeybee, and various solitary insects to examine whether eusocial lineages share distinct features of genomic organization. Each ant lineage contains ∼4000 novel genes, but only 64 of these genes are conserved among all seven ants. Many gene families have been expanded in ants, notably those involved in chemical communication (e.g., desaturases and odorant receptors). Alignment of the ant genomes revealed reduced purifying selection compared with Drosophila without significantly reduced synteny. Correspondingly, ant genomes exhibit dramatic divergence of noncoding regulatory elements; however, extant conserved regions are enriched for novel noncoding RNAs and transcription factor–binding sites. Comparison of orthologous gene promoters between eusocial and solitary species revealed significant regulatory evolution in both cis(e.g.,Creb) and trans(e.g.,fork head) for nearly 2000 genes, many of which exhibit phenotypic plasticity. Our results emphasize that genomic changes can occur remarkably fast in ants, because two recently diverged leaf-cutter ant species exhibit faster accumulation of species-specific genes and greater divergence in regulatory elements compared with other ants or Drosophila. Thus, while the “socio-genomes” of ants and the honeybee are broadly characterized by a pervasive pattern of divergence in gene composition and regulation, they preserve lineage-specific regulatory features linked to eusociality. We propose that changes in gene regulation played a key role in the origins of insect eusociality, whereas changes in gene composition were more relevant for lineage-specific eusocial adaptations.

Overview

The claims and statistics of this paper haven’t been checked yet.

Run the check — free, no account needed. It reads the open-access text and checks the sources it cites.

A few free checks a day · papers already verified open instantly · results are public

Integrity signals

Registry

Crossref · 10.1101/gr.155408.113

Cites

7 of 7 references verified0 citation errors · 0 not checkable

Statistics

Figures

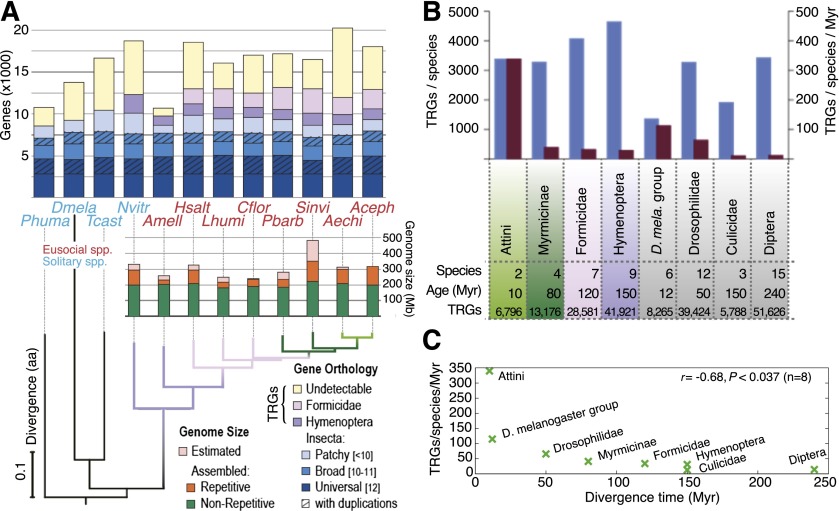
Figure 1. Overview of protein-coding gene composition and genome size in Hymenoptera. (A) Gene and genome content in seven ant species and honeybee (red), with representative solitary insects (blue) as outgroups. Orthology delineation among protein-coding genes from 12 insects identified orthologs present in all (Universal, n = 12) or almost all (Broad, 10 ≤ n ≤ 11) species, conserved as single-copy genes or with paralogs (with duplications). Differential gene losses leave orthologs shared among fewer species across the phylogeny (Patchy, n < 10). Remaining ant genes exhibit orthology with honeybee ([AMELL] Apis mellifera) and/or jewel wasp ([NVITR] Nasonia vitripennis) (Hymenoptera), among ants (Formicidae), or lack orthology (Undetectable). Total estimated genome sizes vary among Hymenoptera, largely due to repetitive regions (orange bars); however, hymenopterans share a nonrepetitive core of ∼200 Mb (green bars). A maximum-likelihood species tree computed from the concatenated alignment of all universal single-copy orthologs confirms the established ant phylogeny (Moreau et al. 2006). Rates of molecular evolution are comparable to the other hymenopterans, flour beetle ([TCAST] Tribolium castaneum; genome size ∼200 Mb), and body louse ([PHUMA] Pediculus humanus; genome size ∼108 Mb), but are much slower than the dipteran representative ([DMELA] Drosophila melanogaster; genome size 175 Mb). The ant species are (HSALT) Harpegnathos saltator; (LHUMI) Linepithema humile; (CFLOR) Camponotus floridanus; (PBARB) Pogonomyrmex barbatus; (SINVI) Solenopsis invicta; (AECHI) Acromyrmex echinatior; and (ACEPH) Atta cephalotes. (B) Occurrence (blue) and emergence rate (red) of taxonomically restricted genes (TRGs) in different taxonomic clades of Hymenoptera (colors) and Diptera (gray). The youngest clades of both Hymenoptera and Diptera exhibit the highest rates of TRG accumulation. Age is measured as the time between the most distant members of each group and hence does not reflect a clade's absolute age. (C) Rate of change of TRGs versus divergence time, for eight species groupings. Pearson's correlation coefficient is shown. P-value was computed using a two-tailed t-test.
Figure 1. Overview of protein-coding gene composition and genome size in Hymenoptera. (A) Gene and genome content in seven ant species and honeybee (red), with representative solitary insects (blue) as outgroups. Orthology delineation among protein-coding genes from 12 insects identified orthologs present in all (Universal, n = 12) or almost all (Broad, 10 ≤ n ≤ 11) species, conserved as single-copy genes or with paralogs (with duplications). Differential gene losses leave orthologs shared among fewer species across the phylogeny (Patchy, n < 10). Remaining ant genes exhibit orthology with honeybee ([AMELL] Apis mellifera) and/or jewel wasp ([NVITR] Nasonia vitripennis) (Hymenoptera), among ants (Formicidae), or lack orthology (Undetectable). Total estimated genome sizes vary among Hymenoptera, largely due to repetitive regions (orange bars); however, hymenopterans share a nonrepetitive core of ∼200 Mb (green bars). A maximum-likelihood species tree computed from the concatenated alignment of all universal single-copy orthologs confirms the established ant phylogeny (Moreau et al. 2006). Rates of molecular evolution are comparable to the other hymenopterans, flour beetle ([TCAST] Tribolium castaneum; genome size ∼200 Mb), and body louse ([PHUMA] Pediculus humanus; genome size ∼108 Mb), but are much slower than the dipteran representative ([DMELA] Drosophila melanogaster; genome size 175 Mb). The ant species are (HSALT) Harpegnathos saltator; (LHUMI) Linepithema humile; (CFLOR) Camponotus floridanus; (PBARB) Pogonomyrmex barbatus; (SINVI) Solenopsis invicta; (AECHI) Acromyrmex echinatior; and (ACEPH) Atta cephalotes. (B) Occurrence (blue) and emergence rate (red) of taxonomically restricted genes (TRGs) in different taxonomic clades of Hymenoptera (colors) and Diptera (gray). The youngest clades of both Hymenoptera and Diptera exhibit the highest rates of TRG accumulation. Age is measured as the time between the most distant members of each group and hence does not reflect a clade's absolute age. (C) Rate of change of TRGs versus divergence time, for eight species groupings. Pearson's correlation coefficient is shown. P-value was computed using a two-tailed t-test.CC BY-NC · PubMed Central
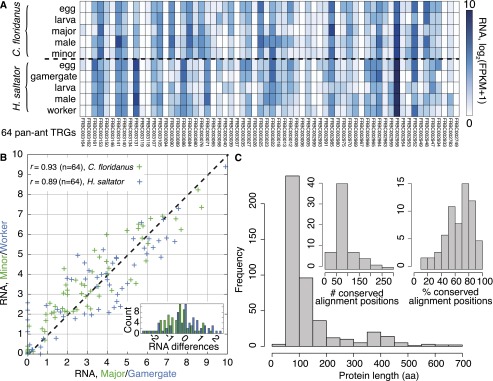
Figure 2. Analysis of 64 pan-ant taxonomically restricted genes (TRGs). (A) RNA expression support for 64 TRGs that are orthologous among all seven ant species but not found in other genomes. RNA expression levels, estimated as log2(FPKM + 1), are shown for various developmental stages and adult castes of C. floridanus and H. saltator. (B) Expression correlation between adult worker castes in C. floridanus (major vs. minor; green) and H. saltator (gamergate vs. worker; blue) for the 64 novel ant TRGs; Pearson's correlation coefficients are shown. (Inset) Histogram of differences in gene expression levels between castes (major − minor in green, gamergate − worker in blue) per gene. (C) Length distribution (in amino acids) of the 64 novel ant TRGs. (Inset) Distribution of the number (left) and percentage (right) of conserved alignment positions (see Supplemental Text 1).
Figure 2. Analysis of 64 pan-ant taxonomically restricted genes (TRGs). (A) RNA expression support for 64 TRGs that are orthologous among all seven ant species but not found in other genomes. RNA expression levels, estimated as log2(FPKM + 1), are shown for various developmental stages and adult castes of C. floridanus and H. saltator. (B) Expression correlation between adult worker castes in C. floridanus (major vs. minor; green) and H. saltator (gamergate vs. worker; blue) for the 64 novel ant TRGs; Pearson's correlation coefficients are shown. (Inset) Histogram of differences in gene expression levels between castes (major − minor in green, gamergate − worker in blue) per gene. (C) Length distribution (in amino acids) of the 64 novel ant TRGs. (Inset) Distribution of the number (left) and percentage (right) of conserved alignment positions (see Supplemental Text 1).CC BY-NC · PubMed Central
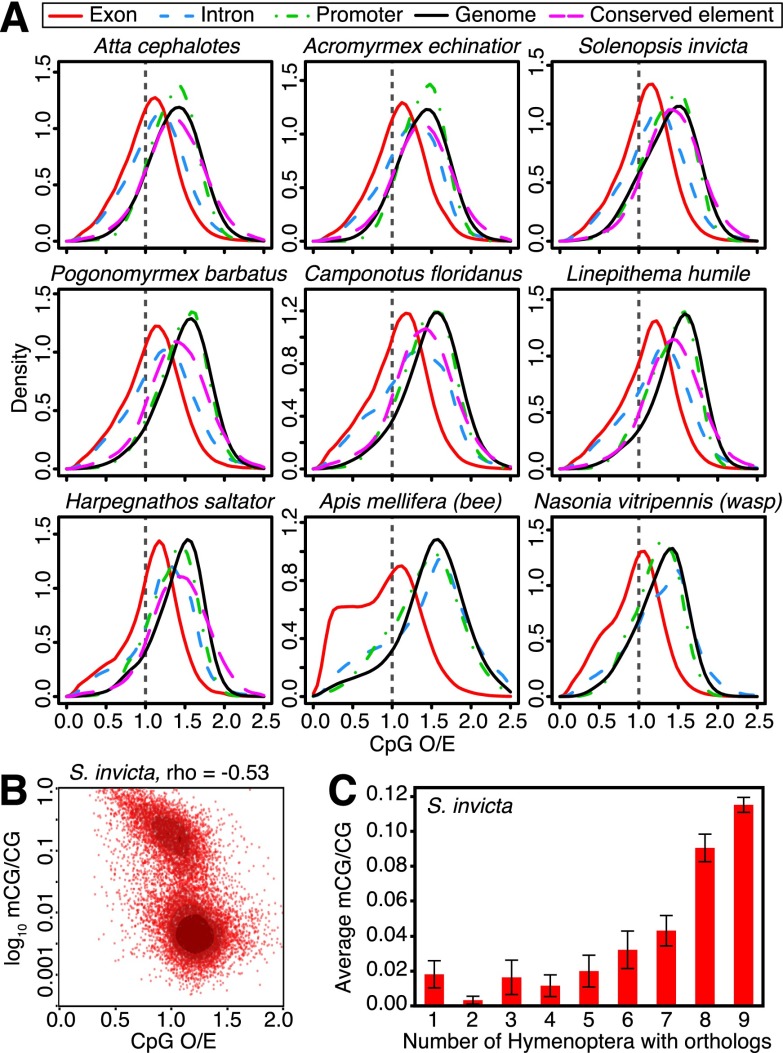
Figure 3. DNA methylation profiles in ant genomes. (A) Normalized CpG content (CpG O/E) of different genomic elements, including exons, introns, and promoter regions (1.5 kb upstream of coding sequence start sites) for protein-coding genes, nongenic conserved elements, and genome-wide background (1-kb fragments). Exons show the strongest evidence of CpG depletion in ants, indicating that they are the most highly methylated regions of the genome in all taxa (confirmed by Bisulfite-seq; below). Introns also show slight depletion of CpGs in ants, suggesting some intron methylation. (B) Scatterplot of log10(mCG/CG) methylation levels estimated by Bisulfite-seq versus CpG O/E for coding sequences in S. invicta reveals a bimodal distribution of gene body methylation. (C) Average methylation levels (mCG/CG) for protein-coding genes in S. invicta males, grouped according to the number of taxa in Hymenoptera with orthologs for each gene; indicating that conserved genes tend to be highly methylated. Error bars indicate 95% confidence intervals for the mean.
Figure 3. DNA methylation profiles in ant genomes. (A) Normalized CpG content (CpG O/E) of different genomic elements, including exons, introns, and promoter regions (1.5 kb upstream of coding sequence start sites) for protein-coding genes, nongenic conserved elements, and genome-wide background (1-kb fragments). Exons show the strongest evidence of CpG depletion in ants, indicating that they are the most highly methylated regions of the genome in all taxa (confirmed by Bisulfite-seq; below). Introns also show slight depletion of CpGs in ants, suggesting some intron methylation. (B) Scatterplot of log10(mCG/CG) methylation levels estimated by Bisulfite-seq versus CpG O/E for coding sequences in S. invicta reveals a bimodal distribution of gene body methylation. (C) Average methylation levels (mCG/CG) for protein-coding genes in S. invicta males, grouped according to the number of taxa in Hymenoptera with orthologs for each gene; indicating that conserved genes tend to be highly methylated. Error bars indicate 95% confidence intervals for the mean.CC BY-NC · PubMed Central
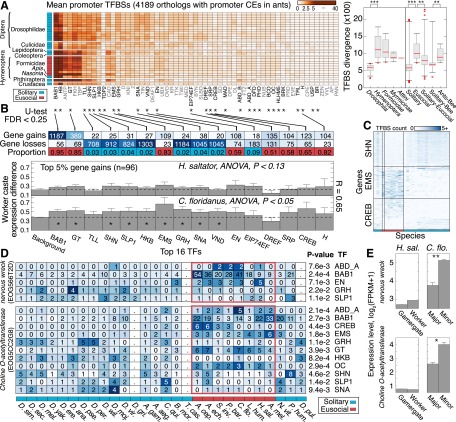
Figure 4. Evolution of transcription factor binding sites (TFBS) in insects. (A) Heatmap showing number of promoter TFBSs per gene for 59 TFs in 28 insect species (n = 4189 genes associated with 2-kb promoter CEs in ants). Species (rows), ordered by phylogenetic grouping, are denoted as solitary (blue) or eusocial (red). TFs were clustered hierarchically using average linkage by computing Euclidean distance between TFBS profiles over all queried genes. (Right) Boxplots show distributions of Euclidean distance values for pairs of species, computed using genome-wide TFBS abundance profiles over genes and TFs (see Supplemental Fig. 30). Each boxplot reflects a group of paired comparisons. P-values estimated by two-tailed Mann–Whitney U-test. (**) P < 10−5; (***) P < 10−10. (B) Genes and TFs exhibiting significant TFBS evolution between solitary and eusocial groups. Three thousand two hundred and thirty-one of 4189 genes had sufficient data for significance testing. (*)TF with significant promoter TFBS evolution (two-tail Mann–Whitney U-test; FDR < 0.25). Top two rows indicate numbers of genes showing significant gain or loss of binding sites for the specified TF. Bottom row indicates proportion of significant genes showing more TFBSs in eusocial compared with solitary insects. More than 93% of tested genes are single-copy in the ant genomes. Bottom panels show the mean and standard error of the standard deviation in RNA expression levels (y-axis) for 96 genes with greatest significance in multiple TFs (top 5%), grouped by TF. Expression levels estimated by log2(FPKM + 1). (FPKM) Fragments per kilobase per million reads. (*) Significantly increased caste variation in RNA expression (compared with all ant orthologs, Background, P < 0.05). (C) TFBS abundance profiles for significant genes, shown for three TFs. Species order (x-axis) as in A. (D) TFBS abundance profiles for two neuronal genes with significance in multiple TFs. Cell colors are row-normalized. Periods (.) Missing data. P-values were computed by a Mann–Whitney U-test. (E) mRNA expression level estimates for the genes in D, shown for different worker castes in H. saltator (reproductive/nonreproductive) and C. floridanus (major/minor). Error bars indicate standard error over three biological replicates. (**) FDR < 0.01; (*) FDR < 0.25.
Figure 4. Evolution of transcription factor binding sites (TFBS) in insects. (A) Heatmap showing number of promoter TFBSs per gene for 59 TFs in 28 insect species (n = 4189 genes associated with 2-kb promoter CEs in ants). Species (rows), ordered by phylogenetic grouping, are denoted as solitary (blue) or eusocial (red). TFs were clustered hierarchically using average linkage by computing Euclidean distance between TFBS profiles over all queried genes. (Right) Boxplots show distributions of Euclidean distance values for pairs of species, computed using genome-wide TFBS abundance profiles over genes and TFs (see Supplemental Fig. 30). Each boxplot reflects a group of paired comparisons. P-values estimated by two-tailed Mann–Whitney U-test. (**) P < 10−5; (***) P < 10−10. (B) Genes and TFs exhibiting significant TFBS evolution between solitary and eusocial groups. Three thousand two hundred and thirty-one of 4189 genes had sufficient data for significance testing. (*)TF with significant promoter TFBS evolution (two-tail Mann–Whitney U-test; FDR < 0.25). Top two rows indicate numbers of genes showing significant gain or loss of binding sites for the specified TF. Bottom row indicates proportion of significant genes showing more TFBSs in eusocial compared with solitary insects. More than 93% of tested genes are single-copy in the ant genomes. Bottom panels show the mean and standard error of the standard deviation in RNA expression levels (y-axis) for 96 genes with greatest significance in multiple TFs (top 5%), grouped by TF. Expression levels estimated by log2(FPKM + 1). (FPKM) Fragments per kilobase per million reads. (*) Significantly increased caste variation in RNA expression (compared with all ant orthologs, Background, P < 0.05). (C) TFBS abundance profiles for significant genes, shown for three TFs. Species order (x-axis) as in A. (D) TFBS abundance profiles for two neuronal genes with significance in multiple TFs. Cell colors are row-normalized. Periods (.) Missing data. P-values were computed by a Mann–Whitney U-test. (E) mRNA expression level estimates for the genes in D, shown for different worker castes in H. saltator (reproductive/nonreproductive) and C. floridanus (major/minor). Error bars indicate standard error over three biological replicates. (**) FDR < 0.01; (*) FDR < 0.25.CC BY-NC · PubMed Central
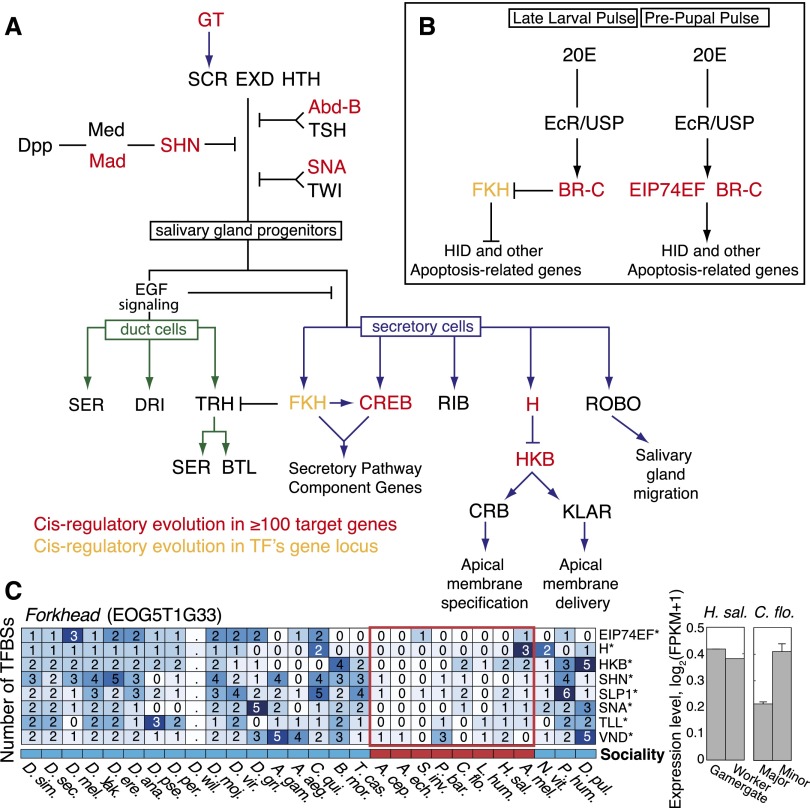
Figure 5. Transcription-factor-mediated signaling pathways controlling salivary gland development. (A) Sex combs reduced (SCR) in combination with extradenticle (EXD) and homothorax (HTH) direct the specification of cells to the salivary gland fate in PS2 of the Drosophila embryo; these TFs are essential for the downstream regulation of genes required for gland cell differentiation and morphogenesis. Boundaries of salivary gland development are restricted along the anterior/posterior axis by abdominal B (Abd-B) and teashirt (TSH), along the dorsal axis by decapentaplegic (DPP) signaling, and along underlying mesoderm by twist (TWI) and snail (SNA). Epidermal growth factor (EGF) signaling determines the decision to differentiate into duct or secretory cells. (B) Regulation of programmed cell death of embryonic salivary gland by 20-hydroxyecdysone (20E). Cell death is inhibited by fork head (FKH) expression in embryonic salivary gland cells. A pulse of 20E at the late larval stage triggers broad (BR-C)–mediated FKH inhibition. A second pulse of 20E at the prepupal stage leads to BR-C and ecdysone-induced protein 74EF (EIP74EF) directed transcription of apoptotic genes, including wrinkled (HID). TFs associated with TFBS evolution in more than 100 target genes (cis-regulatory evolution) (see Fig. 4) (red). The promoter of the fork head locus (yellow), which encodes a TF involved in the regulation of secretory cells, shows significant changes in the gain or loss of promoter TFBSs in ants (trans-regulatory evolution), as detailed in C. (Right) mRNA expression level estimates for fork head, shown for different worker castes in H. saltator (reproductive/non-reproductive) and C. floridanus (major/minor). Error bars indicate standard error over three biological replicates.
Figure 5. Transcription-factor-mediated signaling pathways controlling salivary gland development. (A) Sex combs reduced (SCR) in combination with extradenticle (EXD) and homothorax (HTH) direct the specification of cells to the salivary gland fate in PS2 of the Drosophila embryo; these TFs are essential for the downstream regulation of genes required for gland cell differentiation and morphogenesis. Boundaries of salivary gland development are restricted along the anterior/posterior axis by abdominal B (Abd-B) and teashirt (TSH), along the dorsal axis by decapentaplegic (DPP) signaling, and along underlying mesoderm by twist (TWI) and snail (SNA). Epidermal growth factor (EGF) signaling determines the decision to differentiate into duct or secretory cells. (B) Regulation of programmed cell death of embryonic salivary gland by 20-hydroxyecdysone (20E). Cell death is inhibited by fork head (FKH) expression in embryonic salivary gland cells. A pulse of 20E at the late larval stage triggers broad (BR-C)–mediated FKH inhibition. A second pulse of 20E at the prepupal stage leads to BR-C and ecdysone-induced protein 74EF (EIP74EF) directed transcription of apoptotic genes, including wrinkled (HID). TFs associated with TFBS evolution in more than 100 target genes (cis-regulatory evolution) (see Fig. 4) (red). The promoter of the fork head locus (yellow), which encodes a TF involved in the regulation of secretory cells, shows significant changes in the gain or loss of promoter TFBSs in ants (trans-regulatory evolution), as detailed in C. (Right) mRNA expression level estimates for fork head, shown for different worker castes in H. saltator (reproductive/non-reproductive) and C. floridanus (major/minor). Error bars indicate standard error over three biological replicates.CC BY-NC · PubMed Central

Verification

Claims the paper makes

The claims and statistics of this paper haven’t been checked yet.

Run the check — free, no account needed. It reads the open-access text and checks the sources it cites.

A few free checks a day · papers already verified open instantly · results are public

Claims other papers make about this one

Each is checked against this paper’s own text: does it say what the citing paper says it does?

Self-check

Percentages, sums and reported differences re-computed from the paper’s own numbers.

The self-check needs the paper’s full text.

Citations

Cites

Show all 7 references

Research works printed but not linked: 58

  1. 10.1126/science.1071468 · DOI · Paper page
  2. 10.1242/dev.01863 · DOI
  3. 10.1126/science.1192428 · DOI
  4. 10.1016/j.cub.2012.07.042 · DOI
  5. 2011, The antiquity and evolutionary history of social behavior in bees, PLoS ONE, 66, e21086
  6. 10.1093/oxfordjournals.molbev.a026334 · DOI · Paper page
  7. 10.1038/346482a0 · DOI · Paper page
  8. 10.1016/S0896-6273(04)00016-9 · DOI
  9. Crozier RH , Pamilo P . 1996. Evolution of social insect colonies: Sex allocation and kin selection. Oxford University Press, New York. · DOI · Paper page
  10. 10.1073/pnas.0900301106 · DOI · Paper page
  11. 10.1186/gb-2003-5-1-r1 · DOI · Paper page
  12. 10.1098/rspb.2009.0184 · DOI
  13. 10.1186/gb-2013-14-2-r20 · DOI
  14. 10.1016/j.tig.2011.08.005 · DOI
  15. 10.1111/j.1365-2583.2011.01092.x · DOI
  16. 1996, Age-dependent and task-related morphological changes in the brain and the mushroom bodies of the ant Camponotus floridanus, J Exp Biol, 199, 2011, 10.1242/jeb.199.9.2011 · DOI
  17. 10.1371/journal.pgen.0030197 · DOI · Paper page
  18. 10.1038/nature05260 · DOI · Paper page
  19. 10.1093/nar/gkn923 · DOI · Paper page
  20. 10.1038/nprot.2008.211 · DOI · Paper page
  21. 10.1073/pnas.0810213106 · DOI
  22. 10.1186/1471-2164-12-164 · DOI
  23. 10.1038/nature10093 · DOI · Paper page
  24. 10.1093/nar/gkf436 · DOI · Paper page
  25. 10.1016/j.tig.2009.07.006 · DOI · Paper page
  26. 10.1093/bioinformatics/btr167 · DOI
  27. 10.1126/science.1153069 · DOI · Paper page
  28. 10.1093/bioinformatics/btp434 · DOI
  29. 10.1186/gb-2009-10-3-r25 · DOI · Paper page
  30. 10.1007/s00335-002-2175-6 · DOI
  31. 10.1016/S1534-5807(03)00192-8 · DOI
  32. 2011, Large intergenic non-coding RNA-RoR modulates reprogramming of human induced pluripotent stem cells, Nat Genet, 42, 1113
  33. 10.1074/jbc.270.16.9340 · DOI
  34. 10.1007/s10886-009-9695-4 · DOI · Paper page
  35. 10.1146/annurev.en.14.010169.001503 · DOI · Paper page
  36. 10.1126/science.1124891 · DOI
  37. 10.1093/nar/gkq1145 · DOI
  38. 10.1101/gr.121392.111 · DOI
  39. 10.1101/gr.112516.110 · DOI
  40. 10.1038/nrg2904 · DOI
  41. 10.1016/j.cell.2009.04.020 · DOI
  42. 10.1126/science.1076781 · DOI · Paper page
  43. 10.1073/pnas.1105937108 · DOI
  44. 10.1038/nrg1575 · DOI · Paper page
  45. 10.1073/pnas.0711024105 · DOI · Paper page
  46. 2009, Pervasive natural selection in the Drosophila genome?, PLoS Genet, 56, e1000495
  47. 10.1101/gr.148361.112 · DOI
  48. 10.1111/j.1558-5646.2010.01170.x · DOI
  49. 10.1073/pnas.1008617108 · DOI
  50. 10.1073/pnas.1007901108 · DOI
  51. 2012, Patterns of DNA methylation in development, division of labor and hybridization in an ant with genetic caste determination, PLoS ONE, 78, e42433
  52. 10.1371/journal.pgen.1002007 · DOI
  53. 2004, Temporal patterns of fruit fly Drosophila evolution revealed by mutation clocks, Mol Biol Evol, 21, 36
  54. 10.1111/j.1420-9101.2010.02020.x · DOI
  55. 2009, Identifying the transition between single and multiple mating of queens in fungus-growing ants, Proc Biol Sci, 269, 1541
  56. 10.1093/nar/gkq930 · DOI
  57. 10.1073/pnas.1009690108 · DOI · Paper page
  58. 10.1371/journal.pgen.1002930 · DOI

Cited by

Metadata

Authors
Simola, D. F., Wissler, L., Donahue, G., Waterhouse, R. M., Helmkampf, M., Roux, J., Nygaard, S., Glastad, K. M., Hagen, D. E., Viljakainen, L., Reese, J. T., Hunt, B. G., Graur, D., Elhaik, E., Kriventseva, E. V., Wen, J., Parker, B. J., Cash, E., Privman, E., Childers, C. P., Muñoz-Torres, M. C., Boomsma, J. J., Bornberg-Bauer, E., Currie, C. R., Elsik, C. G., Suen, G., Goodisman, M. A. D., Keller, L., Liebig, J., Rawls, A., Reinberg, D., Smith, C. D., Smith, C. R., Tsutsui, N., Wurm, Y., Zdobnov, E. M., Berger, S. L., & Gadau, J.
Venue
Genome Research
Published
2013-05-01
Volume
23
Issue
8
Pages
1235-1247
ISSN
1088-9051
Cited by
240
References
7
Language
en

About these checks

Registry, retraction, Cites and statistics results are computed, not judged, with one exception: a printed reference that no index lists is read once by a model before it counts as a citation error. Claims are extracted by a model and kept only when their quote appears verbatim in the text; each cited source is then checked, with a model’s help, for whether it says what the claim relies on. Those verdicts can be wrong — read the claim’s quote and the cited source before relying on one.

Statistics and arithmetic are recomputed, not judged.

Confidence bands are shown only for fields calibrated on our annotated test set. None is calibrated yet, so no band is shown.

What counts as a claim ›How we measure confidence ›How we check this ›

Are you an author, or do you see a problem with this page? Request a review

Data sources

Bibliographic data: Semantic Scholar, OpenAlex, Crossref.

Contains information from the Semantic Scholar Academic Graph Datasets, made available under the ODC Attribution License (ODC-BY 1.0).

Semantic Scholar’s data is described in: Kinney, R., et al. (2023). The Semantic Scholar Open Data Platform. arXiv:2301.10140.