

The DOI matches its Crossref record; 45 of the 45 references it cites were found in a registry or an index.
Gene disruption by cell-penetrating peptide-mediated delivery of Cas9 protein and guide RNA
Open accessAbstract
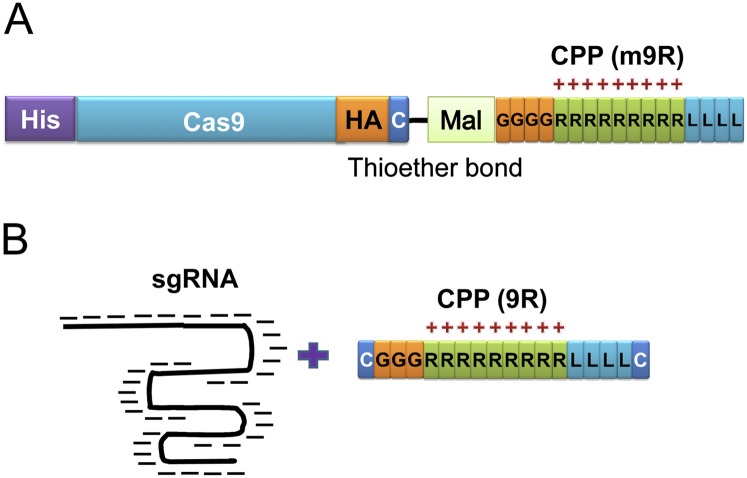
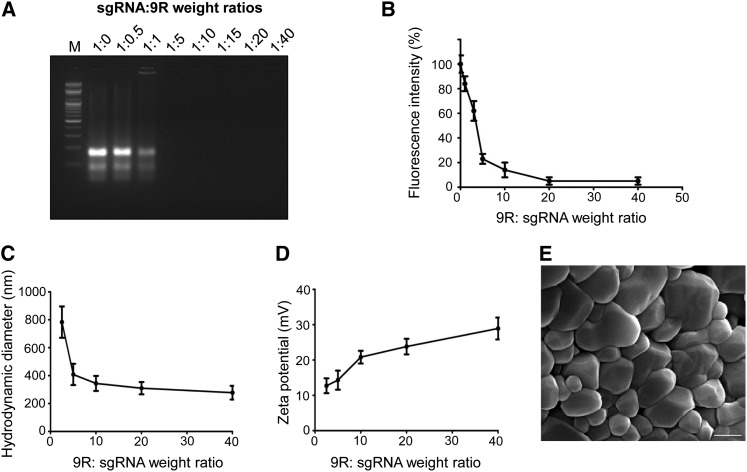
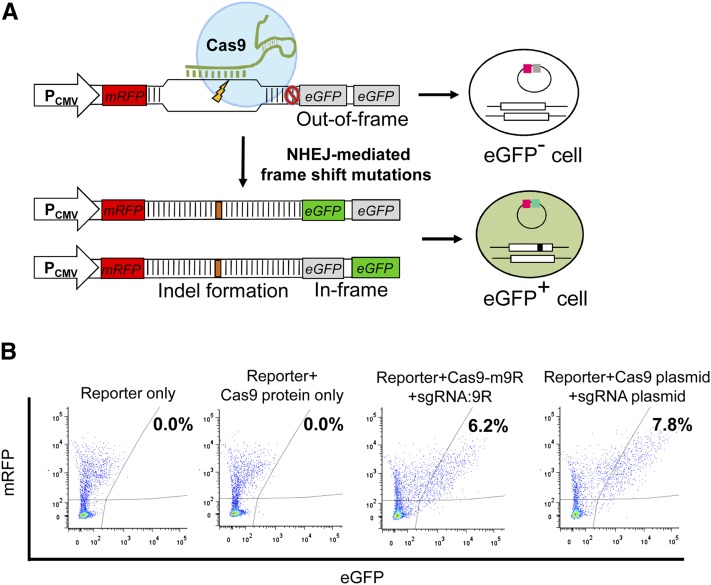
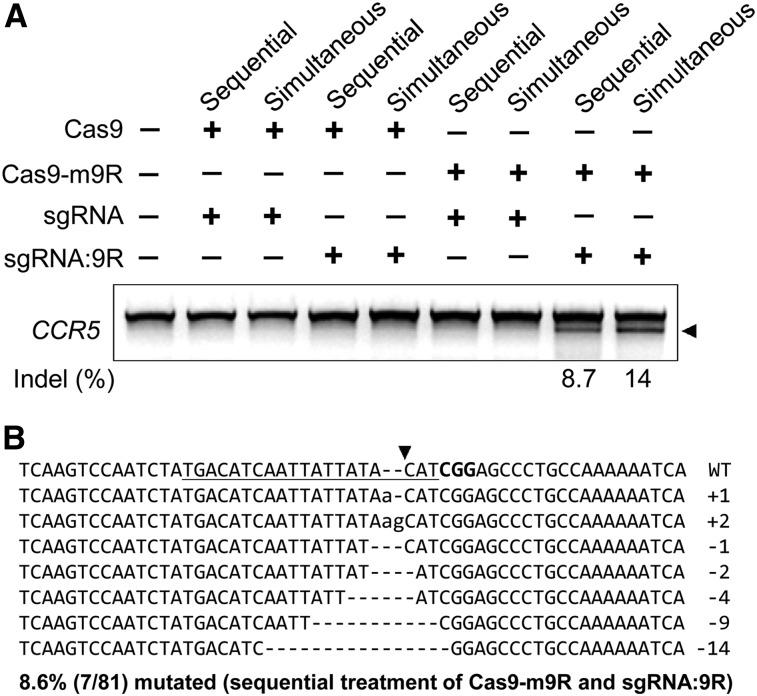
RNA-guided endonucleases (RGENs) derived from the CRISPR/Cas system represent an efficient tool for genome editing. RGENs consist of two components: Cas9 protein and guide RNA. Plasmid-mediated delivery of these components into cells can result in uncontrolled integration of the plasmid sequence into the host genome, and unwanted immune responses and potential safety problems that can be caused by the bacterial sequences. Furthermore, this delivery method requires transfection tools. Here we show that simple treatment with cell-penetrating peptide (CPP)-conjugated recombinant Cas9 protein and CPP-complexed guide RNAs leads to endogenous gene disruptions in human cell lines. The Cas9 protein was conjugated to CPP via a thioether bond, whereas the guide RNA was complexed with CPP, forming condensed, positively charged nanoparticles. Simultaneous and sequential treatment of human cells, including embryonic stem cells, dermal fibroblasts, HEK293T cells, HeLa cells, and embryonic carcinoma cells, with the modified Cas9 and guide RNA, leads to efficient gene disruptions with reduced off-target mutations relative to plasmid transfections, resulting in the generation of clones containing RGEN-induced mutations. Our CPP-mediated RGEN delivery process provides a plasmid-free and additional transfection reagent-free method to use this tool with reduced off-target effects. We envision that our method will facilitate RGEN-directed genome editing.
Overview
The claims and statistics of this paper haven’t been checked yet.
Run the check — free, no account needed. It reads the open-access text and checks the sources it cites.
Integrity signals
Registry
Cites
Statistics
Figures
Verification
Claims the paper makes
The claims and statistics of this paper haven’t been checked yet.
Run the check — free, no account needed. It reads the open-access text and checks the sources it cites.
Claims other papers make about this one
Each is checked against this paper’s own text: does it say what the citing paper says it does?
The cited source doesn’t support the claim as written.
In the citing paper
“RNP electroporation exhibits higher on-target editing efficiency and lower off-target mutations than the other delivery methods”
From Off-target effects in CRISPR/Cas9 gene editing (2023) · cites this paper as Ramakrishna et al., 2014
Checked by a reasoning model — may be wrong.
Experimental — accuracy not yet measuredThe source backs part of the claim, not all of it — or backs it for a different population, condition or comparison.
In the citing paper
“A powerful advantage of the CRISPR/Cas9 system is the ability to target any ∼23-bp sequence that contains a PAM motif on either strand of DNA.”
From Delivering CRISPR: a review of the challenges and approaches (2018) · cites this paper as Ramakrishna et al., 2014
Experimental — accuracy not yet measuredThe source backs part of the claim, not all of it — or backs it for a different population, condition or comparison.
In the citing paper
“cell-penetrating peptides (CPP), conjugated with Cas9 and complexed with gRNA enabled efficient gene silencing in human cell lines and disease models featuring fewer off-target effects when compared to plasmid transfection [153,154].”
From CRISPR-Cas: Converting A Bacterial Defence Mechanism into A State-of-the-Art Genetic Manipulation Tool (2019) · cites this paper as [153]
Experimental — accuracy not yet measuredIn the citing paper
“Ramakrishna et al. demonstrated that conjugating Cas9 and sgRNA with cell-penetrating peptides (CPPs) enhanced intracellular delivery efficiency because of the membrane-disturbed properties of CPPs.[227]”
From RNA delivery biomaterials for the treatment of genetic and rare diseases (2019) · cites this paper as [227]
In the citing paper
“Some work with CPPs and CRISPR/Cas9 was accomplished as early as 2014 by Ramakrishna et al. (2014), who showed separate delivery of CPP–Cas9 and CPP–sgRNA to multiple human cell lines.”
From Delivering CRISPR: a review of the challenges and approaches (2018) · cites this paper as Ramakrishna et al., 2014
In the citing paper
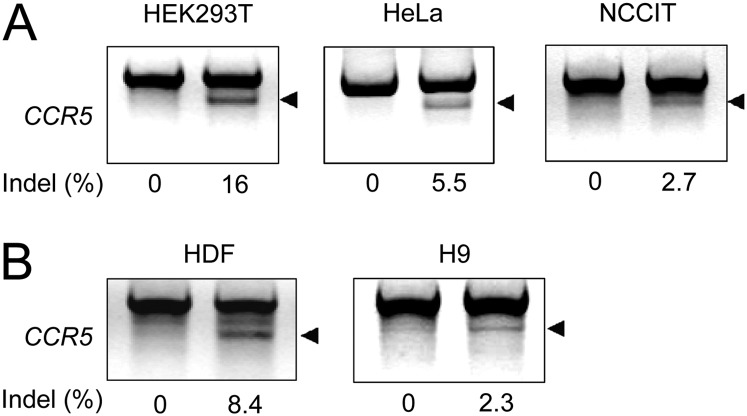
“Ramakrishna et al. developed cell-penetrating peptide (CPP)-conjugated recombinant Cas9 protein and CPP-complexed guide RNAs for gene disruptions of CCR5 locus in human cell lines, including HEK293T, HeLa, NCCIT (a human pluripotent embryonal carcinoma cell line), human dermal fibroblasts and human embryonic stem cells.”
From Non-viral delivery systems for CRISPR/Cas9-based genome editing: challenges and opportunities (2018) · cites this paper as [96]
In the citing paper
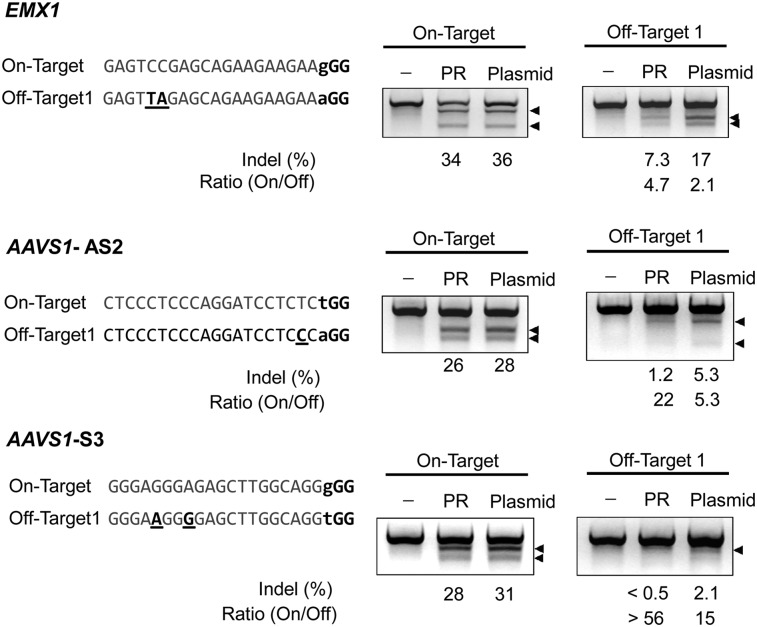
“Cell-penetrate-peptide-mediated delivery was reported to achieve higher on-to off-target activity ratio compared with plasmid-mediated delivery.53”
From CRISPR-Cas9: a new and promising player in gene therapy (2015) · cites this paper as [53]
Self-check
Percentages, sums and reported differences re-computed from the paper’s own numbers.
The self-check needs the paper’s full text.
Citations
Cites
A Programmable Dual-RNA–Guided DNA Endonuclease in Adaptive Bacterial Immunity
Jinek, M., Chylinski, K., Fonfara, I., Hauer, M., Doudna, J. A., & Charpentier, E. (2012) · Science · doi:10.1126/science.1225829 · Cited by 17,116
Multiplex Genome Engineering Using CRISPR/Cas Systems
Cong, L., Ran, F. A., Cox, D., Lin, S., Barretto, R., Habib, N., Hsu, P. D., Wu, X., Jiang, W., Marraffini, L. A., et al. (2013) · Science · doi:10.1126/science.1231143 · Cited by 15,339
RNA-Guided Human Genome Engineering via Cas9
Mali, P., Yang, L., Esvelt, K. M., Aach, J., Guell, M., DiCarlo, J. E., Norville, J. E., & Church, G. M. (2013) · Science · doi:10.1126/science.1232033 · Cited by 9,210
A Toll-like receptor recognizes bacterial DNA
Hemmi, H., Takeuchi, O., Kawai, T., Kaisho, T., Sato, S., Sanjo, H., Matsumoto, M., Hoshino, K., Wagner, H., Takeda, K., et al. (2000) · Nature · doi:10.1038/35047123 · Cited by 6,491 · cited 3×
“responses (Hemmi et al. 2000; Wagner 2001) caused by bacterial sequences, and safety problems if the antibiotic-resistance gene is taken up by pathogenic bacteria.”
BackgroundInfluentialDNA targeting specificity of RNA-guided Cas9 nucleases
Hsu, P. D., Scott, D. A., Weinstein, J. A., Ran, F. A., Konermann, S., Agarwala, V., Li, Y., Fine, E. J., Wu, X., Shalem, O., et al. (2013) · Nature Biotechnology · doi:10.1038/nbt.2647 · Cited by 4,741
Wang, H., Yang, H., Shivalila, C. S., Dawlaty, M. M., Cheng, A. W., Zhang, F., & Jaenisch, R. (2013) · Cell · doi:10.1016/j.cell.2013.04.025 · Cited by 3,495
Double nicking by RNA-guided CRISPR Cas9 for enhanced genome editing specificity
Ran, F. A., Hsu, P. D., Lin, C.-Y., Gootenberg, J. S., Konermann, S., Trevino, A. E., Scott, D. A., Inoue, A., Matoba, S., Zhang, Y., et al. (2013) · Cell · doi:10.1016/j.cell.2013.08.021 · Cited by 3,299
High-Frequency off-Target Mutagenesis Induced by CRISPR-Cas Nucleases in Human Cells
Fu, Y., Foden, J. A., Khayter, C., Maeder, M. L., Reyon, D., Joung, J. K., & Sander, J. D. (2013) · Nature Biotechnology · doi:10.1038/nbt.2623 · Cited by 3,292
Efficient genome editing in zebrafish using a CRISPR-Cas system
Hwang, W. Y., Fu, Y., Reyon, D., Maeder, M. L., Tsai, S. Q., Sander, J. D., Peterson, R. T., Yeh, J.-R. J., & Joung, J. K. (2013) · Nature Biotechnology · doi:10.1038/nbt.2501 · Cited by 2,937
CRISPR/Cas, the Immune System of Bacteria and Archaea
Horvath, P., & Barrangou, R. (2010) · Science · doi:10.1126/science.1179555 · Cited by 2,471
Cited by
Sorted by citations
Items 601–653 of 653
Use of delivery technologies to modulate protein kinase activity
Lai, W. (2019) · Elsevier eBooks · doi:10.1016/b978-0-12-816485-3.00010-6
Biomaterials for gene editing therapeutics
Shim, G., Kim, D., Le, Q., Byun, J., Park, J.-W., & Oh, Y. (2020) · Elsevier eBooks · doi:10.1016/b978-0-08-102983-1.00008-9
Noh, B., Rim, J. H., Gopalappa, R., Lin, H., Kim, K. M., Gee, H. Y., Choi, J. Y., Kim, S., & Jung, J. (2021) · Research Square · doi:10.21203/rs.3.rs-152704/v1
Self-citationZielińska, W., Gagat, M., Mikołajczyk, K., Hałas‐Wiśniewska, M., & Grzanka, A. (2021) · Applied Sciences · doi:10.3390/app11051997
Zhang, D., Jin, S., Liu, L., Tota, E. M., Li, Z., Piao, X., & Devaraj, N. K. (2021) · bioRxiv (Cold Spring Harbor Laboratory) · doi:10.1101/2021.04.22.441030
Carmignotto, G. P. (2019) · Digital Library of Theses and Dissertations (Universidade de São Paulo) · doi:10.11606/t.3.2019.tde-31052021-094248
Kwak, M., Southard, K. M., Kim, W. R., Lin, A., Kim, N. H., Gopalappa, R., An, M., Lee, H. J., Choi, S. H., Farlow, J., et al. (2021) · Research Square · doi:10.21203/rs.3.rs-956506/v1
Self-citationThe Development of Recombinant hSpCas9 Production System in E. coli
Uslu, M., Serasker, E., & Kocabaş, F. (2021) · Gene Editing · doi:10.29228/genediting.54955
Liu, Q., & Liu, Y. (2021) · Biomaterial engineering · doi:10.1007/978-981-33-6198-0_5-1
Langel, Ü. (2019) · Springer eBooks · doi:10.1007/978-981-13-8747-0_1
Efficient in vitro and in vivo self-repression of SpCas9 gene using a molecular Hara-Kiri method.Preprint
Iyombe-Engembe, J.-P., Duchêne, B. L., Rousseau, J., Ouellet, D. L., Cherif, K., Guyon, A., & Tremblay, J. P. (2022) · Research Square · doi:10.21203/rs.3.rs-1353802/v1
Delivery and Formulation Methods for Therapeutic Genome Editing
Blenke, E. O., & Krishnamurthy, V. R. (2022) · Wiley eBooks · doi:10.1002/9781119671404.ch18
Liu, Q., & Liu, Y. (2022) · Biomaterial engineering · doi:10.1007/978-981-16-5419-0_5
Faculty Opinions recommendation of A mouse geneticist's practical guide to CRISPR applications.
Warming, S. (2018) · Faculty Opinions – Post-Publication Peer Review of the Biomedical Literature · doi:10.3410/f.719010859.793546196
Mitchell, A. P. (2018) · Faculty Opinions – Post-Publication Peer Review of the Biomedical Literature · doi:10.3410/f.733115592.793545570
Cheng, C., Wong, T. H. Y., Yung, Y., Chan, N. C. N., & Ng, M. H. L. (2019) · Journal of Visualized Experiments · doi:10.3791/60130-v
New frontiers in CRISPR/Cas9 delivery systems delivery for gene editingPreprint
Khoshaman, K., Nasiri, M., Rezaee, M., Izadi, F., Mehrara, A., Sadeghi, L., Rezaeian, Y., Rezaei, E., Zarei, E., Rahmanian, S., et al. (2022) · doi:10.22541/au.165493454.42208986/v1
CRISPR technology and its potential role in treating rare imprinting diseases
Nickl, P., Syding, L. A., & Sedláček, R. (2023) · Principles of Gender-Specific Medicine · doi:10.1016/b978-0-323-88534-8.00044-4
Classes and Applications of Cell-Penetrating Peptides
Langel, Ü. (2023) · Springer eBooks · doi:10.1007/978-3-031-38731-9_2
Langel, Ü. (2023) · Springer eBooks · doi:10.1007/978-3-031-38731-9_1
Lipid Nanoparticle-Mediated Delivery of CRISPR-Cas9 for Therapeutic Gene Correction
Walther, J. (2023) · Utrecht University Repository (Utrecht University) · doi:10.33540/2032
Alcohol-containing protein transduction domain mimics
Koch, K. C., Bizmark, T. M., & Tew, G. N. (2023) · Journal of Controlled Release · doi:10.1016/j.jconrel.2023.12.005
Lang, E., Tilton, J. C., & Sweet, T. J. (2024) · Columbia Undergraduate Science Journal · doi:10.52214/cusj.v17i1.10965
Advanced Therapy Medicinal Products: Clinical, Non-clinical, and Quality Considerations
Mastrobattista, E., Doevendans, E., van Til, N. P., Kemp, V., de Vrij, J., & Hoogendoorn, K. H. (2024) · Springer eBooks · doi:10.1007/978-3-031-30023-3_14
CRISPR workflow solutions: Cargos and versatile delivery platforms in genome editing
Munir, A., Ali, M. A., Qari, S. H., Munawar, N., Saleem, M. S., & Ahmad, A. (2024) · Elsevier eBooks · doi:10.1016/b978-0-443-13229-2.00014-4
Haskó, J., Feng, W., Arshadi, A., Tolomeo, D., Hembo, C. S., Petersen, T. S., Lv, W., Han, P., Zeng, Y., Wang, F., et al. (2024) · bioRxiv (Cold Spring Harbor Laboratory) · doi:10.1101/2024.04.18.590030
CRISPR/Cas9 gene editing: A new hope for Parkinson's disease
Hanjankar, S. N., Haria, A., Agarwal, R., & Patravale, V. B. (2024) · Elsevier eBooks · doi:10.1016/b978-0-443-23841-3.00023-6 · Cited by 1
Gustafsson, O., Krishna, S., Borate, S., Ghaeidamini, M., Liang, X., Saher, O., Cuellar, R., Birdsong, B. K., Roudi, S., Estupiñan, H. Y., et al. (2024) · bioRxiv (Cold Spring Harbor Laboratory) · doi:10.1101/2024.11.27.624305
Peptide-Assisted CRISPR/Cas9 Delivery to Tumors
Gustafsson, O., Andaloussi, S. E., & Nordin, J. Z. (2025) · Methods in pharmacology and toxicology · doi:10.1007/978-1-0716-4374-7_8
CRISPR/Cas9 Application in CAR-T Cell Based Tumor Therapies
Liu, Z. (2024) · Highlights in Science Engineering and Technology · doi:10.54097/1v02kg41
Nucleic Acid-Based Systems for Regenerative Medicine
Martín, L., & Grzela, D. P. (2025) · Springer eBooks · doi:10.1007/978-3-031-87744-5_8
Liu, H., Sun, L., Sun, Q., Zhang, S., & Wang, R. (2025) · Frontiers in Veterinary Science · doi:10.3389/fvets.2025.1631293
Single-step purification of functional Cas9 protein via the ubiquitin expression system
Duan, X., Zhou, Z., Zeng, X., Chen, J., & Mao, A. (2025) · International Journal of Biological Macromolecules · doi:10.1016/j.ijbiomac.2025.147590
Gene Therapy: Revolutionizing the Beauty Industry with Cosmetics
Sonawane, G., Khanam, A., Sharma, S., Pansare, K. V., Gilhotra, R. M., & Dhakad, P. K. (2025) · BENTHAM SCIENCE PUBLISHERS eBooks · doi:10.2174/9798898810726125010011
CRISPR-Cas9 Mediated Knockout of Apoptotic Genes in Human Stem Cells: A Functional Study
Hamza, Z. S., Temimi, T. A., Al-Oudah, G. A., & Shareffi, K. A. A. (2025) · Journal of Biomedicine and Biochemistry · doi:10.57238/jbb.2025.7432.1148
Salekdeh, P. R., Ma’mani, L., Tavakkoly‐Bazzaz, J., Mousavi, H., Modaressi, M. H., & Salekdeh, G. H. (2021) · Figshare · doi:10.6084/m9.figshare.14355118
Cell penetrating and interfering peptides as new cancer therapy
Zhang, X. (2017) · theses.fr (ABES) · doi:10.70675/b2053021ze747z4f1azacb7z8a87a14ec9e3
Gene editing approaches of microsatellite disorders : shortening expanded repeats
Poggi, L. (2020) · theses.fr (ABES) · doi:10.70675/741f0470z28a0z4c3bz9e75ze578bdc49074 · Cited by 1
Self-Assembling Short Peptide Carriers for Gene Delivery
An, L., Xu, Z., & Zhang, X. (2026) · International Journal of Molecular Sciences · doi:10.3390/ijms27083464
Ju, S., Lee, J., Yang, J., Jeong, T. Y., Choi, C. G., Lee, Y., Cha, S., Park, J., Kim, S. P., Kim, S., et al. (2026) · Molecular Therapy — Nucleic Acids · doi:10.1016/j.omtn.2026.102978 · Cited by 2
CRISPRing through time: How cutting-edge technology is revolutionizing life sciences and medicine
Banik, I., & Coppé, J. (2026) · Molecular Therapy — Nucleic Acids · doi:10.1016/j.omtn.2026.103003
Ramesh, S., Kumar, N., & Ghosh, A. (2026) · World Journal of Microbiology and Biotechnology · doi:10.1007/s11274-026-05189-1
du Rand, A., Masterson, C., Verdon, D. J., Siow, A., Loef, E. J., Dunbar, P. R., Kingston, R. L., Harris, P. W. R., & Sheppard, H. M. (2026) · Bioengineering & Translational Medicine · doi:10.1002/btm2.70172
High‐Content CRISPR Screening: Methods and Applications
Zhang, Y., Zhang, Y., Tang, X., Deng, X., Zhou, Y., Wu, Y., & Luo, J. (2026) · MedComm · doi:10.1002/mco2.70964
Clinical translation of CRISPR-Cas9 therapeutics in cancer and inherited genetic disorders
Bashir, K., Vasudev, P., Chhetri, V., Dubhashi, D. P., Teli, Y. G., Biswas, R., Ramaiah, S., & Anbarasu, A. (2026) · Frontiers in Genome Editing · doi:10.3389/fgeed.2026.1868779
Cell-Penetrating Peptide Delivery for CRISPR Applications
Paul, A., Lee, H. Y., & Tuma, J. (2026) · Methods in molecular biology · doi:10.1007/978-1-0716-5547-4_14
Das, P., Samoi, T. B., & Maji, B. (2026) · Chemical Communications · doi:10.1039/d6cc01929c
Metadata
- Authors
- Ramakrishna, S., Kwaku Dad, A.-B., Beloor, J., Gopalappa, R., Lee, S.-K., & Kim, H.
- Affiliations
- Hanyang University (KR)
- Venue
- Genome Research
- Publisher
- Cold Spring Harbor Laboratory
- Published
- 2014-04-02
- Volume
- 24
- Issue
- 6
- Pages
- 1020-1027
- ISSN
- 1088-9051 (ISSN-L)
- PMC
- PMC4032848
- OpenAlex
- W2103609218
- Cited by
- 655
- References
- 45
- Citations by year
- 2026: 16 · 2025: 31 · 2024: 41 · 2023: 46 · 2022: 64 · 2021: 76 · 2020: 66 · 2019: 60 · 2018: 77 · 2017: 60 · 2016: 56 · 2015: 50 · 2014: 11
- Type
- posted content
- Language
- en
- Open access
- hybrid
- doi.org
- Licence
- cc-by-nc
- Locations
- Genome Research (publishedVersion, cc-by-nc)
- PubMed Central (publishedVersion, cc-by-nc)
- PubMed (publishedVersion)
- HighWire Press Open Archive (submittedVersion)
- Funders
- National Research Foundation
- Hanyang University
- Yonsei University
- Korea Basic Science Institute
- National Research Foundation of Korea (2013M3A9B4076544, 2011‐0019357)
- Korea Advanced Institute of Science and Technology
- Topics
- Life Sciences › Biochemistry, Genetics and Molecular Biology › Molecular Biology › CRISPR and Genetic Engineering
- Life Sciences › Biochemistry, Genetics and Molecular Biology › Molecular Biology › RNA Interference and Gene Delivery
- Life Sciences › Biochemistry, Genetics and Molecular Biology › Molecular Biology › RNA regulation and disease
- Keywords
- CRISPR/Cas9, cell-penetrating peptides, gene disruption, genome editing, guide RNA delivery, off-target mutations, embryonic stem cells, human cell lines
- MeSH terms
- RNA, Guide, CRISPR-Cas Systems, Humans, Transfection, Genome, Human, Mutagenesis, Site-Directed, RNA Editing, RNA, Guide, Kinetoplastida, Cell Line, Tumor, Nanoparticles, HEK293 Cells, Cell-Penetrating Peptides, CRISPR-Cas Systems
About these checks
Registry, retraction, Cites and statistics results are computed, not judged, with one exception: a printed reference that no index lists is read once by a model before it counts as a citation error. Claims are extracted by a model and kept only when their quote appears verbatim in the text; each cited source is then checked, with a model’s help, for whether it says what the claim relies on. Those verdicts can be wrong — read the claim’s quote and the cited source before relying on one.
Statistics and arithmetic are recomputed, not judged.
Confidence bands are shown only for fields calibrated on our annotated test set. None is calibrated yet, so no band is shown.
What counts as a claim ›How we measure confidence ›How we check this ›
Are you an author, or do you see a problem with this page? Request a review
