

The DOI matches its Crossref record; 61 of the 61 references it cites were found in a registry or an index.
Large-scale analysis of genome and transcriptome alterations in multiple tumors unveils novel cancer-relevant splicing networks
Open accessPublished version of a preprint
Abstract
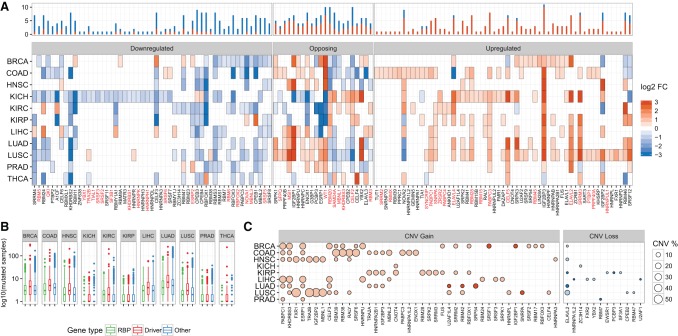
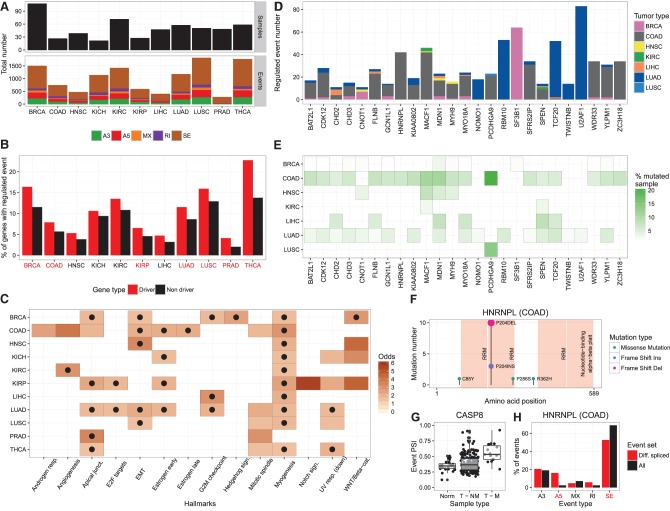
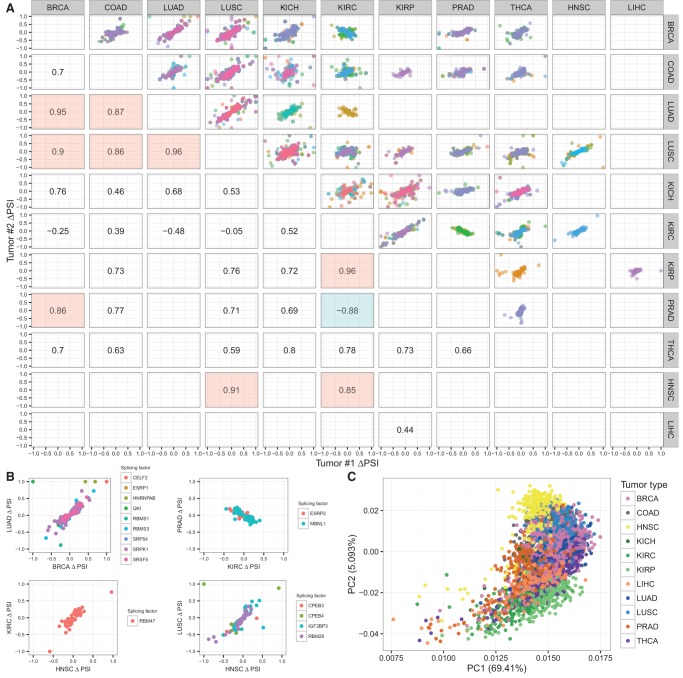
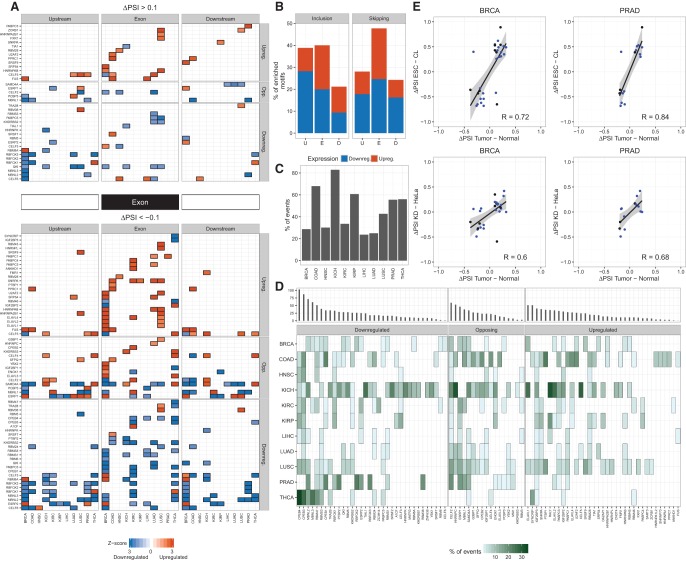
Alternative splicing is regulated by multiple RNA-binding proteins and influences the expression of most eukaryotic genes. However, the role of this process in human disease, and particularly in cancer, is only starting to be unveiled. We systematically analyzed mutation, copy number, and gene expression patterns of 1348 RNA-binding protein (RBP) genes in 11 solid tumor types, together with alternative splicing changes in these tumors and the enrichment of binding motifs in the alternatively spliced sequences. Our comprehensive study reveals widespread alterations in the expression of RBP genes, as well as novel mutations and copy number variations in association with multiple alternative splicing changes in cancer drivers and oncogenic pathways. Remarkably, the altered splicing patterns in several tumor types recapitulate those of undifferentiated cells. These patterns are predicted to be mainly controlled by MBNL1 and involve multiple cancer drivers, including the mitotic gene NUMA1 . We show that NUMA1 alternative splicing induces enhanced cell proliferation and centrosome amplification in nontumorigenic mammary epithelial cells. Our study uncovers novel splicing networks that potentially contribute to cancer development and progression.
Overview
The claims and statistics of this paper haven’t been checked yet.
Run the check — free, no account needed. It reads the open-access text and checks the sources it cites.
Integrity signals
Registry
Cites
Statistics
Figures
Verification
Claims the paper makes
The claims and statistics of this paper haven’t been checked yet.
Run the check — free, no account needed. It reads the open-access text and checks the sources it cites.
Claims other papers make about this one
Each is checked against this paper’s own text: does it say what the citing paper says it does?
In the citing paper
“Notably, 48 DS genes (10%; FDR=8.8×10⁻⁴) encode RNA binding proteins or splicing factors (34), with at least six splicing factors also showing DTE in ASD (MATR3), SCZ (QKI, RBM3, SRRM2, U2AF1) or both (SRSF11).”
From Transcriptome-wide isoform-level dysregulation in ASD, schizophrenia, and bipolar disorder (2018) · cites this paper as [34]
Self-check
Percentages, sums and reported differences re-computed from the paper’s own numbers.
The self-check needs the paper’s full text.
Citations
Cites
PD-1 and PD-L1 Immune Checkpoint Blockade to Treat Breast Cancer
Hartkopf, A. D., Taran, F., Wallwiener, M., Walter, C. B., Krämer, B., Grischke, E., & Brucker, S. Y. (2016) · Breast Care · doi:10.1159/000453569 · Cited by 30,989
The Molecular Signatures Database Hallmark Gene Set Collection
Liberzon, A., Birger, C., Thorvaldsdóttir, H., Ghandi, M., Mesirov, J. P., & Tamayo, P. (2015) · Cell Systems · doi:10.1016/j.cels.2015.12.004 · Cited by 13,807
Nishimura, R., Osako, T., Nishiyama, Y., Tashima, R., Nakano, M., Fujisue, M., Toyozumi, Y., & Arima, N. (2013) · Oncology · doi:10.1159/000353099 · Cited by 13,239
Comprehensive molecular portraits of human breast tumours
The Cancer Genome Atlas Network (2012) · Nature · doi:10.1038/nature11412 · Cited by 12,129
Finding community structure in very large networks
Clauset, A., Newman, M. E. J., & Moore, C. (2004) · Physical Review E · doi:10.1103/physreve.70.066111 · Cited by 7,390
Sparse inverse covariance estimation with the graphical lasso
Friedman, J., Hastie, T., & Tibshirani, R. (2008) · Biostatistics · doi:10.1093/biostatistics/kxm045 · Cited by 6,355
voom: precision weights unlock linear model analysis tools for RNA-seq read counts
Law, C. W., Chen, Y., Shi, W., & Smyth, G. K. (2014) · Genome Biology · doi:10.1186/gb-2014-15-2-r29 · Cited by 6,155
limma: Linear Models for Microarray Data
Smyth, G. K. (2005) · Statistics for Biology and Health · doi:10.1007/0-387-29362-0_23 · Cited by 5,796
Fitting a mixture model by expectation maximization to discover motifs in biopolymers.
Bailey, T. L., & Elkan, C. (1994) · PubMed · Cited by 4,982
Comprehensive genomic characterization of head and neck squamous cell carcinomas
The Cancer Genome Atlas Network (2015) · Nature · doi:10.1038/nature14129 · Cited by 4,147
Comprehensive genomic characterization of squamous cell lung cancers
The Cancer Genome Atlas Research Network (2012) · Nature · doi:10.1038/nature11404 · Cited by 3,994
Insights into RNA Biology from an Atlas of Mammalian mRNA-Binding Proteins
Castello, A., Fischer, B., Eichelbaum, K., Horos, R., Beckmann, B. M., Strein, C., Davey, N. E., Humphreys, D. T., Preiss, T., Steinmetz, L. M., et al. (2012) · Cell · doi:10.1016/j.cell.2012.04.031 · Cited by 2,132
Frequent pathway mutations of splicing machinery in myelodysplasia
Yoshida, K., Sanada, M., Shiraishi, Y., Nowak, D., Nagata, Y., Yamamoto, R., Sato, Y., Sato-Otsubo, A., Kon, A., Nagasaki, M., et al. (2011) · Nature · doi:10.1038/nature10496 · Cited by 2,029
Dosztányi, Z., Csizmók, V., Tompa, P., & Simon, I. (2005) · Computer applications in the biosciences · doi:10.1093/bioinformatics/bti541 · Cited by 1,943
Mapping the Hallmarks of Lung Adenocarcinoma with Massively Parallel Sequencing
Imielinski, M., Berger, A. H., Hammerman, P. S., Hernandez, B., Pugh, T. J., Hodis, E., Cho, J., Suh, J., Capelletti, M., Sivachenko, A., et al. (2012) · Cell · doi:10.1016/j.cell.2012.08.029 · Cited by 1,789
Hoadley, K. A., Yau, C. S. F., Wolf, D. M., Cherniack, A. D., Tamborero, D., Ng, S., Leiserson, M. D. M., Niu, B., McLellan, M. D., Uzunangelov, V., et al. (2014) · Cell · doi:10.1016/j.cell.2014.06.049 · Cited by 1,537
A compendium of RNA-binding motifs for decoding gene regulation
Ray, D., Kazan, H., Cook, K. B., Weirauch, M. T., Najafabadi, H. S., Li, X., Gueroussov, S., Albu, M., Zheng, H., Yang, A., et al. (2013) · Nature · doi:10.1038/nature12311 · Cited by 1,480 · cited 3×
“RNA binding motif enrichment RNAcompete motifs (Ray et al. 2013) were used for analysis.”
MethodInfluentialThe mRNA-Bound Proteome and Its Global Occupancy Profile on Protein-Coding Transcripts
Baltz, A. G., Munschauer, M., Schwanhäußer, B., Vasile, A. I., Murakawa, Y., Schueler, M., Youngs, N., Penfold-Brown, D., Drew, K., Milek, M., et al. (2012) · Molecular Cell · doi:10.1016/j.molcel.2012.05.021 · Cited by 1,215
Carter, S. L., Eklund, A. C., Kohane, I. S., Harris, L. N., & Szállási, Z. (2006) · Nature Genetics · doi:10.1038/ng1861 · Cited by 1,199
Cunningham, F., Amode, M. R., Barrell, D., Beal, K., Billis, K., Brent, S., Carvalho-Silva, D., Clapham, P., Coates, G., Fitzgerald, S., et al. (2015) · Nucleic Acids Research · doi:10.1093/nar/gku1010 · Cited by 1,115
Whole-genome analysis informs breast cancer response to aromatase inhibition
Ellis, M. J., Ding, L., Shen, D., Luo, J. R., Suman, V. J., Wallis, J. W., Tine, B. A. V., Hoog, J., Goiffon, R., Goldstein, T. C., et al. (2012) · Nature · doi:10.1038/nature11143 · Cited by 1,040
The gene encoding the splicing factor SF2/ASF is a proto-oncogene
Karni, R., de Stanchina, E., Lowe, S. W., Sinha, R., Mu, D., & Krainer, A. R. (2007) · Nature Structural & Molecular Biology · doi:10.1038/nsmb1209 · Cited by 935
Hallmarks of alternative splicing in cancer
Oltean, S., & Bates, D. O. (2013) · Oncogene · doi:10.1038/onc.2013.533 · Cited by 680
SRSF2 Mutations Contribute to Myelodysplasia by Mutant-Specific Effects on Exon Recognition
Kim, E., Ilagan, J. O., Liang, Y., Daubner, G. M., Lee, S. C.-W., Ramakrishnan, A., Li, Y., Chung, Y. R., Micol, J.-B., Murphy, M. E., et al. (2015) · Cancer Cell · doi:10.1016/j.ccell.2015.04.006 · Cited by 575
Darman, R. B., Seiler, M., Agrawal, A. A., Lim, K., Peng, S., Aird, D. R., Bailey, S., Bhavsar, E. B., Chan, B., Colla, S., et al. (2015) · Cell Reports · doi:10.1016/j.celrep.2015.09.053 · Cited by 472
The RNA-binding protein repertoire of embryonic stem cells
Kwon, S. C., Yi, H., Eichelbaum, K., Föehr, S., Fischer, B., You, K. T., Castelló, A., Krijgsveld, J., Hentze, M. W., & Kim, V. N. (2013) · Nature Structural & Molecular Biology · doi:10.1038/nsmb.2638 · Cited by 462
Cell Motility Is Controlled by SF2/ASF through Alternative Splicing of the Ron Protooncogene
Ghigna, C., Giordano, S., Shen, H., Benvenuto, F., Castiglioni, F., Comoglio, P. M., Green, M. R., Riva, S., & Biamonti, G. (2005) · Molecular Cell · doi:10.1016/j.molcel.2005.10.026 · Cited by 387
Bechara, E., Sebestyén, E., Bernardis, I., Eyras, E., & Valcárcel, J. (2013) · Molecular Cell · doi:10.1016/j.molcel.2013.11.010 · Cited by 374
Self-citationMBNL proteins repress ES-cell-specific alternative splicing and reprogramming
Han, H. R., Irimia, M., Ross, P. J., Sung, H., Alipanahi, B., David, L., Golipour, A., Gabut, M., Michael, I. P., Nachman, E. N., et al. (2013) · Nature · doi:10.1038/nature12270 · Cited by 332
Leveraging transcript quantification for fast computation of alternative splicing profiles
Alamancos, G. P., Pagès, A., Trincado, J. L., Bellora, N., & Eyras, E. (2015) · RNA · doi:10.1261/rna.051557.115 · Cited by 285
Self-citationXue, Y., Liu, Z., Cao, J., Ma, Q., Gao, X., Wang, Q., Jin, C., Zhou, Y., Wen, L., & Ren, J. M. (2010) · Protein Engineering Design and Selection · doi:10.1093/protein/gzq094 · Cited by 246
The RNA-Binding Protein QKI Suppresses Cancer-Associated Aberrant Splicing
Zong, F.-Y., Fu, X., Wei, W., Luo, Y.-G., Heiner, M., Cao, L., Fang, Z., Fang, R., Lu, D., Ji, H., et al. (2014) · PLoS Genetics · doi:10.1371/journal.pgen.1004289 · Cited by 238
Golan‐Gerstl, R., Cohen, M., Shilo, A., Suh, S., Bakàcs, A., Coppola, L., & Karni, R. (2011) · Cancer Research · doi:10.1158/0008-5472.can-10-4410 · Cited by 233
Wang, Y., Chen, D., Qian, H., Tsai, Y., Shao, S., Liu, Q., Dominguez, D., & Wang, Z. (2014) · Cancer Cell · doi:10.1016/j.ccr.2014.07.010 · Cited by 224
SRp20 is a proto-oncogene critical for cell proliferation and tumor induction and maintenance
Jia, R., Li, C., McCoy, J. P., Deng, C., & Zheng, Z. (2010) · International Journal of Biological Sciences · doi:10.7150/ijbs.6.806 · Cited by 208
Sebestyén, E., Zawisza-Álvarez, M., & Eyras, E. (2015) · Nucleic Acids Research · doi:10.1093/nar/gku1392 · Cited by 185
Self-citationLGN regulates mitotic spindle orientation during epithelial morphogenesis
Zheng, Z., Zhu, H., Wan, Q., Liu, J., Xiao, Z., Siderovski, D. P., & Du, Q. (2010) · The Journal of Cell Biology · doi:10.1083/jcb.200910021 · Cited by 179
SF3B1 mutations constitute a novel therapeutic target in breast cancer
Maguire, S. L., Leonidou, A., Wai, P. T., Marchiò, C., Ng, C. K. Y., Sapino, A., Vincent‐Salomon, A., Reis-Filho, J. S., Weigelt, B., & Natrajan, R. (2014) · The Journal of Pathology · doi:10.1002/path.4483 · Cited by 178
Brooks, A. N., Choi, P. S., de Waal, L. M., Sharifnia, T., Imielinski, M. B., Saksena, G., Pedamallu, C. S., Sivachenko, A., Rosenberg, M. W., Chmielecki, J., et al. (2014) · PLoS ONE · doi:10.1371/journal.pone.0087361 · Cited by 173
Xiao, R., Sun, Y., Ding, J., Lin, S., Rose, D. W., Rosenfeld, M. G., Fu, X., & Li, X. (2007) · Molecular and Cellular Biology · doi:10.1128/mcb.00288-07 · Cited by 164
Misquitta-Ali, C. M., Cheng, E., O’Hanlon, D., Liu, G., McGlade, C. J., Tsao, M., & Blencowe, B. J. (2010) · Molecular and Cellular Biology · doi:10.1128/mcb.00709-10 · Cited by 162
Venables, J. P., Lapasset, L., Gadéa, G., Fort, P., Klinck, R., Irimia, M., Vignal, E., Thibault, P., Prinos, P., Chabot, B., et al. (2013) · Nature Communications · doi:10.1038/ncomms3480 · Cited by 153
Splicing factor SRSF6 promotes hyperplasia of sensitized skin
Jensen, M. A., Wilkinson, J. E., & Krainer, A. R. (2014) · Nature Structural & Molecular Biology · doi:10.1038/nsmb.2756 · Cited by 148
Vanharanta, S., Marney, C. B., Shu, W., Valiente, M., Zou, Y., Mele, A., Darnell, R. B., & Massagué, J. (2014) · eLife · doi:10.7554/elife.02734 · Cited by 146
Building Robust Transcriptomes with Master Splicing Factors
Jangi, M., & Sharp, P. A. (2014) · Cell · doi:10.1016/j.cell.2014.09.054 · Cited by 141
Watermann, D. O., Tang, Y., Hausen, A. Z., Jäger, M., Stamm, S., & Stickeler, E. (2006) · Cancer Research · doi:10.1158/0008-5472.can-04-3294 · Cited by 136
Goehe, R. W., Shultz, J. C., Murudkar, C. S., Usanovic, S., Lamour, N. F., Massey, D. H., Zhang, L., Camidge, D. R., Shay, J. W., Minna, J. D., et al. (2010) · Journal of Clinical Investigation · doi:10.1172/jci43552 · Cited by 119
NuMA phosphorylation by CDK1 couples mitotic progression with cortical dynein function
Kotak, S., Busso, C., & Gönczy, P. (2013) · The EMBO Journal · doi:10.1038/emboj.2013.172 · Cited by 113
Alló, M., Agirre, E., Bessonov, S., Bertucci, P., Acuña, L. I. G., Buggiano, V., Bellora, N., Singh, B., Petrillo, E., Blaustein, M., et al. (2014) · Proceedings of the National Academy of Sciences · doi:10.1073/pnas.1416858111 · Cited by 107
Self-citationFunctional Variants in Cell Death Pathway Genes and Risk of Pancreatic Cancer
Yang, M., Sun, T., Wang, L., Yu, D., Zhang, X., Miao, X., Liu, J., Zhao, D., Li, H., Tan, W., et al. (2008) · Clinical Cancer Research · doi:10.1158/1078-0432.ccr-08-0177 · Cited by 89
The multi‐functional serpin, protein C inhibitor: beyond thrombosis and hemostasis
Suzuki, K. (2008) · Journal of Thrombosis and Haemostasis · doi:10.1111/j.1538-7836.2008.03181.x · Cited by 64
Best, A. J., James, K., Dalgliesh, C., Hong, E., Chadegani, M. K., Curk, T., Xu, Y., Danilenko, M., Hussain, R., Keavney, B. D., et al. (2014) · Nature Communications · doi:10.1038/ncomms5760 · Cited by 64
Association of the NuMA region on chromosome 11q13 with breast cancer susceptibility
Kammerer, S., Roth, R. B., Hoyal, C. R., Reneland, R., Marnellos, G., Kiechle, M. B., Schwarz-Boeger, U., Griffiths, L. R., Ebner, F., Rehbock, J., et al. (2005) · Proceedings of the National Academy of Sciences · doi:10.1073/pnas.0409806102 · Cited by 50
Huang, C., Shen, C., Wang, H.-W., Wu, P., & Cheng, C. (2007) · Clinica Chimica Acta · doi:10.1016/j.cca.2007.06.001 · Cited by 46
Discovery of a Splicing Regulator Required for Cell Cycle Progression
Suvorova, E. S., Croken, M. M., Kratzer, S., Ting, L.-M., de Felipe, M. C., Balu, B., Markillie, L. M., Weiss, L. M., Kim, K., & White, M. W. (2013) · PLoS Genetics · doi:10.1371/journal.pgen.1003305 · Cited by 40
Crosstalk between Wnt Signaling and RNA Processing in Colorectal Cancer
Bordonaro, M. (2013) · Journal of Cancer · doi:10.7150/jca.5470 · Cited by 40
Dorman, S., Viner, C., & Rogan, P. K. (2014) · Scientific Reports · doi:10.1038/srep07063 · Cited by 33
SRSF2 promotes splicing and transcription of exon 11 included isoform in Ron proto-oncogene
Moon, H., Cho, S., Loh, T. J., Oh, H. K., Jang, H. N., Zhou, J., Kwon, Y.-S., Liao, D. J., Jun, Y., Eom, S.-H., et al. (2014) · Biochimica et Biophysica Acta (BBA) - Gene Regulatory Mechanisms · doi:10.1016/j.bbagrm.2014.09.003 · Cited by 28
Weems, J. M., & Klemke, R. L. (2011) · Cancer Research · doi:10.1158/1538-7445.am2011-4464 · Cited by 8
Vanharanta, S., Marney, C. B., Shu, W., Valiente, M., Zou, Y., Mele, A., Darnell, R. B., & Massagué, J. (2014) · eLife · doi:10.7554/elife.02734.023 · Cited by 4
The Potential of Targeting Splicing for Cancer Therapy
Grosso, A. R., & Carmo‐Fonseca, M. (2013) · Cancer drug discovery and develogment/Cancer drug discovery and development · doi:10.1007/978-1-4614-8039-6_13 · Cited by 3
Cited by
Sorted by citations
Transcriptome-wide isoform-level dysregulation in ASD, schizophrenia, and bipolar disorder
Gandal, M. J., Zhang, P., Hadjimichael, E., Walker, R. L., Chen, C., Liu, S., Won, H., van Bakel, H., Varghese, M., Wang, Y., et al. (2018) · Science · doi:10.1126/science.aat8127 · Cited by 1,247
RNA-Binding Proteins in Cancer: Old Players and New Actors
Pereira, B., Billaud, M., & Almeida, R. (2017) · Trends in cancer · doi:10.1016/j.trecan.2017.05.003 · Cited by 774
Roles and mechanisms of alternative splicing in cancer — implications for care
Bonnal, S., López‐Oreja, I., & Valcárcel, J. (2020) · Nature Reviews Clinical Oncology · doi:10.1038/s41571-020-0350-x · Cited by 760
Self-citationTrincado, J. L., Entizne, J. C., Hysenaj, G., Singh, B., Škalič, M., Elliott, D. J., & Eyras, E. (2018) · Genome biology · doi:10.1186/s13059-018-1417-1 · Cited by 720
Self-citationRNA splicing dysregulation and the hallmarks of cancer
Bradley, R. K., & Anczuków, O. (2023) · Nature Reviews Cancer · doi:10.1038/s41568-022-00541-7 · Cited by 579
Metadata
- Authors
- Sebestyén, E., Singh, B., Miñana, B., Pagès, A., Mateo, F., Pujana, M. A., Valcárcel, J., & Eyras, E.
- Affiliations
- Universitat Pompeu Fabra (ES)
- Institut d'Investigació Biomédica de Bellvitge (ES)
- Institució Catalana de Recerca i Estudis Avançats (ES)
- Venue
- Genome Research
- Publisher
- Cold Spring Harbor Laboratory
- Published
- 2016-04-13
- Volume
- 26
- Issue
- 6
- Pages
- 732-744
- ISSN
- 1088-9051 (ISSN-L)
- 1549-5469
- PMC
- PMC4889968
- OpenAlex
- W2338046461
- Cited by
- 276
- References
- 61
- Citations by year
- 2026: 12 · 2025: 18 · 2024: 25 · 2023: 21 · 2022: 38 · 2021: 45 · 2020: 43 · 2019: 27 · 2018: 22 · 2017: 22 · 2016: 3
- Type
- posted content
- Language
- en
- Open access
- bronze
- doi.org
- Locations
- Genome Research (publishedVersion)
- bioRxiv (Cold Spring Harbor Laboratory) (acceptedVersion, cc-by)
- Europe PMC (PubMed Central) (publishedVersion, cc-by-nc)
- PubMed Central (publishedVersion, cc-by-nc)
- PubMed Central (publishedVersion)
- PubMed (publishedVersion)
- Repositori digital de la UPF (Universitat Pompeu Fabra) (publishedVersion, cc-by-nc)
- HighWire Press Open Archive (submittedVersion)
- RECERCAT (Consorci de Serveis Universitaris de Catalunya) (submittedVersion, cc-by-nc)
- Funders
- Ministerio de Economía y Competitividad
- European Commission
- FEDER (BIO2014-52566-R, PIE13/00022-ONCOPROFILE, PI15/00854, RD12/0036/0008)
- Consolider RNAREG (CSD2009-00080)
- Agència de Gestió d'Ajuts Universitaris i de Recerca (SGR2014-1121)
- Sandra Ibarra Foundation for Cancer (FSI2013)
- Fundación Botín
- Santander Universities Global Division
- MINECO
- AGAUR (SGR2014-364)
- AECC
- Instituto de Salud Carlos III
- Topics
- Life Sciences › Biochemistry, Genetics and Molecular Biology › Molecular Biology › RNA Research and Splicing
- Life Sciences › Biochemistry, Genetics and Molecular Biology › Cancer Research › Cancer-related molecular mechanisms research
- Life Sciences › Biochemistry, Genetics and Molecular Biology › Cancer Research › Cancer Genomics and Diagnostics
- Keywords
- alternative splicing, RNA-binding proteins, cancer, solid tumors, MBNL1, NUMA1, copy number variation, gene expression changes, binding motifs, centrosome amplification, cell proliferation, mammary epithelial cells, undifferentiated cells
- MeSH terms
- RNA Splicing Factors, Binding Sites, Humans, Mutation, Neoplasms, Genome, Human, Gene Expression Regulation, Neoplastic, Alternative Splicing, Amino Acid Motifs, Gene Expression Profiling, Cell Proliferation, Transcriptome
About these checks
Registry, retraction, Cites and statistics results are computed, not judged, with one exception: a printed reference that no index lists is read once by a model before it counts as a citation error. Claims are extracted by a model and kept only when their quote appears verbatim in the text; each cited source is then checked, with a model’s help, for whether it says what the claim relies on. Those verdicts can be wrong — read the claim’s quote and the cited source before relying on one.
Statistics and arithmetic are recomputed, not judged.
Confidence bands are shown only for fields calibrated on our annotated test set. None is calibrated yet, so no band is shown.
What counts as a claim ›How we measure confidence ›How we check this ›
Are you an author, or do you see a problem with this page? Request a review
