

The DOI matches its Crossref record; 2 of the 2 references it cites were found in a registry or an index.
Combination of short-read, long-read, and optical mapping assemblies reveals large-scale tandem repeat arrays with population genetic implications
Abstract
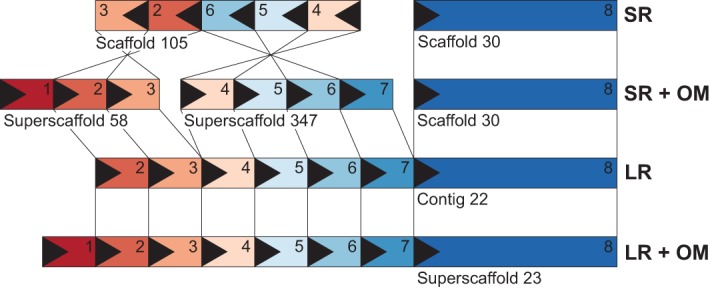
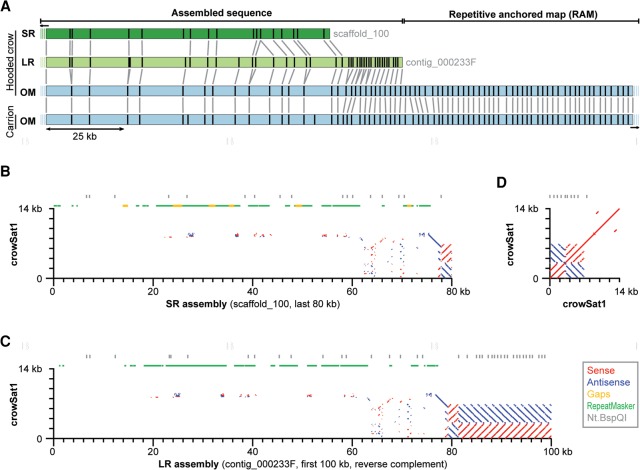
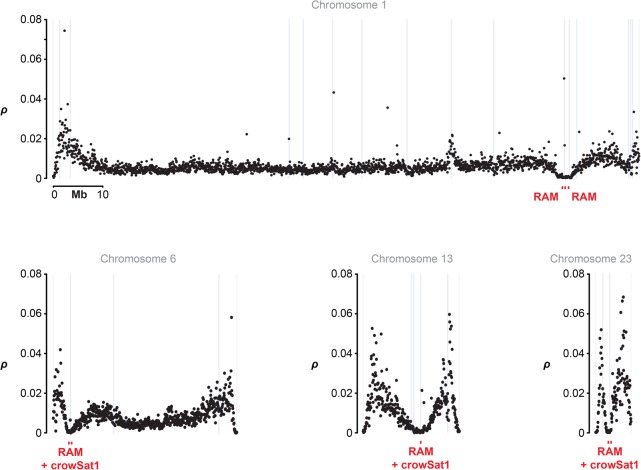
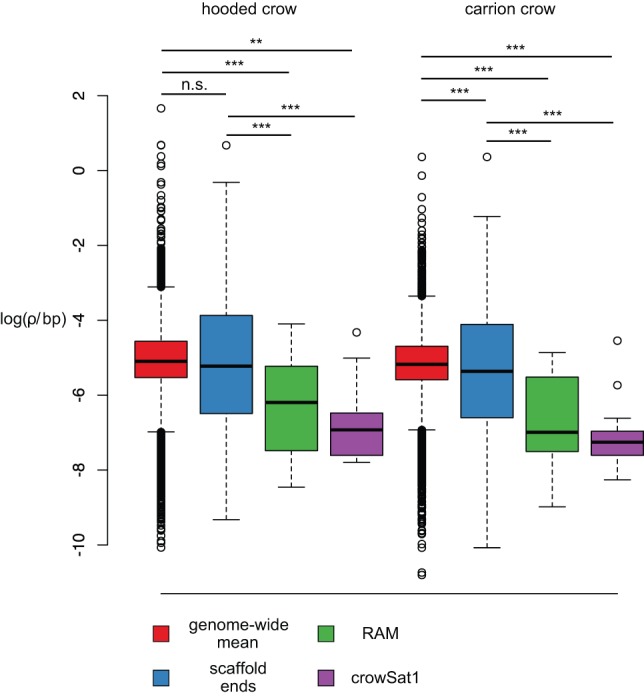
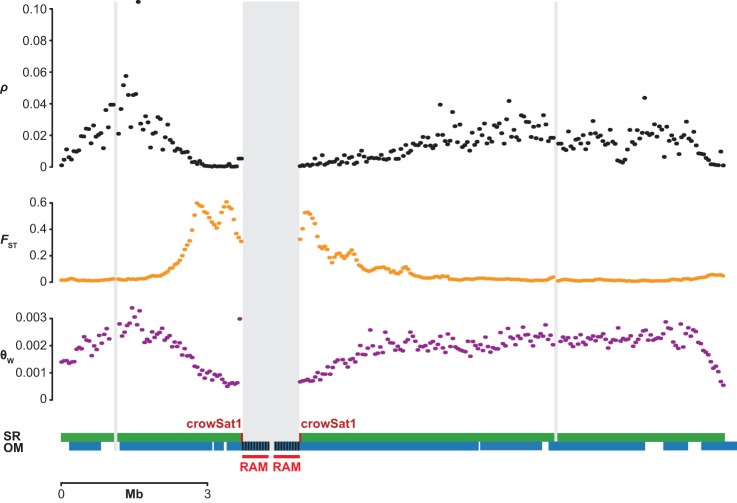
Accurate and contiguous genome assembly is key to a comprehensive understanding of the processes shaping genomic diversity and evolution. Yet, it is frequently constrained by constitutive heterochromatin, usually characterized by highly repetitive DNA. As a key feature of genome architecture associated with centromeric and subtelomeric regions, it locally influences meiotic recombination. In this study, we assess the impact of large tandem repeat arrays on the recombination rate landscape in an avian speciation model, the Eurasian crow. We assembled two high-quality genome references using single-molecule real-time sequencing (long-read assembly [LR]) and single-molecule optical maps (optical map assembly [OM]). A three-way comparison including the published short-read assembly (SR) constructed for the same individual allowed assessing assembly properties and pinpointing misassemblies. By combining information from all three assemblies, we characterized 36 previously unidentified large repetitive regions in the proximity of sequence assembly breakpoints, the majority of which contained complex arrays of a 14-kb satellite repeat or its 1.2-kb subunit. Using whole-genome population resequencing data, we estimated the population-scaled recombination rate (ρ) and found it to be significantly reduced in these regions. These findings are consistent with an effect of low recombination in regions adjacent to centromeric or subtelomeric heterochromatin and add to our understanding of the processes generating widespread heterogeneity in genetic diversity and differentiation along the genome. By combining three different technologies, our results highlight the importance of adding a layer of information on genome structure that is inaccessible to each approach independently.
Overview
The claims and statistics of this paper haven’t been checked yet.
Run the check — free, no account needed. It reads the open-access text and checks the sources it cites.
Integrity signals
Registry
Cites
Statistics
Figures
Verification
Claims the paper makes
The claims and statistics of this paper haven’t been checked yet.
Run the check — free, no account needed. It reads the open-access text and checks the sources it cites.
Claims other papers make about this one
Each is checked against this paper’s own text: does it say what the citing paper says it does?
In the citing paper
“The combination of long and short reads has been shown to be beneficial for resolving tandem repeats in genomes (135), and it should create a better foundation for characterizing large gene families that might be underreported.”
From Tandem repeats lead to sequence assembly errors and impose multi-level challenges for genome and protein databases (2019) · cites this paper as [135]
In the citing paper
“The combination of long and short reads has been shown to be beneficial for resolving tandem repeats in genomes (135), and it should create a better foundation for characterizing large gene families that might be underreported.”
From Tandem repeats lead to sequence assembly errors and impose multi-level challenges for genome and protein databases (2019) · cites this paper as [135]
Self-check
Percentages, sums and reported differences re-computed from the paper’s own numbers.
The self-check needs the paper’s full text.
Citations
Cites
International Chicken Genome Sequencing Consortium (2004) · Nature · doi:10.1038/nature03154 · Cited by 2,750
Long-read sequence assembly of the gorilla genome
Gordon, D., Huddleston, J., Chaisson, M. J. P., Hill, C. M., Kronenberg, Z. N., Munson, K. M., Malig, M., Raja, A., Fiddes, I., Hillier, L. W., et al. (2016) · Science · doi:10.1126/science.aae0344 · Cited by 333
Research works printed but not linked: 82
- 10.1006/jmbi.1990.9999 · DOI · Paper page
- Anantharaman T , Mishra B . 2001. False positives in genomic map assembly and sequence validation. In Algorithms in bioinformatics first international workshop, WABI 2001, Århus, Denmark. · DOI
- 10.1073/pnas.1416622112 · DOI
- 10.1101/gr.101410.109 · DOI
- 10.1186/s13100-015-0041-9 · DOI
- 10.18637/jss.v067.i01 · DOI · Paper page
- 10.1126/science.1183439 · DOI · Paper page
- 10.1007/BF00056765 · DOI
- 10.1038/nbt.3238 · DOI
- 10.1101/064352 · DOI
- 10.1101/gr.196485.115 · DOI
- 2008, Recombination and speciation: loci near centromeres are more differentiated than loci near telomeres between subspecies of the European rabbit (Oryctolagus cuniculus), Genetics, 181, 593
- 10.1038/nrg3933 · DOI
- 10.1371/journal.pgen.1003090 · DOI
- 10.1371/journal.pbio.1000112 · DOI
- 10.1038/nrg3425 · DOI
- 10.1101/gr.213660.116 · DOI
- 10.1093/bioinformatics/btr330 · DOI
- 10.1146/annurev-genet-110711-155423 · DOI
- 10.1016/S0092-8674(00)80084-7 · DOI
- 10.1371/journal.pone.0030377 · DOI
- 10.1038/nrg1322 · DOI
- 10.1126/science.1162986 · DOI · Paper page
- 10.1111/eva.12178 · DOI
- 10.1146/annurev-ecolsys-110411-160327 · DOI
- 10.1016/j.tree.2013.09.008 · DOI
- 2016, Determinants of genetic diversity, Nat Rev Genet, 17, 422, 10.1038/nrg.2016.58 · DOI
- 10.1016/j.bbamcr.2008.07.018 · DOI
- 10.3109/10409238.2012.675644 · DOI
- 10.1038/nrg2008 · DOI · Paper page
- Harris RS . 2007. “Improved pairwise alignment of genomic DNA.” PhD thesis, Pennsylvania State University, State College, PA.
- 10.1126/science.1062939 · DOI
- 10.1111/evo.12633 · DOI · Paper page
- 10.1101/gr.216465.116 · DOI
- 2016, Evolution of bird genomes—a transposon's-eye view, Ann N Y Acad Sci, 1389, 164
- 10.1093/molbev/mst010 · DOI · Paper page
- 10.1111/mec.12810 · DOI
- 10.1101/gr.113985.110 · DOI
- 10.1146/annurev-animal-090414-014900 · DOI · Paper page
- 10.1073/pnas.0801848105 · DOI
- 2016, Evolutionary signals of selection on cognition from the great tit genome and methylome, Nat Commun, 7, 10474, 10.1038/ncomms10474 · DOI
- 10.1038/nbt.2303 · DOI
- 10.1126/science.1181369 · DOI · Paper page
- 10.1016/j.tree.2016.02.001 · DOI
- 10.1007/s10577-015-9488-2 · DOI
- 10.1101/gr.159624.113 · DOI
- 10.1126/science.1117196 · DOI · Paper page
- Myers G . 2014. Efficient local alignment discovery amongst noisy long reads. In Algorithms in bioinformatics (ed. Brown D , Morgenstern B ), pp. 52–67. Springer, Berlin Heidelberg, Germany. · DOI
- 10.1038/nrg3367 · DOI · Paper page
- Nguyen JV . 2010. “Genomic mapping: a statistical and algorithmic analysis of the optical mapping system.” Doctoral dissertation, University of Southern California, Los Angeles.
- 10.1038/nmeth.3454 · DOI
- 10.1016/j.gde.2008.01.021 · DOI
- 10.1186/gb-2008-9-3-r55 · DOI
- 10.1093/gbe/evw009 · DOI
- 10.1007/s00412-014-0462-0 · DOI
- 10.1126/science.1253226 · DOI
- 10.1111/mec.13353 · DOI
- 10.1086/519795 · DOI · Paper page
- 10.1111/j.1365-294X.2012.05509.x · DOI
- 10.1111/mec.12322 · DOI
- 10.1186/1471-2164-15-1060 · DOI
- 2001, A karyological study of some corvine birds (Corvidae, Aves), Russ J Genet, 37, 796, 10.1023/A:1016703127516 · DOI
- 10.1016/j.tig.2004.08.008 · DOI
- 10.1186/1756-8935-8-3 · DOI
- 10.1093/bioinformatics/btw101 · DOI
- 10.1101/gr.106245.110 · DOI
- 10.1126/science.aad0843 · DOI
- 10.1126/science.1139815 · DOI
- 2016, BioNano genome mapping of individual chromosomes supports physical mapping and sequence assembly in complex plant genomes, Plant Biotechnol J, 14, 1523, 10.1111/pbi.12513 · DOI
- 10.1101/067447 · DOI
- 10.1038/nrg1227 · DOI
- 10.1016/j.fgb.2015.08.010 · DOI
- 10.1073/pnas.0604040103 · DOI
- 1986, Size and structure of the bird genome—I. DNA content of 48 species of neognathae, Comp Biochem Physiol Part B Comp Biochem, 85, 61, 10.1016/0305-0491(86)90221-X · DOI
- 2016, Chromosomal-level assembly of the Asian seabass genome using long sequence reads and multi-layered scaffolding, PLoS Genet, 12, e1005954, 10.1371/journal.pgen.1005954 · DOI
- 2016, Evolution of heterogeneous genome differentiation across multiple contact zones in a crow species complex, Nat Commun, 7, 13195, 10.1038/ncomms13195 · DOI
- 10.1038/nature08819 · DOI
- 10.1016/S0959-437X(05)80200-X · DOI
- 2017, Making sense of genomic islands of differentiation in light of speciation, Nat Rev Genet, 18, 87, 10.1038/nrg.2016.133 · DOI
- 10.1093/nar/gkl1044 · DOI
- 10.1038/nrg3174 · DOI · Paper page
- 10.7554/eLife.02630 · DOI
Cited by
Sorted by citations
Assembly of long, error-prone reads using repeat graphs
Kolmogorov, M., Yuan, J., Lin, Y., & Pevzner, P. A. (2019) · Nature Biotechnology · doi:10.1038/s41587-019-0072-8 · Cited by 5,986
Opportunities and challenges in long-read sequencing data analysis
Amarasinghe, S. L., Su, S., Dong, X., Zappia, L., Ritchie, M. E., & Gouil, Q. (2020) · Genome Biology · doi:10.1186/s13059-020-1935-5 · Cited by 2,530
Tørresen, O. K., Star, B., Mier, P., Andrade-Navarro, M. A., Bateman, A., Jarnot, P., Gruca, A., Grynberg, M., Kajava, A. V., Promponas, V. J., et al. (2019) · Nucleic Acids Research · doi:10.1093/nar/gkz841 · Cited by 347
Computational methods for chromosome-scale haplotype reconstruction
Garg, S. (2021) · Genome Biology · doi:10.1186/s13059-021-02328-9 · Cited by 116
Metadata
- Authors
- Weissensteiner, M. H., Pang, A. W. C., Bunikis, I., Höijer, I., Vinnere-Petterson, O., Suh, A., & Wolf, J. B. W.
- Venue
- Genome Research
- Publisher
- Cold Spring Harbor Laboratory
- Published
- 2017-03-30
- Volume
- 27
- Issue
- 5
- Pages
- 697-708
- ISSN
- 1088-9051
- 1549-5469
- PMC
- PMC5411765
- Cited by
- 104
- References
- 2
- Language
- en
- Funders
- Knut and Alice Wallenberg Foundation
- Swedish National Infrastructure for Computing
- Swedish Research Council (621-2010-5553)
- European Research Council (ERCStG-336536)
About these checks
Registry, retraction, Cites and statistics results are computed, not judged, with one exception: a printed reference that no index lists is read once by a model before it counts as a citation error. Claims are extracted by a model and kept only when their quote appears verbatim in the text; each cited source is then checked, with a model’s help, for whether it says what the claim relies on. Those verdicts can be wrong — read the claim’s quote and the cited source before relying on one.
Statistics and arithmetic are recomputed, not judged.
Confidence bands are shown only for fields calibrated on our annotated test set. None is calibrated yet, so no band is shown.
What counts as a claim ›How we measure confidence ›How we check this ›
Are you an author, or do you see a problem with this page? Request a review
