

The DOI matches its Crossref record, with a small difference in title or year; 6 of the 6 references it cites were found in a registry or an index.
CBX 7 and miR‐9 are part of an autoregulatory loop controlling p16INK4a
Abstract
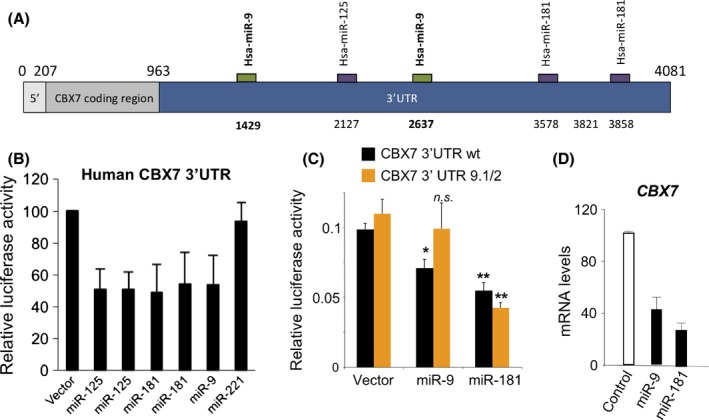
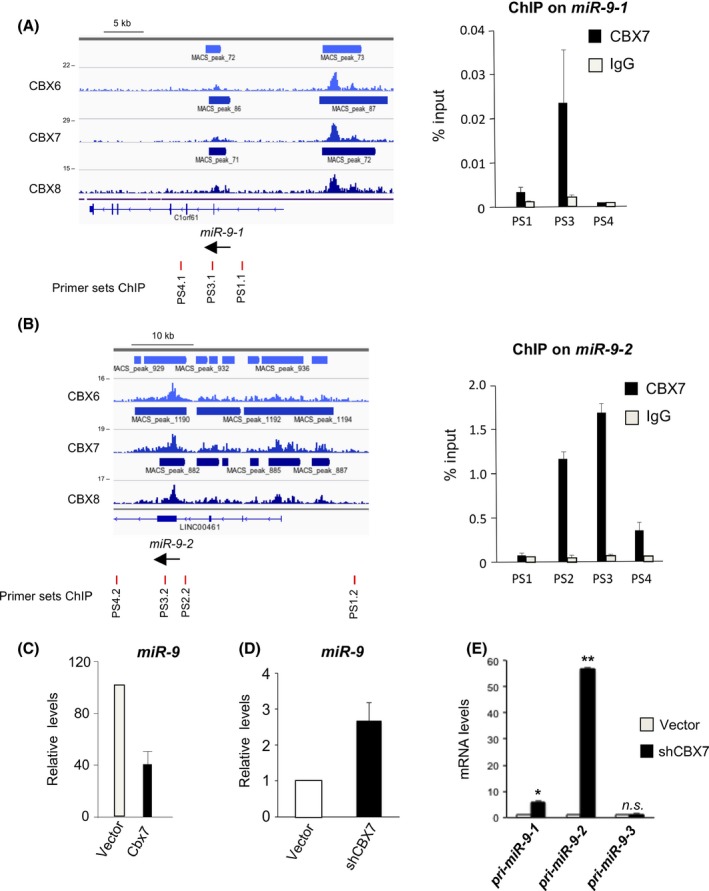
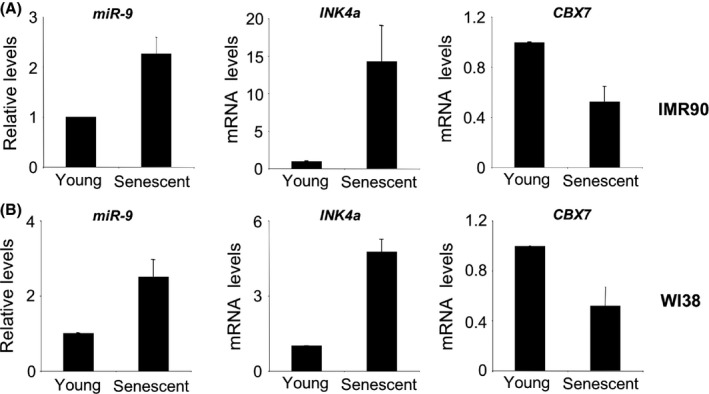
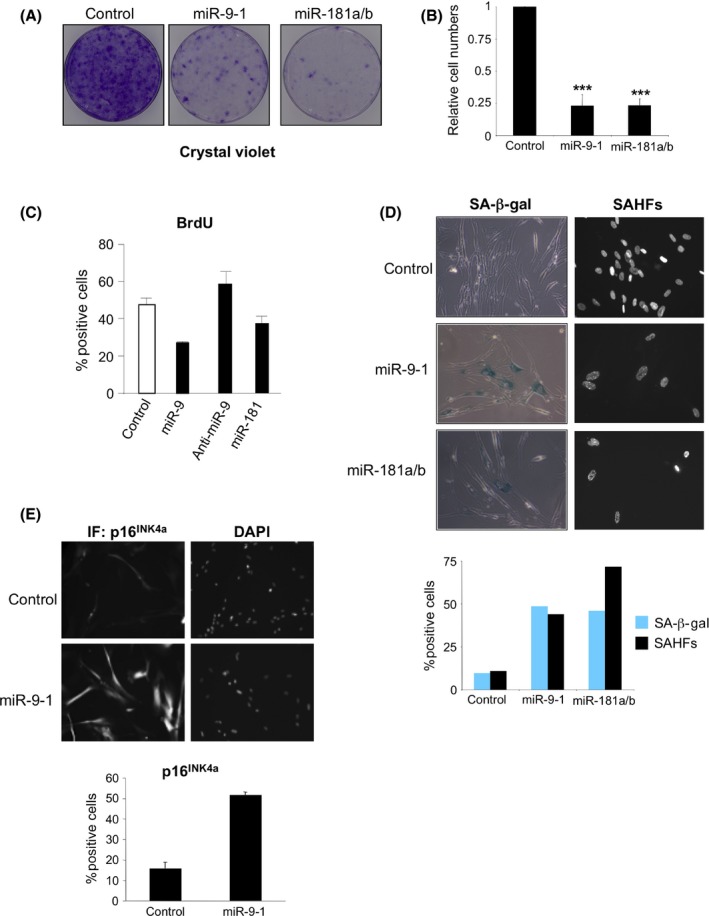
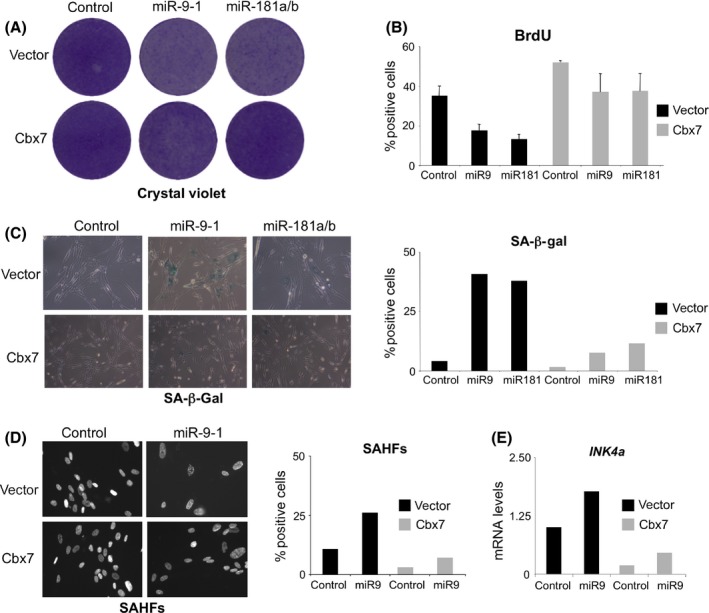
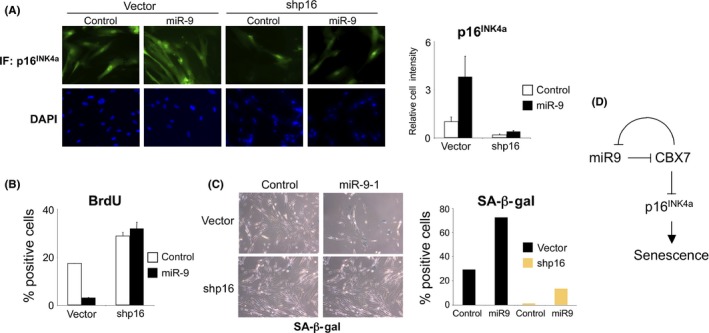
Summary: Polycomb repressive complexes (PRC 1 and PRC 2) are epigenetic regulators that act in coordination to influence multiple cellular processes including pluripotency, differentiation, cancer and senescence. The role of PRC s in senescence can be mostly explained by their ability to repress the INK 4/ARF locus. CBX 7 is one of five mammalian orthologues of Drosophila Polycomb that forms part of PRC 1. Despite the relevance of CBX 7 for regulating senescence and pluripotency, we have a limited understanding of how the expression of CBX 7 is regulated. Here we report that the miR‐9 family of micro RNA s (mi RNAS) downregulates the expression of CBX 7. In turn, CBX 7 represses miR‐9‐1 and miR‐9‐2 as part of a regulatory negative feedback loop. The miR‐9/CBX 7 feedback loop is a regulatory module contributing to induction of the cyclin‐dependent kinase inhibitor (CDKI) p16INK4a during senescence. The ability of the miR‐9 family to regulate senescence could have implications for understanding the role of miR‐9 in cancer and aging.
Overview
The claims and statistics of this paper haven’t been checked yet.
Run the check — free, no account needed. It reads the open-access text and checks the sources it cites.
Integrity signals
Registry
Cites
Statistics
Figures
Verification
Claims the paper makes
The claims and statistics of this paper haven’t been checked yet.
Run the check — free, no account needed. It reads the open-access text and checks the sources it cites.
Claims other papers make about this one
Each is checked against this paper’s own text: does it say what the citing paper says it does?
In the citing paper
“Similarly, miR-9, involved in neural stem cell maintenance and differentiation, is capable of interplay with miR-128-3p in regulating the activity of the PRC1 by targeting its component CBX7 (Chromobox protein homolog 7).164”
From MiR-128-3p – a gray eminence of the human central nervous system (2024) · cites this paper as [164]
Self-check
Percentages, sums and reported differences re-computed from the paper’s own numbers.
The self-check needs the paper’s full text.
Citations
Cites
Chemokine signaling via the CXCR2 receptor reinforces senescence
Acosta, J. C., O'Loghlen, A., Banito, A., Guijarro, M. V., Augert, A., Raguz, S., Fumagalli, M., Da Costa, M., Brown, C., Popov, N., et al. (2008) · Cell · doi:10.1016/j.cell.2008.03.038 · Cited by 1,801 · cited 3×
“Methods used for retrovirus production and infection have been described previously (Acosta et al., 2008).”
InfluentialSelf-citationThe Regulation of INK4/ARF in Cancer and Aging
Kim, W. Y., & Sharpless, N. E. (2006) · Cell · doi:10.1016/j.cell.2006.10.003 · Cited by 1,009
Regulation of the INK4b–ARF–INK4a tumour suppressor locus: all for one or one for all
Gil, J., & Peters, G. (2006) · Nature Reviews Molecular Cell Biology · doi:10.1038/nrm1987 · Cited by 843
Self-citationCoppé, J.-P., Rodier, F., Patil, C. K., Freund, A., Desprez, P.-Y., & Campisi, J. (2011) · Journal of Biological Chemistry · doi:10.1074/jbc.m111.257071 · Cited by 506
Inside and out: the activities of senescence in cancer
Pérez-Mancera, P. A., Young, A. R. J., & Narita, M. (2014) · Nature Reviews Cancer · doi:10.1038/nrc3773 · Cited by 462 · cited 1×
“Senescence induced in response to oncogenes has been recognized as a tumour suppressor mechanism (Kuilman et al., 2010; Perez-Mancera et al., 2014).”
Cellular senescence mediated by p16INK4A-coupled miRNA pathways
Overhoff, M. G., Garbe, J. C., Koh, J., Stampfer, M. R., Beach, D. H., & Bishop, C. L. (2014) · Nucleic Acids Research · doi:10.1093/nar/gkt1096 · Cited by 77
Research works printed but not linked: 39
- 10.1126/science.1155472 · DOI
- 10.1038/nature02871 · DOI · Paper page
- 10.1101/gad.511109 · DOI · Paper page
- 10.1016/S0092-8674(04)00045-5 · DOI
- 10.1016/j.cell.2009.01.002 · DOI · Paper page
- 10.1038/sj.onc.1208735 · DOI
- 10.1093/nar/gkm995 · DOI
- 10.1093/emboj/cdf289 · DOI · Paper page
- 10.1016/j.cell.2007.07.003 · DOI · Paper page
- 10.1016/j.stem.2010.02.015 · DOI · Paper page
- 10.1038/leu.2013.357 · DOI
- 10.1002/ijc.23948 · DOI
- 10.1101/gr.082701.108 · DOI · Paper page
- 10.1016/j.tcb.2014.06.005 · DOI
- 10.1038/ncb1077 · DOI · Paper page
- 10.1073/pnas.1111780109 · DOI
- 10.1016/j.ejca.2010.01.033 · DOI
- 10.1101/gad.1971610 · DOI · Paper page
- 10.1101/gad.560310 · DOI
- Liu N, 2012, MicroRNA‐9 suppresses uveal melanoma cell migration and invasion through the NF‐kappaB1 pathway, Oncol. Rep., 28, 961
- 10.1016/j.stem.2012.06.005 · DOI
- 10.1038/ncb2024 · DOI
- 10.1111/j.1750-3639.2009.00328.x · DOI · Paper page
- 10.1016/j.stem.2011.12.006 · DOI
- 10.1038/nrm3823 · DOI · Paper page
- 10.1016/j.cell.2008.09.017 · DOI
- 10.1007/s11357-012-9440-8 · DOI
- 10.1016/j.stem.2011.12.004 · DOI
- 10.1038/onc.2014.335 · DOI
- 10.1158/0008-5472.CAN-08-0695 · DOI
- 10.1186/gb-2014-15-2-r23 · DOI · Paper page
- 10.1073/pnas.0608721104 · DOI
- 10.1074/jbc.M111.335943 · DOI
- 10.1038/nrm2763 · DOI
- 10.1016/j.stem.2010.03.010 · DOI
- 10.1016/j.cell.2006.02.037 · DOI
- Yu T, 2013, MicroRNA‐9 inhibits the proliferation of oral squamous cell carcinoma cells by suppressing expression of CXCR4 via the Wnt/beta‐catenin signaling pathway, Oncogene, 34, 4069
- 10.1038/nsmb.1576 · DOI · Paper page
- 10.1016/j.stem.2014.04.007 · DOI
Cited by
Sorted by citations
Integrin Beta 3 Regulates Cellular Senescence by Activating the TGF-β Pathway
Rapisarda, V., Borghesan, M., Miguela, V., Encheva, V., Snijders, A. P., Lujambio, A., & O’Loghlen, A. (2017) · Cell Reports · doi:10.1016/j.celrep.2017.02.012 · Cited by 190
Self-citationMicroRNA controls of cellular senescence
Suh, N. (2018) · BMB Reports · doi:10.5483/bmbrep.2018.51.10.209 · Cited by 78
MiR-128-3p – a gray eminence of the human central nervous system
Kiel, K., Król, S. K., Bronisz, A., & Godlewski, J. (2024) · Molecular Therapy Nucleic Acids · doi:10.1016/j.omtn.2024.102141 · Cited by 15
Metadata
- Authors
- O'Loghlen, A., Brookes, S., Martin, N., Rapisarda, V., Peters, G., & Gil, J.
- Affiliations
- Cell Proliferation Group MRC Clinical Sciences Centre Imperial College London Hammersmith Campus London W12 0NN UK
- Epigenetics & Cellular Senescence Group Blizard Institute Barts and The London School of Medicine and Dentistry Queen Mary University of London 4 Newark Street London E1 2AT UK
- Molecular Oncology Laboratory CRUK London Research Institute 44 Lincoln's Inn Fields London WC2A 3LY UK
- Venue
- Aging Cell
- Publisher
- Wiley
- Published
- 2015-09-29
- Volume
- 14
- Issue
- 6
- Pages
- 1113-1121
- ISSN
- 1474-9718
- 1474-9726
- PMC
- PMC4693451
- Cited by
- 23
- References
- 6
- Language
- en
- Funders
- Medical Research Council (A652 5PZ00)
- European Molecular Biology Organization
- Marie Curie fellowships
- London Research Institute by Cancer Research UK
About these checks
Registry, retraction, Cites and statistics results are computed, not judged, with one exception: a printed reference that no index lists is read once by a model before it counts as a citation error. Claims are extracted by a model and kept only when their quote appears verbatim in the text; each cited source is then checked, with a model’s help, for whether it says what the claim relies on. Those verdicts can be wrong — read the claim’s quote and the cited source before relying on one.
Statistics and arithmetic are recomputed, not judged.
Confidence bands are shown only for fields calibrated on our annotated test set. None is calibrated yet, so no band is shown.
What counts as a claim ›How we measure confidence ›How we check this ›
Are you an author, or do you see a problem with this page? Request a review
How to cite
Cite CoChat for the checks on this page, and the paper for its own findings.
- This page
- CoChat. (2026). Citation check: CBX 7 and miR‐9 are part of an autoregulatory loop controlling p16INK4a. https://app.cochat.ai/papers/10.1111/acel.12404
- The paper
- O'Loghlen, A., Brookes, S., Martin, N., Rapisarda, V., Peters, G., & Gil, J. (2015). CBX 7 and miR‐9 are part of an autoregulatory loop controlling p16INK4a. Aging Cell. https://doi.org/10.1111/acel.12404
