

The DOI matches its Crossref record; 17 of the 17 references it cites were found in a registry or an index.
Biological mechanisms of aging predict age-related disease co-occurrence in patients
Abstract
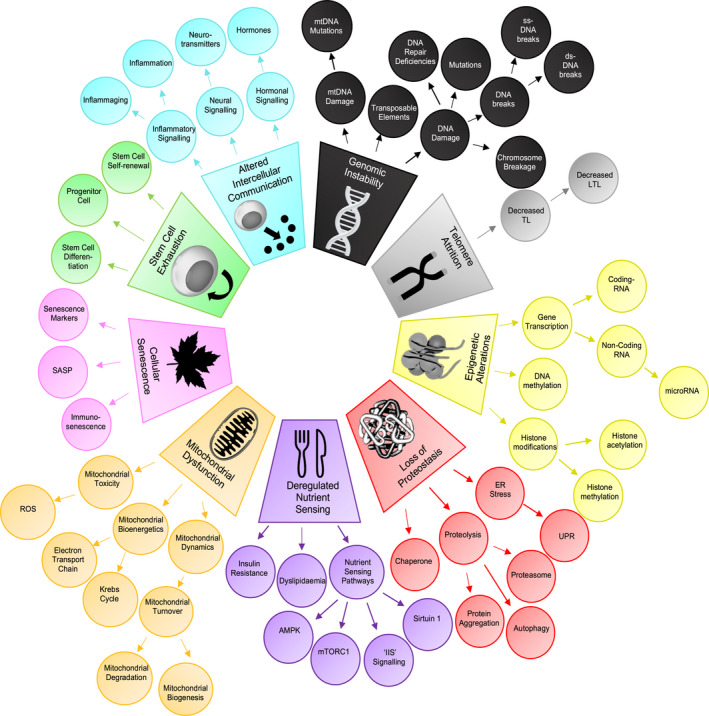
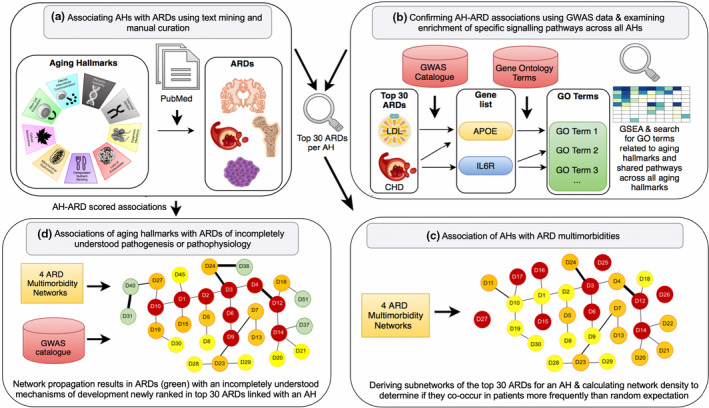
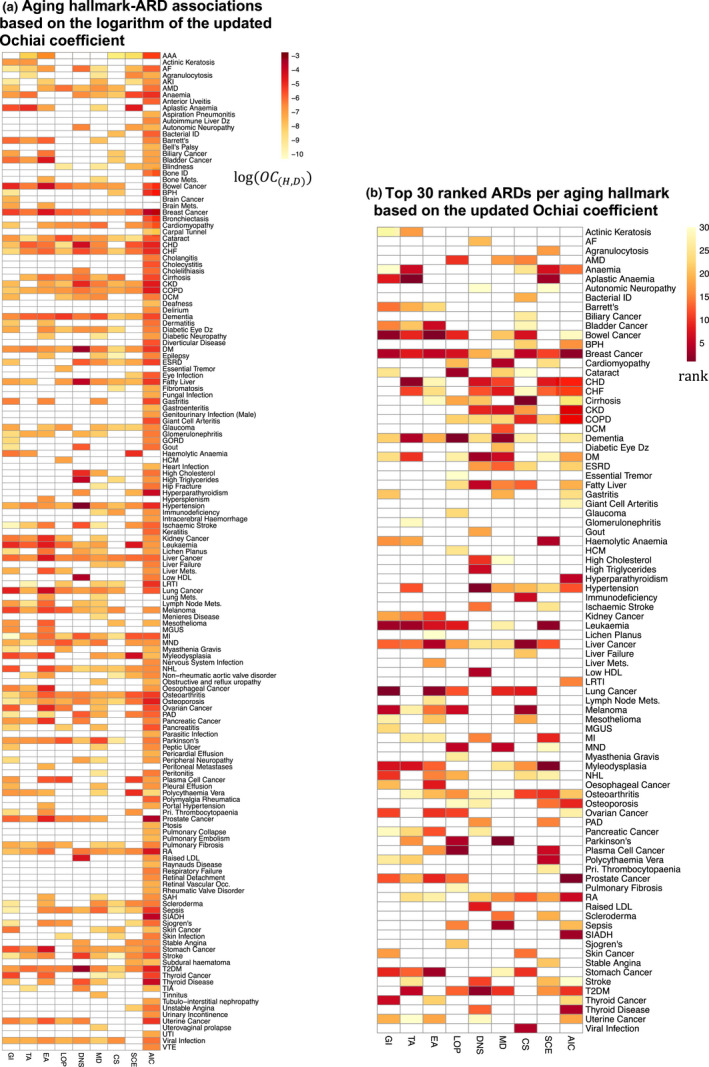
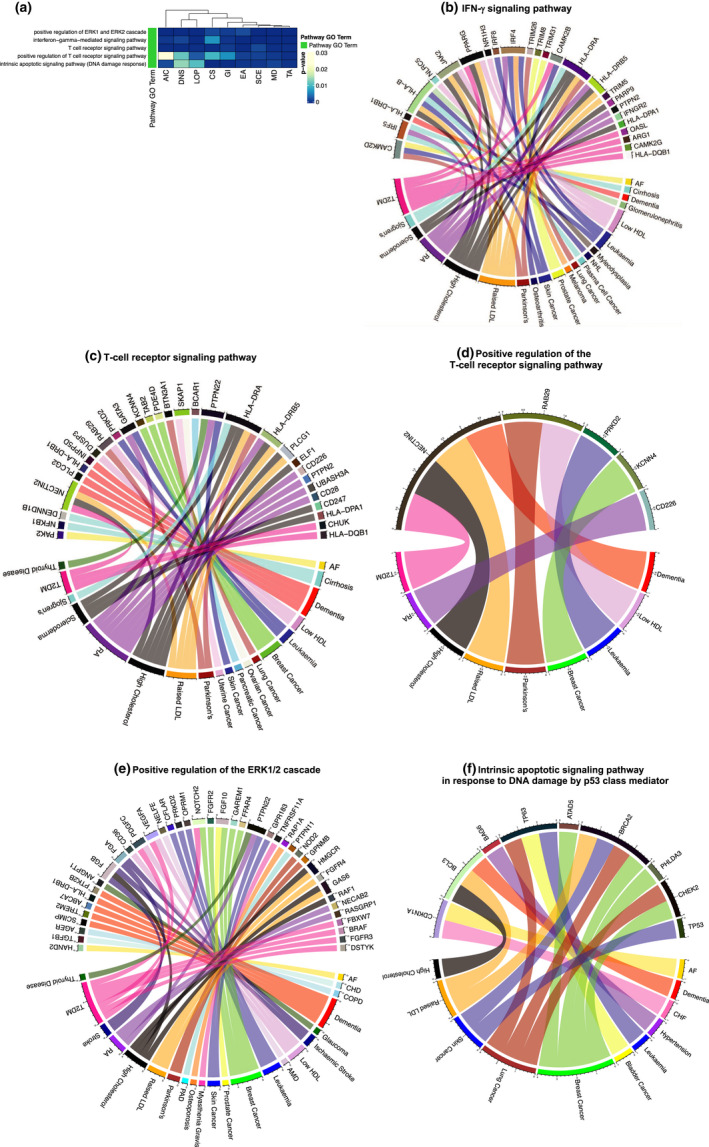
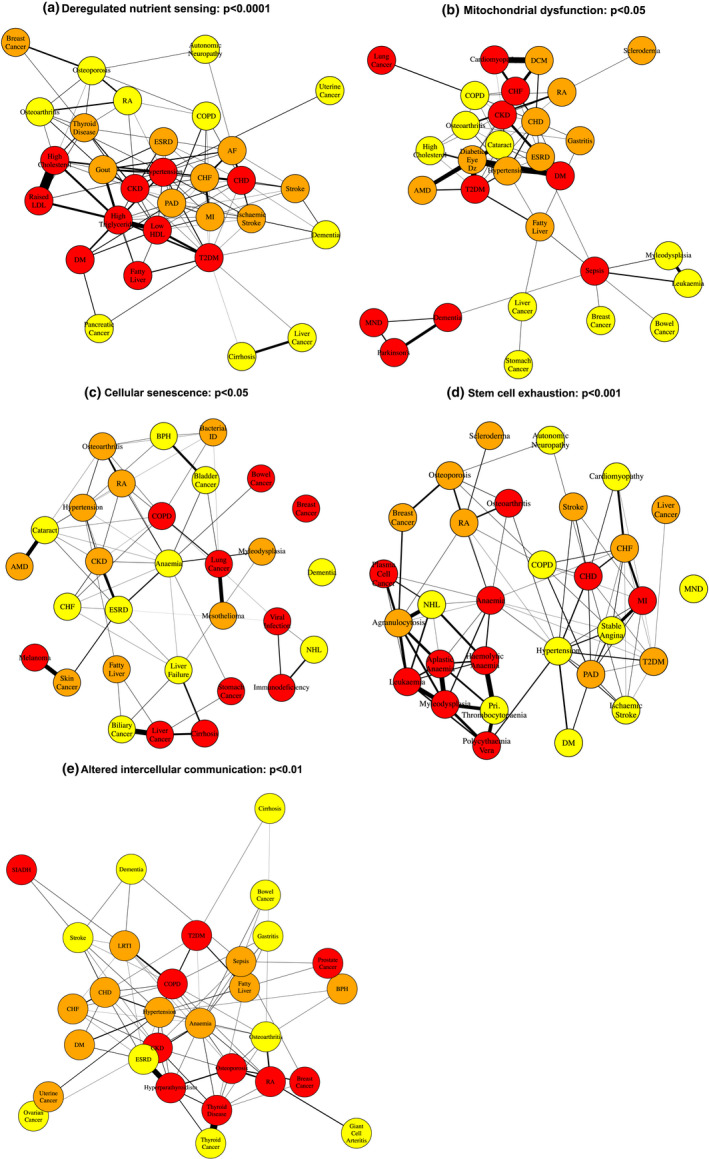
Genetic, environmental, and pharmacological interventions into the aging process can confer resistance to multiple age‐related diseases in laboratory animals, including rhesus monkeys. These findings imply that individual mechanisms of aging might contribute to the co‐occurrence of age‐related diseases in humans and could be targeted to prevent these conditions simultaneously. To address this question, we text mined 917,645 literature abstracts followed by manual curation and found strong, non‐random associations between age‐related diseases and aging mechanisms in humans, confirmed by gene set enrichment analysis of GWAS data. Integration of these associations with clinical data from 3.01 million patients showed that age‐related diseases associated with each of five aging mechanisms were more likely than chance to be present together in patients. Genetic evidence revealed that innate and adaptive immunity, the intrinsic apoptotic signaling pathway and activity of the ERK1/2 pathway were associated with multiple aging mechanisms and diverse age‐related diseases. Mechanisms of aging hence contribute both together and individually to age‐related disease co‐occurrence in humans and could potentially be targeted accordingly to prevent multimorbidity.
Overview
The claims and statistics of this paper haven’t been checked yet.
Run the check — free, no account needed. It reads the open-access text and checks the sources it cites.
Integrity signals
Registry
Cites
Statistics
Figures
Verification
Claims the paper makes
The claims and statistics of this paper haven’t been checked yet.
Run the check — free, no account needed. It reads the open-access text and checks the sources it cites.
Claims other papers make about this one
Each is checked against this paper’s own text: does it say what the citing paper says it does?
The source backs part of the claim, not all of it — or backs it for a different population, condition or comparison.
In the citing paper
“Of note, human age-related diseases have statistically higher chances to co-occur and to share genomic characteristics when they are causally linked to the same hallmark rather than to different hallmarks 2 , clinically validating the approach that we have chosen.”
From Hallmarks of aging: An expanding universe (2023) · cites this paper as [2]
Experimental — accuracy not yet measured
Self-check
Percentages, sums and reported differences re-computed from the paper’s own numbers.
The self-check needs the paper’s full text.
Citations
Cites
López-Otín, C., Blasco, M. A., Partridge, L., Serrano, M., & Kroemer, G. (2013) · Cell · doi:10.1016/j.cell.2013.05.039 · Cited by 14,982
Self-citationAgeing as a risk factor for neurodegenerative disease
Hou, Y., Dan, X., Babbar, M., Wei, Y., Hasselbalch, S. G., Croteau, D. L., & Bohr, V. A. (2019) · Nature Reviews Neurology · doi:10.1038/s41582-019-0244-7 · Cited by 3,310
Senolytics improve physical function and increase lifespan in old age
Xu, M., Pirtskhalava, T., Farr, J. N., Weigand, B. M., Palmer, A. K., Weivoda, M. M., Inman, C. L., Ogrodnik, M. B., Hachfeld, C. M., Fraser, D. G., et al. (2018) · Nature Medicine · doi:10.1038/s41591-018-0092-9 · Cited by 2,287
Ageing as a Risk Factor for Disease
Niccoli, T., & Partridge, L. (2012) · Current Biology · doi:10.1016/j.cub.2012.07.024 · Cited by 1,831
Self-citationThe Continuum of Aging and Age-Related Diseases: Common Mechanisms but Different Rates
Franceschi, C., Garagnani, P., Morsiani, C., Conte, M., Santoro, A., Grignolio, A., Monti, D., Capri, M., & Salvioli, S. (2018) · Frontiers in Medicine · doi:10.3389/fmed.2018.00061 · Cited by 945
Mitochondrial Dysfunction in Neurodegenerative Diseases
Johri, A., & Beal, M. F. (2012) · The Journal of Pharmacology and Experimental Therapeutics · doi:10.1124/jpet.112.192138 · Cited by 806
mTOR inhibition improves immune function in the elderly
Mannick, J. B., Del Giudice, G., Lattanzi, M., Valiante, N. M., Praestgaard, J., Huang, B., Lonetto, M. A., Maecker, H. T., Kovarik, J., Carson, S., et al. (2014) · Science Translational Medicine · doi:10.1126/scitranslmed.3009892 · Cited by 786
Goette, A., Staack, T., Röcken, C., Arndt, M., Geller, J. C., Huth, C., Ansorge, S., Klein, H. U., & Lendeckel, U. (2000) · Journal of the American College of Cardiology · doi:10.1016/s0735-1097(00)00611-2 · Cited by 583
Delayed ageing through damage protection by the Arf/p53 pathway
Matheu, A., Maraver, A., Klatt, P., Flores, I., Garcia-Cao, I., Borras, C., Flores, J. M., Viña, J., Blasco, M. A., & Serrano, M. (2007) · Nature · doi:10.1038/nature05949 · Cited by 466
Tanti, J.-F., & Jager, J. (2009) · Current Opinion in Pharmacology · doi:10.1016/j.coph.2009.07.004 · Cited by 430
Research works printed but not linked: 54
- 10.1093/bioinformatics/btl140 · DOI
- 10.1038/s41598-018-34361-3 · DOI
- 10.18632/aging.102166 · DOI
- 10.1002/bjs.10053 · DOI
- 10.1016/j.copbio.2020.11.008 · DOI
- 10.1093/bioinformatics/btx454 · DOI
- 10.1111/j.2517-6161.1995.tb02031.x · DOI · Paper page
- 10.1093/nar/gkh061 · DOI · Paper page
- 10.1093/nar/gku1055 · DOI
- 10.1093/nar/gky1120 · DOI · Paper page
- 10.1073/pnas.1913212116 · DOI
- 10.1016/j.celrep.2016.09.005 · DOI
- Chokkalingam M., 2021, Parameterizing network propagation algorithms for omics data integration (in prep.)
- 10.1093/bioinformatics/btp163 · DOI · Paper page
- 10.1038/nrg.2017.38 · DOI
- 10.1093/nar/gky868 · DOI
- 10.1038/nrcardio.2013.30 · DOI
- 10.1093/bioinformatics/btv301 · DOI
- 10.1016/j.cell.2011.02.013 · DOI · Paper page
- 10.1038/nrg1768 · DOI
- 10.1111/acel.12362 · DOI · Paper page
- 10.1111/j.1399-0004.2011.01809.x · DOI
- 10.3906/sag-1901-151 · DOI
- 10.1038/nature08980 · DOI · Paper page
- 10.1038/s41574-020-0335-y · DOI · Paper page
- 10.1177/1756283X11430859 · DOI
- 10.1038/modpathol.2012.51 · DOI
- Kuan V., 2020, Exploring the relationship between age and health conditions using electronic health records: From single diseases to multimorbidities
- 10.1016/S2589-7500(19)30012-3 · DOI · Paper page
- 10.1038/s41598-021-82459-y · DOI
- 10.1073/pnas.0810772105 · DOI · Paper page
- 10.1016/j.mcna.2007.06.012 · DOI
- 10.1007/s11910-014-0450-z · DOI
- 10.1159/000163946 · DOI
- 10.1161/CIRCRESAHA.110.218966 · DOI
- 10.1016/j.canlet.2009.01.022 · DOI
- 10.18632/aging.100314 · DOI
- 10.1093/nar/gkw1071 · DOI · Paper page
- 10.2331/suisan.22.526 · DOI
- 10.1358/dnp.2008.21.5.1219006 · DOI
- 10.1038/s41573-020-0067-7 · DOI · Paper page
- 10.1016/S2468-2667(19)30222-1 · DOI
- 10.1136/jnnp.45.7.652 · DOI
- 10.1016/j.ymeth.2014.11.020 · DOI · Paper page
- 10.1186/1752-0509-8-S1-S6 · DOI
- 10.2147/JEP.S28907 · DOI
- 10.1016/j.cell.2015.06.023 · DOI · Paper page
- 10.1152/ajpcell.00168.2010 · DOI · Paper page
- 10.3892/ijmm.2017.2962 · DOI
- 10.1093/nar/gky1131 · DOI · Paper page
- 10.1073/pnas.1419581111 · DOI
- 10.1038/s41598-019-52035-6 · DOI
- 10.1007/BF02253251 · DOI
- 10.1007/s00415-019-09282-4 · DOI
Cited by
Sorted by citations
Hallmarks of aging: An expanding universe
López-Otín, C., Blasco, M. A., Partridge, L., Serrano, M., & Kroemer, G. (2023) · Cell · doi:10.1016/j.cell.2022.11.001 · Cited by 6,549
Self-citationNew hallmarks of ageing: a 2022 Copenhagen ageing meeting summary
Schmauck-Medina, T., Molière, A., Lautrup, S., Zhang, J., Chlopicki, S., Madsen, H. B., Cao, S., Soendenbroe, C., Mansell, E., Vestergaard, M. B., et al. (2022) · Aging · doi:10.18632/aging.204248 · Cited by 319
Metadata
- Authors
- Fraser, H. C., Kuan, V., Johnen, R., Zwierzyna, M., Hingorani, A. D., Beyer, A., & Partridge, L.
- Affiliations
- Department of Genetics, Evolution and Environment Institute of Healthy Ageing University College London London UK
- Institute of Health Informatics University College London London UK
- Cologne Excellence Cluster on Cellular Stress Responses in Aging‐Associated Diseases (CECAD) Medical Faculty & Faculty of Mathematics and Natural Sciences University of Cologne Cologne Germany
- Institute of Cardiovascular Science University College London UK
- Health Data Research UK London University College London London UK
- Venue
- Aging Cell
- Publisher
- Wiley
- Published
- 2022-03-08
- Volume
- 21
- Issue
- 4
- ISSN
- 1474-9718
- 1474-9726
- PMC
- PMC9009120
- Cited by
- 90
- References
- 17
- Language
- en
- Funders
- Bundesministerium für Bildung und Forschung (HiGHmed 01ZZ1802U)
- Dunhill Medical Trust (RPGF1806/67)
- Max-Planck-Gesellschaft
- Wellcome Trust (WT 110284/Z/15/Z)
- Deutsche Forschungsgemeinschaft (CRC1310, 325931972)
- British Heart Foundation (AA/18/6/34223)
About these checks
Registry, retraction, Cites and statistics results are computed, not judged, with one exception: a printed reference that no index lists is read once by a model before it counts as a citation error. Claims are extracted by a model and kept only when their quote appears verbatim in the text; each cited source is then checked, with a model’s help, for whether it says what the claim relies on. Those verdicts can be wrong — read the claim’s quote and the cited source before relying on one.
Statistics and arithmetic are recomputed, not judged.
Confidence bands are shown only for fields calibrated on our annotated test set. None is calibrated yet, so no band is shown.
What counts as a claim ›How we measure confidence ›How we check this ›
Are you an author, or do you see a problem with this page? Request a review
