

Engineering two-photon high-dimensional states through quantum interference
Open accessThe DOI matches its Crossref record; 45 of the 46 references it cites were found in a registry or an index.
Abstract
A simple approach to preparing high-dimensional entangled states by quantum interference.
Overview
The claims and statistics of this paper haven’t been checked yet.
Free: it reads the open-access text and checks the first 5 claims that cite a source we can check. Create a free account to check every claim.
Integrity signals
Registry
Cites
Statistics
Figures
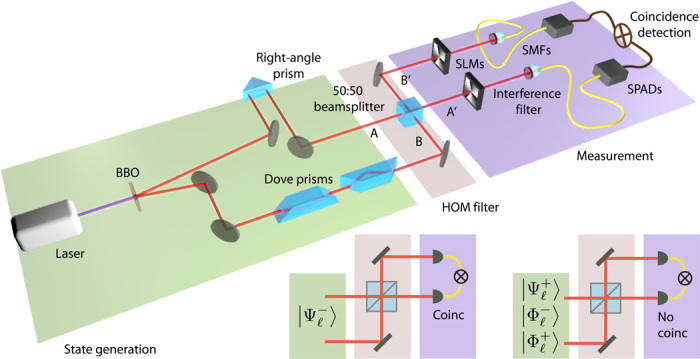
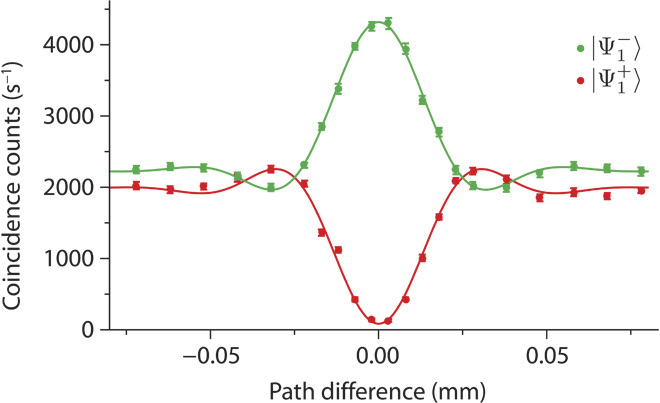
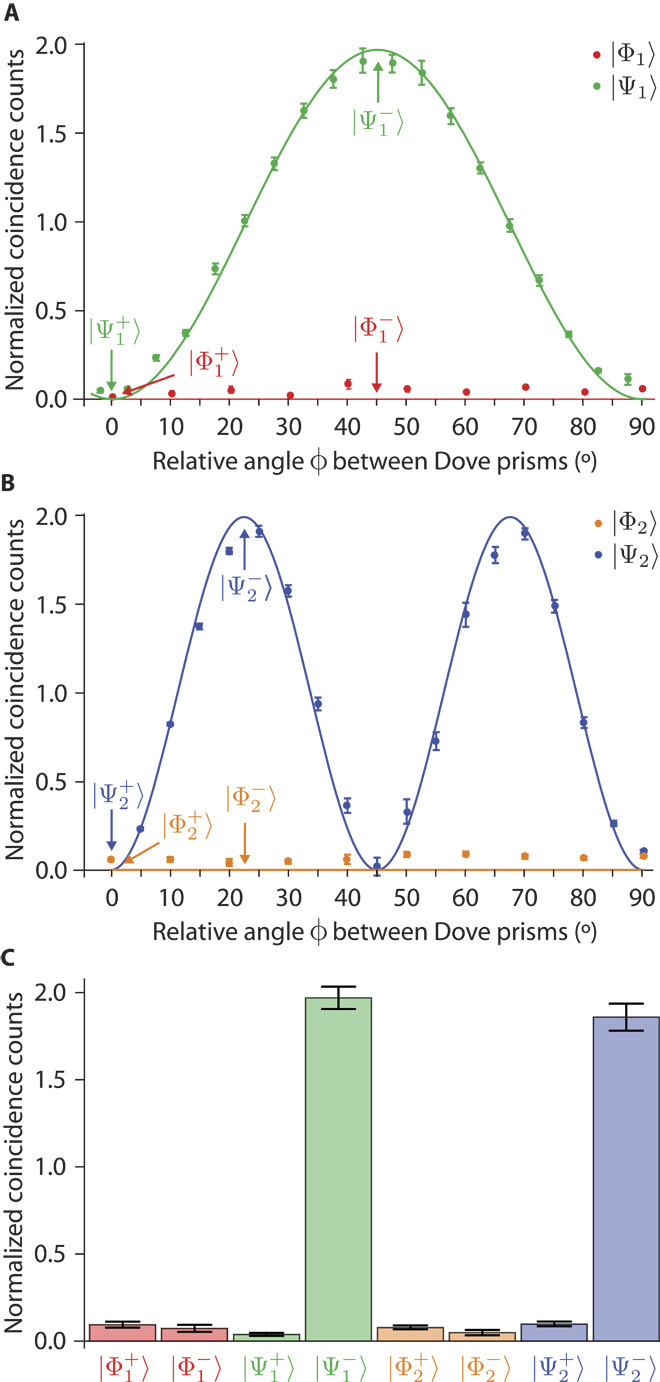
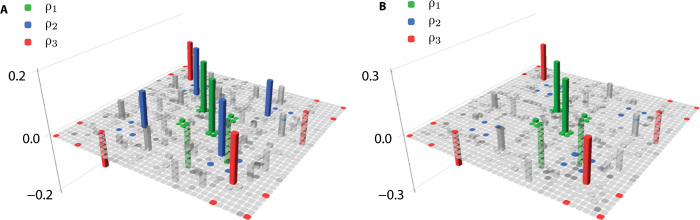
Verification
Claims the paper makes
The claims and statistics of this paper haven’t been checked yet.
Free: it reads the open-access text and checks the first 5 claims that cite a source we can check. Create a free account to check every claim.
Claims other papers make about this one
Each is checked against this paper’s own text: does it say what the citing paper says it does?
The cited source doesn’t support the claim as written.
In the citing paper
“They have also been experimentally realized with fused optical fibers [138] and more recently with passive [141] and active integrated waveguide circuits [142].”
From Two-photon interference: the Hong–Ou–Mandel effect (2021) · cites this paper as [138]
Checked by a reasoning model — may be wrong.
Experimental — accuracy not yet measuredThe source backs part of the claim, not all of it — or backs it for a different population, condition or comparison.
In the citing paper
“Although tritters have been used to demonstrate quantum features in the two-photon regime [138,142,143], only recently have three photon HOM coalescences been observed [141,144].”
From Two-photon interference: the Hong–Ou–Mandel effect (2021) · cites this paper as [138]
Experimental — accuracy not yet measuredThe cited source says what the claim attributes to it.
In the citing paper
“Seminal contributions to quantum tools include quantum channel analysis, [26][27][28] high-dimensional state engineering, 29 and measurement of high-dimensional states.[30][31][32]”
From Toward a quantum future for South Africa (2021) · cites this paper as [29]
Self-check
Percentages, sums and reported differences re-computed from the paper’s own numbers.
The self-check needs the paper’s full text.
Citations
Cites
Experimental quantum teleportation
Bouwmeester, D., Pan, J.-W., Mattle, K., Eibl, M., Weinfurter, H., & Zeilinger, A. (1997) · Nature · doi:10.1038/37539 · Cited by 5,545
Measurement of subpicosecond time intervals between two photons by interference
Hong, C. K., Ou, Z. Y., & Mandel, L. (1987) · Physical Review Letters · doi:10.1103/physrevlett.59.2044 · Cited by 4,369
Quantum Repeaters: The Role of Imperfect Local Operations in Quantum Communication
Briegel, H.-J., Dür, W., Cirac, J. I., & Zoller, P. (1998) · Physical Review Letters · doi:10.1103/physrevlett.81.5932 · Cited by 3,481 · cited 1×
“Highcapacity teleportation channels are an essential ingredient to enable longdistance quantum communication by means of quantum repeaters (19).”
BackgroundEntanglement of the orbital angular momentum states of photons
Mair, A., Vaziri, A., Weihs, G., & Zeilinger, A. (2001) · Nature · doi:10.1038/35085529 · Cited by 3,321
Linear optical quantum computing with photonic qubits
Kok, P., Munro, W. J., Nemoto, K., Ralph, T. C., Dowling, J. P., & Milburn, G. J. (2007) · Reviews of Modern Physics · doi:10.1103/revmodphys.79.135 · Cited by 2,904
Security of Quantum Key Distribution Usingd-Level Systems
Cerf, N. J., Bourennane, M., Karlsson, A., & Gisin, N. (2002) · Physical Review Letters · doi:10.1103/physrevlett.88.127902 · Cited by 1,354
Molina-Terriza, G., Torres, J. P., & Torner, L. (2007) · Nature Physics · doi:10.1038/nphys607 · Cited by 1,331
Advances in optical angular momentum
Franke‐Arnold, S., Allen, L., & Padgett, M. (2008) · Laser & Photonics Reviews · doi:10.1002/lpor.200810007 · Cited by 924
Busch, P., Grabowski, M., & Lahti, P. J. (1995) · Lecture Notes in Physics Monographs · doi:10.1007/978-3-540-49239-9 · Cited by 784
Quantum teleportation of multiple degrees of freedom of a single photon
Wang, X.-L., Cai, X.-D., Su, Z.-E., Chen, M.-C., Wu, D., Li, L., Liu, N.-L., Lu, C.-Y., & Pan, J.-W. (2015) · Nature · doi:10.1038/nature14246 · Cited by 761
Generation of Hyperentangled Photon Pairs
Barreiro, J. T., Langford, N. K., Peters, N. A., & Kwiat, P. G. (2005) · Physical Review Letters · doi:10.1103/physrevlett.95.260501 · Cited by 750
Quantum Cryptography with 3-State Systems
Bechmann-Pasquinucci, H., & Peres, A. (2000) · Physical Review Letters · doi:10.1103/physrevlett.85.3313 · Cited by 556
Optimal Eavesdropping in Cryptography with Three-Dimensional Quantum States
Bruß, D., & Macchiavello, C. (2002) · Physical Review Letters · doi:10.1103/physrevlett.88.127901 · Cited by 438
Quantum Information Transfer from Spin to Orbital Angular Momentum of Photons
Nagali, E., Sciarrino, F., De Martini, F., Marrucci, L., Piccirillo, B., Karimi, E., & Santamato, E. (2009) · Physical Review Letters · doi:10.1103/physrevlett.103.013601 · Cited by 411
Mafu, M., Dudley, A., Goyal, S., Giovannini, D., McLaren, M., Padgett, M. J., Konrad, T., Petruccione, F., Lütkenhaus, N., & Forbes, A. (2013) · Physical Review A · doi:10.1103/physreva.88.032305 · Cited by 349
Self-citationObservation of a ‘‘quantum eraser’’: A revival of coherence in a two-photon interference experiment
Kwiat, P. G., Steinberg, A. M., & Chiao, R. Y. (1992) · Physical Review A · doi:10.1103/physreva.45.7729 · Cited by 297
Kwiat, P. G., & Weinfurter, H. (1998) · Physical Review A · doi:10.1103/physreva.58.r2623 · Cited by 287
Introduction to Optical Quantum Information Processing
Kok, P., & Lovett, B. W. (2010) · doi:10.1017/cbo9781139193658 · Cited by 273
Can Two-Photon Interference be Considered the Interference of Two Photons?
Pittman, T. B., Strekalov, D. V., Migdall, A., Rubin, M. H., Sergienko, A. V., & Shih, Y. H. (1996) · Physical Review Letters · doi:10.1103/physrevlett.77.1917 · Cited by 228 · cited 1×
“HOM interference was investigated for various scenarios, for example, in polarization (24), in path length (25), in the radial dependence of the light field in a transversal plane (26), in spectral filtering (27), for different single-photon sources (28), and with spatial modes (23, 29–31).”
BackgroundBell-Type Test of Energy-Time Entangled Qutrits
Thew, R. T., Acín, A., Zbinden, H., & Gisin, N. (2004) · Physical Review Letters · doi:10.1103/physrevlett.93.010503 · Cited by 219
Optimal quantum cloning of orbital angular momentum photon qubits through Hong–Ou–Mandel coalescence
Nagali, E., Sansoni, L., Sciarrino, F., De Martini, F., Marrucci, L., Piccirillo, B., Karimi, E., & Santamato, E. (2009) · Nature Photonics · doi:10.1038/nphoton.2009.214 · Cited by 218
Experimental interference of independent photons
Kaltenbaek, R., Blauensteiner, B., Żukowski, M., Aspelmeyer, M., & Zeilinger, A. (2006) · Physical Review Letters · doi:10.1103/physrevlett.96.240502 · Cited by 192
Pixel Entanglement: Experimental Realization of Optically Entangledd=3andd=6Qudits
O’Sullivan-Hale, M. N., Ali Khan, I., Boyd, R. W., & Howell, J. C. (2005) · Physical Review Letters · doi:10.1103/physrevlett.94.220501 · Cited by 190
Multimode Hong-Ou-Mandel Interference
Walborn, S. P., de Oliveira, A. N., Pádua, S., & Monken, C. H. (2003) · Physical Review Letters · doi:10.1103/physrevlett.90.143601 · Cited by 170
Tomography of the quantum state of photons entangled in high dimensions
Agnew, M., Leach, J., McLaren, M., Roux, F. S., & Boyd, R. W. (2011) · Physical Review A · doi:10.1103/physreva.84.062101 · Cited by 161
Self-citationPhase shaping of single-photon wave packets
Specht, H., Bochmann, J., Mucke, M., Weber, B., Figueroa, E. V., Moehring, D. L., & Rempe, G. (2009) · Nature Photonics · doi:10.1038/nphoton.2009.115 · Cited by 150
Superdense teleportation using hyperentangled photons
Graham, T. M., Bernstein, H. J., Wei, T.-C., Junge, M., & Kwiat, P. G. (2015) · Nature Communications · doi:10.1038/ncomms8185 · Cited by 142
Measurement of the Spiral Spectrum of Entangled Two-Photon States
Di Lorenzo Pires, H., Florijn, H. C. B., & van Exter, M. P. (2010) · Physical Review Letters · doi:10.1103/physrevlett.104.020505 · Cited by 128
Entangled Bessel-Gaussian beams
McLaren, M., Agnew, M., Leach, J., Roux, F. S., Padgett, M. J., Boyd, R. W., & Forbes, A. (2012) · Optics Express · doi:10.1364/oe.20.023589 · Cited by 126
Self-citationKarimi, E., Giovannini, D., Bolduc, E., Bent, N., Miatto, F. M., Padgett, M. J., & Boyd, R. W. (2014) · Physical Review A · doi:10.1103/physreva.89.013829 · Cited by 99
Ricci, M., Sciarrino, F., Sias, C., & De Martini, F. (2004) · Physical Review Letters · doi:10.1103/physrevlett.92.047901 · Cited by 90
Entangled singularity patterns of photons in Ince-Gauss modes
Krenn, M., Fickler, R., Huber, M., Łapkiewicz, R., Plick, W. N., Ramelow, S., & Zeilinger, A. (2013) · Physical Review A · doi:10.1103/physreva.87.012326 · Cited by 89
Optimal Quantum Cloning on a Beam Splitter
Irvine, W. T. M., Linares, A. L., de Dood, M. J. A., & Bouwmeester, D. (2004) · Physical Review Letters · doi:10.1103/physrevlett.92.047902 · Cited by 89
Experimental optimal cloning of four-dimensional quantum states of photons
Nagali, E., Giovannini, D., Marrucci, L., Slussarenko, S., Santamato, E., & Sciarrino, F. (2010) · Physical Review Letters · doi:10.1103/physrevlett.105.073602 · Cited by 85
Anti-symmetrization reveals hidden entanglement
Fedrizzi, A., Herbst, T., Aspelmeyer, M., Barbieri, M., Jennewein, T., & Zeilinger, A. (2009) · New Journal of Physics · doi:10.1088/1367-2630/11/10/103052 · Cited by 81
Proposal for demonstrating the Hong–Ou–Mandel effect with matter waves
Lewis-Swan, R. J., & Kheruntsyan, K. V. (2014) · Nature Communications · doi:10.1038/ncomms4752 · Cited by 60
Qudit-Teleportation for photons with linear optics
Goyal, S. K., Boukama-Dzoussi, P. E., Ghosh, S., Roux, F. S., & Konrad, T. (2014) · Scientific Reports · doi:10.1038/srep04543 · Cited by 50
Self-citationOrbital angular momentum analysis of high-dimensional entanglement
Peeters, W. H., Verstegen, E. J. K., & van Exter, M. P. (2007) · Physical Review A · doi:10.1103/physreva.76.042302 · Cited by 38
Orbital angular momentum correlations with a phase-flipped Gaussian mode pump beam
Romero, J., Giovannini, D., McLaren, M. G., Galvez, E. J., Forbes, A., & Padgett, M. J. (2012) · Journal of Optics · doi:10.1088/2040-8978/14/8/085401 · Cited by 30
Self-citationTeleporting photonic qudits using multimode quantum scissors
Goyal, S. K., & Konrad, T. (2013) · Scientific Reports · doi:10.1038/srep03548 · Cited by 28
Self-citationAgnew, M., Salvail, J. Z., Leach, J., & Boyd, R. W. (2013) · Physical Review Letters · doi:10.1103/physrevlett.111.030402 · Cited by 27
Self-citationMulti-Photon Quantum Interference
Ou, Z.-Y. J. (2007) · doi:10.1007/978-0-387-25554-5 · Cited by 24
Distribution and severity of bacterial brown spot on dry beans in South Africa: An update
Muedi, H. T. H., Fourie, D., & McLaren, N. W. (2015) · South African Journal of Science · doi:10.17159/sajs.2015/20140015 · Cited by 14
Realising high-dimensional quantum entanglement with orbital angular momentu
McLaren, M. G., Roux, F. S., & Forbes, A. (2015) · South African Journal of Science · doi:10.17159/sajs.2015/20130322 · Cited by 11
Self-citationInterference of probability amplitudes: a simple demonstration within the Hong–Ou–Mandel experiment
Giovannini, D., Romero, J., & Padgett, M. J. (2014) · Journal of Optics · doi:10.1088/2040-8978/16/3/032002 · Cited by 4
Cited by
Optical vortices 30 years on: OAM manipulation from topological charge to multiple singularities
Shen, Y., Wang, X., Xie, Z., Min, C., Fu, X., Liu, Q., Gong, M., & Yuan, X. (2019) · Light: Science & Applications · doi:10.1038/s41377-019-0194-2 · Cited by 2,219
On-chip generation of high-dimensional entangled quantum states and their coherent control
Kues, M., Reimer, C., Roztocki, P., Cortés, L. R., Sciara, S., Wetzel, B., Zhang, Y., Cino, A., Chu, S. T., Little, B. E., et al. (2017) · Nature · doi:10.1038/nature22986 · Cited by 1,177
Self-citationTwisted photons: new quantum perspectives in high dimensions
Erhard, M., Fickler, R., Krenn, M., & Zeilinger, A. (2017) · Light: Science & Applications · doi:10.1038/lsa.2017.146 · Cited by 610
Towards higher-dimensional structured light
He, C., Shen, Y., & Forbes, A. (2022) · Light: Science & Applications · doi:10.1038/s41377-022-00897-3 · Cited by 617
Self-citationHigh‐Dimensional Quantum Communication: Benefits, Progress, and Future Challenges
Cozzolino, D., Da Lio, B., Bacco, D., & Oxenløwe, L. K. (2019) · Advanced Quantum Technologies · doi:10.1002/qute.201900038 · Cited by 470
Metadata
- Authors
- Zhang, Y., Roux, F. S., Konrad, T., Agnew, M., Leach, J., & Forbes, A.
- Affiliations
- Council for Scientific and Industrial Research (ZA)
- University of the Witwatersrand (ZA)
- National Institute for Theoretical Physics (ZA)
- Heriot-Watt University (GB)
- Corresponding author
- Forbes, Andrew
- Venue
- Science Advances
- Published
- 2016-02-05
- Volume
- 2
- Issue
- 2
- Pages
- e1501165-e1501165
- ISSN
- 2375-2548 (ISSN-L)
- PMC
- PMC4771439
- OpenAlex
- W2304537197
- Cited by
- 149
- References
- 46
- Citations by year
- 2026: 5 · 2025: 14 · 2024: 20 · 2023: 12 · 2022: 15 · 2021: 18 · 2020: 12 · 2019: 22 · 2018: 14 · 2017: 15 · 2016: 2
- FWCI
- 14.55
- Type
- journal article
- Language
- en
- Open access
- gold
- doi.org
- Locations
- Science Advances (publishedVersion)
- PubMed Central (publishedVersion, cc-by-nc)
- PubMed (publishedVersion)
- Funders
- Engineering and Physical Sciences Research Council (1786148)
- Topics
- Physical Sciences › Physics and Astronomy › Atomic and Molecular Physics, and Optics › Quantum Information and Cryptography
- Physical Sciences › Physics and Astronomy › Atomic and Molecular Physics, and Optics › Orbital Angular Momentum in Optics
- Physical Sciences › Physics and Astronomy › Atomic and Molecular Physics, and Optics › Quantum Mechanics and Applications
- Keywords
- high-dimensional entanglement, orbital angular momentum, two-photon states, Hong-Ou-Mandel interference, quantum state engineering, linear optical quantum computing
About these checks
Registry, retraction, Cites and statistics results are computed, not judged, with one exception: a printed reference that no index lists is read once by a model before it counts as a citation error. Claims are extracted by a model and kept only when their quote appears verbatim in the text; each cited source is then checked, with a model’s help, for whether it says what the claim relies on. Those verdicts can be wrong — read the claim’s quote and the cited source before relying on one.
Statistics and arithmetic are recomputed, not judged.
Confidence bands are shown only for fields calibrated on our annotated test set. None is calibrated yet, so no band is shown.
What counts as a claim ›How we measure confidence ›How we check this ›
Are you an author, or do you see a problem with this page? Request a review
Data sources
Bibliographic data: Semantic Scholar, OpenAlex, Crossref.
Contains information from the Semantic Scholar Academic Graph Datasets, made available under the ODC Attribution License (ODC-BY 1.0).
Semantic Scholar’s data is described in: Kinney, R., et al. (2023). The Semantic Scholar Open Data Platform. arXiv:2301.10140.
