

Multiplexed single-cell RNA-seq via transient barcoding for simultaneous expression profiling of various drug perturbations
Open accessPublished version of a preprint
The DOI matches its Crossref record; 27 of the 27 references it cites were found in a registry or an index.
Abstract
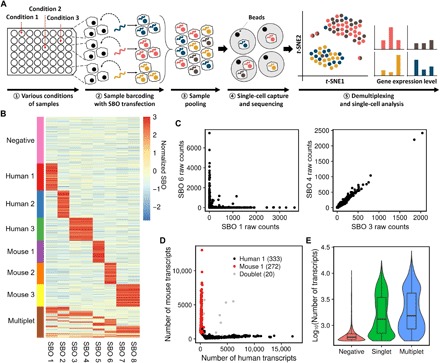
The authors developed a method for analyzing single cells under various conditions by tagging cells with small fragments of DNA.
Overview
The claims and statistics of this paper haven’t been checked yet.
Free: it reads the open-access text and checks the first 5 claims that cite a source we can check. Create a free account to check every claim.
Integrity signals
Registry
Cites
Statistics
Figures
Verification
Claims the paper makes
The claims and statistics of this paper haven’t been checked yet.
Free: it reads the open-access text and checks the first 5 claims that cite a source we can check. Create a free account to check every claim.
Claims other papers make about this one
Each is checked against this paper’s own text: does it say what the citing paper says it does?
The source backs part of the claim, not all of it — or backs it for a different population, condition or comparison.
In the citing paper
“Sample multiplexed scRNA-seq is another solution, establishing an efficient method for massively parallel species-mixing experiments [18–22].”
From Single-cell sequencing to multi-omics: technologies and applications (2024) · cites this paper as [20]
Experimental — accuracy not yet measured
Self-check
Percentages, sums and reported differences re-computed from the paper’s own numbers.
The self-check needs the paper’s full text.
Citations
Cites
Mutations of the BRAF gene in human cancer
Davies, H., Bignell, G. R., Cox, C., Stephens, P., Edkins, S., Clegg, S., Teague, J., Woffendin, H., Garnett, M. J., Bottomley, W., et al. (2002) · Nature · doi:10.1038/nature00766 · Cited by 10,674
Massively parallel digital transcriptional profiling of single cells
Zheng, G. X. Y., Terry, J. M., Belgrader, P., Ryvkin, P., Bent, Z. W., Wilson, R., Ziraldo, S. B., Wheeler, T. D., McDermott, G. P., Zhu, J., et al. (2017) · Nature Communications · doi:10.1038/ncomms14049 · Cited by 7,353
Trapnell, C., Cacchiarelli, D., Grimsby, J., Pokharel, P., Li, S., Morse, M., Lennon, N. J., Livak, K. J., Mikkelsen, T. S., & Rinn, J. L. (2014) · Nature Biotechnology · doi:10.1038/nbt.2859 · Cited by 7,314 · cited 1×
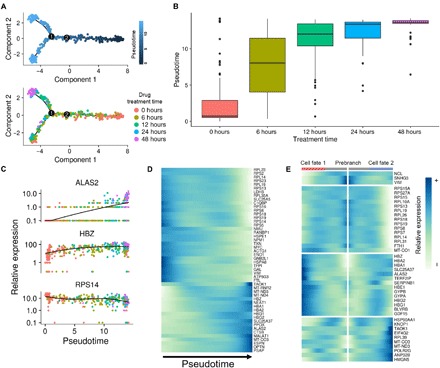
“For pseudotime analysis of 5-plex time-course experiment, we applied the R package “ Monocle 2 ” ( 23 ).”
Highly parallel genome-wide expression profiling of individual cells using nanoliter droplets.
Macosko, E. Z., Basu, A., Satija, R., Nemesh, J., Shekhar, K., Goldman, M., Tirosh, I., Bialas, A. R., Kamitaki, N., Martersteck, E. M., et al. (2015) · Cell · doi:10.1016/j.cell.2015.05.002 · Cited by 7,110
Spatial reconstruction of single-cell gene expression data
Satija, R., Farrell, J. A., Gennert, D., Schier, A. F., & Regev, A. (2015) · Nature Biotechnology · doi:10.1038/nbt.3192 · Cited by 7,055
Lamb, J., Crawford, E. D., Peck, D., Modell, J. W., Blat, I. C., Wrobel, M. J., Lerner, J., Brunet, J.-P., Subramanian, A., Ross, K. N., et al. (2006) · Science · doi:10.1126/science.1132939 · Cited by 5,257
Dissecting the multicellular ecosystem of metastatic melanoma by single-cell RNA-seq
Tirosh, I., Izar, B., Prakadan, S. M., Wadsworth, M. H., Treacy, D., Trombetta, J. J., Rotem, A., Rodman, C., Lian, C., Murphy, G., et al. (2016) · Science · doi:10.1126/science.aad0501 · Cited by 4,944
A Next Generation Connectivity Map: L1000 Platform and the First 1,000,000 Profiles
Subramanian, A., Narayan, R., Corsello, S. M., Peck, D. D., Natoli, T. E., Lu, X., Gould, J., Davis, J. F., Tubelli, A. A., Asiedu, J. K., et al. (2017) · Cell · doi:10.1016/j.cell.2017.10.049 · Cited by 3,515
Droplet barcoding for single-cell transcriptomics applied to embryonic stem cells
Klein, A. M., Mazutis, L., Akartuna, I., Tallapragada, N., Veres, A., Li, V., Peshkin, L., Weitz, D. A., & Kirschner, M. W. (2015) · Cell · doi:10.1016/j.cell.2015.04.044 · Cited by 3,356
Functional Discovery via a Compendium of Expression Profiles
Hughes, T. R., Marton, M. J., Jones, A. R., Roberts, C. J., Stoughton, R., Armour, C. D., Bennett, H. A., Coffey, E., Dai, H., He, Y. D., et al. (2000) · Cell · doi:10.1016/s0092-8674(00)00015-5 · Cited by 2,533
Research works printed but not linked: 1
- Q. Mao, L. Wang, S. Goodison, Y. Sun, paper presented at the Proceedings of the 21th ACM SIGKDD International Conference on Knowledge Discovery and Data Mining, Sydney, NSW, Australia, 10 to 13 August 2015.
Cited by
McGinnis, C. S., Murrow, L. M., & Gartner, Z. J. (2019) · Cell Systems · doi:10.1016/j.cels.2019.03.003 · Cited by 4,521
Stoeckius, M., Zheng, S., Houck-Loomis, B., Hao, S., Yeung, B. Z., Mauck, W. M., Smibert, P., & Satija, R. (2018) · Genome Biology · doi:10.1186/s13059-018-1603-1 · Cited by 1,046
MULTI-seq: sample multiplexing for single-cell RNA sequencing using lipid-tagged indices
McGinnis, C. S., Patterson, D. M., Winkler, J., Conrad, D. N., Hein, M. Y., Srivastava, V., Hu, J. L., Murrow, L. M., Weissman, J. S., Werb, Z., et al. (2019) · Nature Methods · doi:10.1038/s41592-019-0433-8 · Cited by 643
Mimitou, E. P., Lareau, C. A., Chen, K. Y., Zorzetto-Fernandes, A. L., Hao, Y., Takeshima, Y., Luo, W., Huang, T.-S., Yeung, B. Z., Papalexi, E., et al. (2021) · Nature Biotechnology · doi:10.1038/s41587-021-00927-2 · Cited by 529
Applications of single-cell RNA sequencing in drug discovery and development
Van de Sande, B., Lee, J. S., Mutasa-Gottgens, E., Naughton, B., Bacon, W., Manning, J., Wang, Y., Pollard, J., Mendez, M., Hill, J., et al. (2023) · Nature Reviews Drug Discovery · doi:10.1038/s41573-023-00688-4 · Cited by 437
Self-citation
Metadata
- Authors
- Shin, D., Lee, W., Lee, J. H., & Bang, D.
- Affiliations
- Yonsei University (KR)
- Kyung Hee University (KR)
- Venue
- Science Advances
- Published
- 2019-05-03
- Volume
- 5
- Issue
- 5
- Pages
- eaav2249-eaav2249
- ISSN
- 2375-2548 (ISSN-L)
- PMC
- PMC6520024
- OpenAlex
- W2946741946
- Cited by
- 101
- References
- 27
- Citations by year
- 2026: 4 · 2025: 9 · 2024: 17 · 2023: 15 · 2022: 14 · 2021: 17 · 2020: 13 · 2019: 9
- FWCI
- 4.38
- Type
- journal article
- Language
- en
- Open access
- gold
- doi.org
- Licence
- cc-by-nc
- Locations
- Science Advances (publishedVersion, cc-by-nc)
- bioRxiv (Cold Spring Harbor Laboratory) (acceptedVersion, cc-by-nc-nd)
- PubMed Central (publishedVersion, cc-by-nc)
- PubMed (publishedVersion)
- Funders
- National Research Foundation of Korea (2018R1A2A1A05079172, 2016M3A9B6948494, 2018M3A9H3024850, 2018R1A2B2001322)
- Topics
- Life Sciences › Biochemistry, Genetics and Molecular Biology › Molecular Biology › Single-cell and spatial transcriptomics
- Life Sciences › Biochemistry, Genetics and Molecular Biology › Molecular Biology › Genomics and Phylogenetic Studies
- Life Sciences › Biochemistry, Genetics and Molecular Biology › Molecular Biology › Gene expression and cancer classification
- Keywords
- single-cell RNA sequencing, transient transfection, Drop-seq, gene expression signatures, species mixing, transcriptomic response
- MeSH terms
- RNA-Seq, Algorithms, Animals, Humans, Oligonucleotides, RNA, Stochastic Processes, Cluster Analysis, K562 Cells, Gene Expression Profiling, NIH 3T3 Cells, Cell Line, Tumor, Mice, HEK293 Cells, Single-Cell Analysis, High-Throughput Nucleotide Sequencing, Transcriptome
About these checks
Registry, retraction, Cites and statistics results are computed, not judged, with one exception: a printed reference that no index lists is read once by a model before it counts as a citation error. Claims are extracted by a model and kept only when their quote appears verbatim in the text; each cited source is then checked, with a model’s help, for whether it says what the claim relies on. Those verdicts can be wrong — read the claim’s quote and the cited source before relying on one.
Statistics and arithmetic are recomputed, not judged.
Confidence bands are shown only for fields calibrated on our annotated test set. None is calibrated yet, so no band is shown.
What counts as a claim ›How we measure confidence ›How we check this ›
Are you an author, or do you see a problem with this page? Request a review
How to cite
Cite CoChat for the checks on this page, and the paper for its own findings.
- This page
- CoChat. (2026). Citation check: Multiplexed single-cell RNA-seq via transient barcoding for simultaneous expression profiling of various drug perturbations. https://app.cochat.ai/papers/10.1126/sciadv.aav2249
- The paper
- Shin, D., Lee, W., Lee, J. H., & Bang, D. (2019). Multiplexed single-cell RNA-seq via transient barcoding for simultaneous expression profiling of various drug perturbations. Science Advances. https://doi.org/10.1126/sciadv.aav2249
Data sources
Bibliographic data: Semantic Scholar, OpenAlex, Crossref.
Contains information from the Semantic Scholar Academic Graph Datasets, made available under the ODC Attribution License (ODC-BY 1.0).
Semantic Scholar’s data is described in: Kinney, R., et al. (2023). The Semantic Scholar Open Data Platform. arXiv:2301.10140.
