

The DOI matches its Crossref record; 18 of the 18 references it cites were found in a registry or an index.
Epigenetic clocks reveal a rejuvenation event during embryogenesis followed by aging
Published version of a preprint
Abstract
Epigenetic clocks reveal a rejuvenation event during embryogenesis followed by aging.
Overview
The claims and statistics of this paper haven’t been checked yet.
Run the check — free, no account needed. It reads the open-access text and checks the sources it cites.
Integrity signals
Registry
Cites
Statistics
Figures
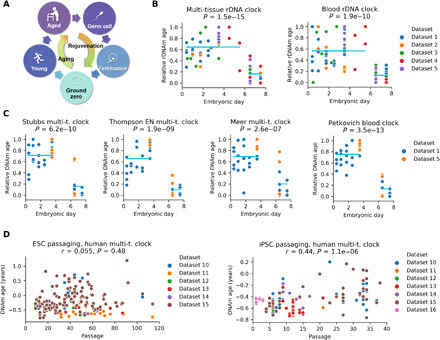
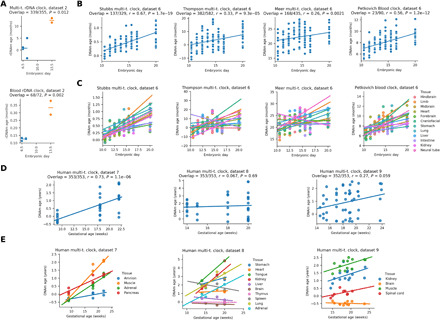
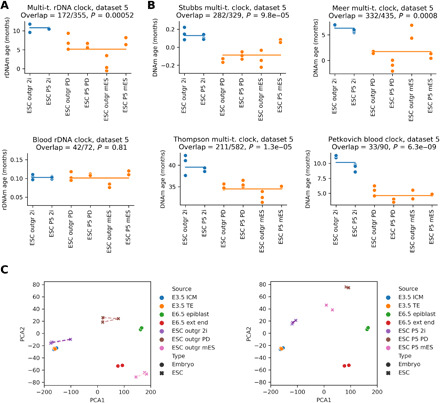
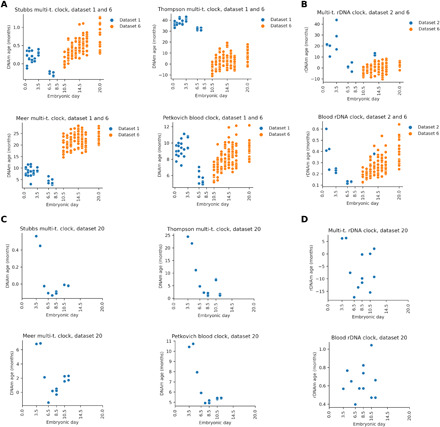
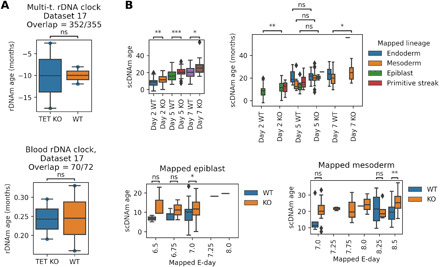
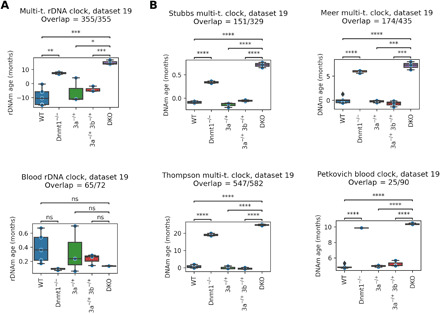
Verification
Claims the paper makes
The claims and statistics of this paper haven’t been checked yet.
Run the check — free, no account needed. It reads the open-access text and checks the sources it cites.
Claims other papers make about this one
Each is checked against this paper’s own text: does it say what the citing paper says it does?
In the citing paper
“Potentially, some of the rejuvenating mechanisms occurring in MPTR may mirror those that occur during embryonic development as epigenetic rejuvenation during embryonic development coincides with de novo methylation of the genome (Kerepesi et al., 2021).”
From Multi-omic rejuvenation of human cells by maturation phase transient reprogramming (2022) · cites this paper as Kerepesi et al., 2021
Self-check
Percentages, sums and reported differences re-computed from the paper’s own numbers.
The self-check needs the paper’s full text.
Citations
Cites
López-Otín, C., Blasco, M. A., Partridge, L., Serrano, M., & Kroemer, G. (2013) · Cell · doi:10.1016/j.cell.2013.05.039 · Cited by 14,982
Machine learning: Trends, perspectives, and prospects
Jordan, M. I., & Mitchell, T. M. (2015) · Science · doi:10.1126/science.aaa8415 · Cited by 9,955
DNA methylation age of human tissues and cell types
Horvath, S. (2013) · Genome Biology · doi:10.1186/gb-2013-14-10-r115 · Cited by 7,075
Performance of neural network basecalling tools for Oxford Nanopore sequencing
Wick, R. R., Judd, L. M., & Holt, K. E. (2019) · Genome Biology · doi:10.1186/s13059-019-1727-y · Cited by 3,221
DNA methylation GrimAge strongly predicts lifespan and healthspan
Lu, A. T., Quach, A., Wilson, J. G., Reiner, A. P., Aviv, A., Raj, K., Hou, L., Baccarelli, A. A., Li, Y., Stewart, J. D., et al. (2019) · Aging · doi:10.18632/aging.101684 · Cited by 2,540
DNA methylation aging clocks: challenges and recommendations
Bell, C. G., Lowe, R., Adams, P. D., Baccarelli, A. A., Beck, S., Bell, J. T., Christensen, B. C., Gladyshev, V. N., Heijmans, B. T., Horvath, S., et al. (2019) · Genome Biology · doi:10.1186/s13059-019-1824-y · Cited by 1,025
Self-citationIn Vivo Amelioration of Age-Associated Hallmarks by Partial Reprogramming.
Ocampo, A., Reddy, P., Martinez-Redondo, P., Platero-Luengo, A., Hatanaka, F., Hishida, T., Li, M., Lam, D., Kurita, M., Beyret, E., et al. (2016) · Cell · doi:10.1016/j.cell.2016.11.052 · Cited by 988
Reprogramming to recover youthful epigenetic information and restore vision
Lu, Y., Brommer, B., Tian, X., Krishnan, A., Meer, M., Wang, C., Vera, D. L., Zeng, Q., Yu, D., Bonkowski, M. S., et al. (2020) · Nature · doi:10.1038/s41586-020-2975-4 · Cited by 820
Self-citationStem cells, ageing and the quest for immortality
Rando, T. A. (2006) · Nature · doi:10.1038/nature04958 · Cited by 695
Booth, L. N., & Brunet, A. (2016) · Molecular Cell · doi:10.1016/j.molcel.2016.05.013 · Cited by 499
Using DNA methylation profiling to evaluate biological age and longevity interventions
Petkovich, D. A., Podolskiy, D. I., Lobanov, A. V., Lee, S.-G., Miller, R. A., & Gladyshev, V. N. (2017) · Cell Metabolism · doi:10.1016/j.cmet.2017.03.016 · Cited by 398
Self-citationSarkar, T. J., Quarta, M., Mukherjee, S., Colville, A., Paine, P., Doan, L., Tran, C. M., Chu, C. R., Horvath, S., Qi, L. S., et al. (2020) · Nature Communications · doi:10.1038/s41467-020-15174-3 · Cited by 308
TET-mediated DNA demethylation controls gastrulation by regulating Lefty-Nodal signalling
Dai, H.-Q., Wang, B.-A., Yang, L., Chen, J.-J., Zhu, G.-C., Sun, M.-L., Ge, H., Wang, R., Chapman, D. L., Tang, F., et al. (2016) · Nature · doi:10.1038/nature20095 · Cited by 206
A multi-tissue full lifespan epigenetic clock for mice
Thompson, M. J., Chwiałkowska, K., Rubbi, L., Lusis, A. J., Davis, R. C., Srivastava, A., Korstanje, R., Churchill, G. A., Horvath, S., & Pellegrini, M. (2018) · Aging · doi:10.18632/aging.101590 · Cited by 203
Biohorology and biomarkers of aging: Current state-of-the-art, challenges and opportunities
Galkin, F., Mamoshina, P., Aliper, A., de Magalhães, J. P., Gladyshev, V. N., & Zhavoronkov, A. (2020) · Ageing Research Reviews · doi:10.1016/j.arr.2020.101050 · Cited by 189
Self-citationMulti-omic rejuvenation of human cells by maturation phase transient reprogramming
Gill, D., Parry, A., Santos, F., Okkenhaug, H., Todd, C. D., Hernando-Herraez, I., Stubbs, T. M., Milagre, I., & Reik, W. (2022) · eLife · doi:10.7554/elife.71624 · Cited by 185
A whole lifespan mouse multi-tissue DNA methylation clock
Meer, M. V., Podolskiy, D. I., Tyshkovskiy, A., & Gladyshev, V. N. (2018) · eLife · doi:10.7554/elife.40675 · Cited by 176
Self-citationRibosomal DNA harbors an evolutionarily conserved clock of biological aging
Wang, M., & Lemos, B. (2019) · Genome Research · doi:10.1101/gr.241745.118 · Cited by 131
Research works printed but not linked: 60
- 10.1159/000173977 · DOI
- 10.1007/s00018-015-1896-0 · DOI
- 10.1111/acel.12480 · DOI
- 10.1016/j.cell.2012.01.003 · DOI · Paper page
- 10.1016/j.fsigen.2015.05.014 · DOI
- 10.1371/journal.pgen.1004458 · DOI
- 10.1186/s12864-018-5153-4 · DOI
- 10.1016/j.molmed.2020.08.012 · DOI
- 10.2174/1389202918666170412112130 · DOI
- 10.1007/s10522-017-9683-y · DOI
- 10.1038/s41576-018-0004-3 · DOI · Paper page
- 10.1186/gb-2014-15-2-r24 · DOI · Paper page
- 10.18632/aging.101414 · DOI · Paper page
- 10.1016/j.molcel.2012.10.016 · DOI · Paper page
- 10.18632/aging.100908 · DOI
- 10.1186/s13059-015-0584-6 · DOI · Paper page
- 10.1093/ije/dyu277 · DOI
- 10.1186/s13148-016-0186-5 · DOI
- 10.18632/aging.100859 · DOI
- 10.1111/acel.12325 · DOI
- 10.18632/aging.101217 · DOI
- 10.1186/s13059-017-1203-5 · DOI · Paper page
- 10.1186/s13059-017-1186-2 · DOI
- 10.7554/eLife.37462 · DOI
- 10.1111/acel.12877 · DOI · Paper page
- MAMMALIAN METHYLATION CONSORTIUM A. T. Lu Z. Fei A. Haghani T. R. Robeck J. A. Zoller C. Z. Li J. Zhang J. Ablaeva D. M. Adams J. Almunia R. Ardehali A. Arneson C. S. Baker K. Belov P. Black D. T. Blumstein E. K. Bors C. E. Breeze R. T. Brooke J. L. Brown A. Caulton J. M. Cavin I. Chatzistamou H. Chen P. Chiavellini O.-W. Choi S. Clarke J. DeYoung C. Dold C. K. Emmons S. Emmrich C. G. Faulkes S. H. Ferguson C. J. Finno J.-M. Gaillard E. Garde V. N. Gladyshev V. Gorbunova R. G. Goya M. J. Grant E. N. Hales M. B. Hanson M. Haulena A. N. Hogan C. J. Hogg T. A. Hore A. J. Jasinska G. Jones E. Jourdain O. Kashpur H. Katcher E. Katsumata V. Kaza H. Kiaris M. S. Kobor P. Kordowitzki W. R. Koski B. Larison S.-G. Lee Y. C. Lee M. Lehmann J.-F. Lemaitre A. J. Levine C. Li X. Li D. T. Lin N. Macoretta D. Maddox C. O. Matkin J. A. Mattison J. Mergl J. J. Meudt K. Mozhui A. Naderi M. Nagy P. Narayan P. W. Nathanielsz N. B. Nguyen C. Niehrs A. G. Ophir E. A. Ostrander P. O. Ginn K. M. Parsons K. C. Paul M. Pellegrini G. M. Pinho J. Plassais N. A. Prado B. Rey B. R. Ritz J. Robbins M. Rodriguez J. Russell E. Rydkina L. L. Sailer A. B. Salmon A. Sanghavi K. M. Schachtschneider D. Schmitt T. Schmitt L. Schomacher L. B. Schook K. E. Sears A. Seluanov D. Shanmuganayagam A. Shindyapina K. Singh I. Sinha R. G. Snell E. Soltanmaohammadi M. L. Spangler L. Staggs K. J. Steinman V. J. Sugrue B. Szladovits M. Takasugi E. C. Teeling M. J. Thompson B. Van Bonn S. C. Vernes D. Villar H. V. Vinters M. C. Wallingford N. Wang R. K. Wayne G. S. Wilkinson C. K. Williams R. W. Williams X. W. Yang B. G. Young B. Zhang Z. Zhang P. Zhao Y. Zhao J. Zimmermann W. Zhou J. Ernst K. Raj S. Horvath Universal DNA methylation age across mammalian tissues. bioRxiv 2021.01.18.426733 [ Preprint ]. 19 January 2021. https://doi.org/10.1101/2021.01.18.426733. · DOI
- 10.1038/s41598-019-39919-3 · DOI · Paper page
- 10.1186/s13059-016-1068-z · DOI
- 10.1101/gr.180273.114 · DOI · Paper page
- 10.1101/gad.283838.116 · DOI
- 10.1089/scd.2012.0256 · DOI
- 10.1186/s13059-014-0545-5 · DOI
- 10.1038/s41586-019-1825-8 · DOI
- A. Trapp C. Kerepesi V. N. Gladyshev Profiling epigenetic age in single cells. bioRxiv 2021.03.13.435247 [ Preprint ]. 15 March 2021. https://doi.org/10.1101/2021.03.13.435247. · DOI
- 10.1016/S0092-8674(00)81656-6 · DOI · Paper page
- 10.1038/s41467-020-16919-w · DOI
- 10.1038/ncb1664 · DOI
- 10.1016/j.cell.2014.04.017 · DOI
- 10.1126/science.1245316 · DOI · Paper page
- B. Zhang, V. N. Gladyshev, How can aging be reversed? Exploring rejuvenation from a damage-based perspective. Adv. Genet. 1, e10025 (2020). · DOI
- 10.1111/j.1439-0418.2008.01356.x · DOI
- 10.1016/j.semcdb.2014.06.010 · DOI
- 10.1007/978-1-4939-7481-8_33 · DOI
- 10.1016/j.celrep.2019.11.091 · DOI
- 10.1186/s13148-017-0315-9 · DOI
- 10.1038/nature10960 · DOI
- 10.1038/s41556-018-0093-4 · DOI
- 10.1038/s41467-019-12664-x · DOI
- 10.1038/s41586-020-2119-x · DOI
- 10.1111/acel.12738 · DOI
- 10.1093/bioinformatics/btr167 · DOI
- 10.1038/nature13581 · DOI
- 10.1371/journal.pgen.1005583 · DOI
- 10.1016/j.stem.2012.02.013 · DOI
- 10.1186/s13072-016-0054-8 · DOI
- 10.1016/j.scr.2012.09.002 · DOI
- 10.1038/nmeth.2255 · DOI · Paper page
- L. Zimmerlin, T. S. Park, J. S. Huo, K. Verma, S. R. Pather, C. C. Talbot, J. Agarwal, D. Steppan, Y. W. Zhang, M. Considine, H. Guo, X. Zhong, C. Gutierrez, L. Cope, M. V. Canto-Soler, A. D. Friedman, S. B. Baylin, E. T. Zambidis, Tankyrase inhibition promotes a stable human naïve pluripotent state with improved functionality. Development 143, 4368–4380 (2016). · DOI
- 10.1016/j.scr.2013.11.010 · DOI
- 10.1073/pnas.1413299111 · DOI
Cited by
Sorted by citations
Making sense of the ageing methylome
Seale, K., Horvath, S., Teschendorff, A., Eynon, N., & Voisin, S. (2022) · Nature Reviews Genetics · doi:10.1038/s41576-022-00477-6 · Cited by 274
The relationship between epigenetic age and the hallmarks of aging in human cells.
Kabacik, S., Lowe, D., Fransen, L., Leonard, M., Ang, S.-L., Whiteman, C., Corsi, S., Cohen, H., Felton, S., Bali, R., et al. (2022) · Nature Aging · doi:10.1038/s43587-022-00220-0 · Cited by 207
Multi-omic rejuvenation of human cells by maturation phase transient reprogramming
Gill, D., Parry, A., Santos, F., Okkenhaug, H., Todd, C. D., Hernando-Herraez, I., Stubbs, T. M., Milagre, I., & Reik, W. (2022) · eLife · doi:10.7554/elife.71624 · Cited by 185
The Information Theory of Aging
Lu, Y. R., Tian, X., & Sinclair, D. A. (2023) · Nature Aging · doi:10.1038/s43587-023-00527-6 · Cited by 141
Multi-omic rejuvenation and lifespan extension on exposure to youthful circulation
Zhang, B., Lee, D. E., Trapp, A., Tyshkovskiy, A., Lu, A. T., Bareja, A., Kerepesi, C., McKay, L. K., Shindyapina, A. V., Dmitriev, S. E., et al. (2023) · Nature Aging · doi:10.1038/s43587-023-00451-9 · Cited by 134
Self-citation
Metadata
- Authors
- Kerepesi, C., Zhang, B., Lee, S.-G., Trapp, A., & Gladyshev, V. N.
- Affiliations
- Division of Genetics, Department of Medicine, Brigham and Women’s Hospital and Harvard Medical School, Boston, MA 02115, USA.
- Venue
- Science Advances
- Published
- 2021-06-25
- Volume
- 7
- Issue
- 26
- ISSN
- 2375-2548
- PMC
- PMC8232908
- Cited by
- 130
- References
- 18
- Language
- en
- Funders
- National Institutes of Health (AG064223)
- National Institute on Aging (AG067782, AG065403)
About these checks
Registry, retraction, Cites and statistics results are computed, not judged, with one exception: a printed reference that no index lists is read once by a model before it counts as a citation error. Claims are extracted by a model and kept only when their quote appears verbatim in the text; each cited source is then checked, with a model’s help, for whether it says what the claim relies on. Those verdicts can be wrong — read the claim’s quote and the cited source before relying on one.
Statistics and arithmetic are recomputed, not judged.
Confidence bands are shown only for fields calibrated on our annotated test set. None is calibrated yet, so no band is shown.
What counts as a claim ›How we measure confidence ›How we check this ›
Are you an author, or do you see a problem with this page? Request a review
