

Programmable and contractile materials through cell encapsulation in fibrous hydrogel assemblies
Open accessPublished version of a preprint
The DOI matches its Crossref record; 77 of the 77 references it cites were found in a registry or an index.
Abstract
Synthetic fibrous materials were engineered to contract under cellular forces similar to natural extracellular matrix.
Overview
The claims and statistics of this paper haven’t been checked yet.
Free: it reads the open-access text and checks the first 5 claims that cite a source we can check. Create a free account to check every claim.
Integrity signals
Registry
Cites
Statistics
Figures
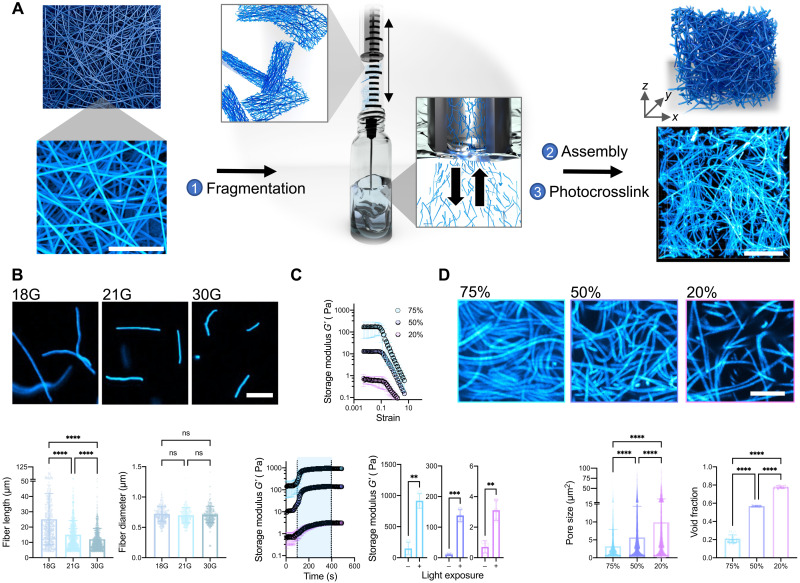

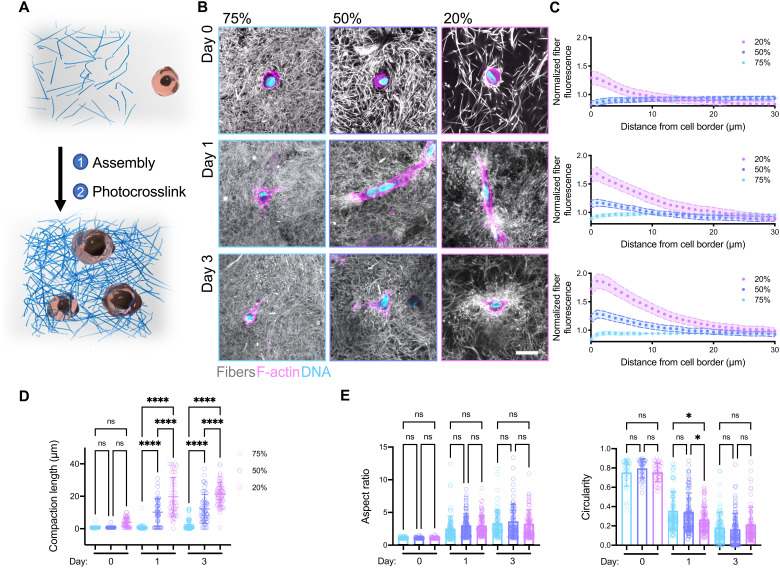


Verification
Claims the paper makes
The claims and statistics of this paper haven’t been checked yet.
Free: it reads the open-access text and checks the first 5 claims that cite a source we can check. Create a free account to check every claim.
Claims other papers make about this one
Each is checked against this paper’s own text: does it say what the citing paper says it does?
The cited source doesn’t support the claim as written.
In the citing paper
“Similar phenomena were observed in a study reported by Burdick et al., (2021) with higher fiber densities yielding higher strain [23].”
From Development of silk microfiber-reinforced bioink for muscle tissue engineering and in situ printing by a handheld 3D printer (2025) · cites this paper as [23]
Checked by a reasoning model — may be wrong.
Experimental — accuracy not yet measuredThe source backs part of the claim, not all of it — or backs it for a different population, condition or comparison.
In the citing paper
“Fiber-reinforced composites show enhanced mechanical strength and fiber-induced cell alignment in various cell studies[23, 26–30].”
From Development of silk microfiber-reinforced bioink for muscle tissue engineering and in situ printing by a handheld 3D printer (2025) · cites this paper as [23]
Experimental — accuracy not yet measuredThe source backs part of the claim, not all of it — or backs it for a different population, condition or comparison.
In the citing paper
“This finding is consistent with previous studies that have demonstrated similar outcomes, including fiber-oriented cell alignment [23, 27].”
From Development of silk microfiber-reinforced bioink for muscle tissue engineering and in situ printing by a handheld 3D printer (2025) · cites this paper as [23]
Experimental — accuracy not yet measuredThe source backs part of the claim, not all of it — or backs it for a different population, condition or comparison.
In the citing paper
“Literature suggests that higher fiber densities can impediment cell recruitment due to increased mechanical resistance, resulting in reduced cell spreading and increased cell circularity [23].”
From Development of silk microfiber-reinforced bioink for muscle tissue engineering and in situ printing by a handheld 3D printer (2025) · cites this paper as [23]
Experimental — accuracy not yet measuredThe cited source says what the claim attributes to it.
In the citing paper
“Fiber-reinforced hydrogel composites recently gained attention with their unique fibrous structure mimicking native tissue architecture [23–25].”
From Development of silk microfiber-reinforced bioink for muscle tissue engineering and in situ printing by a handheld 3D printer (2025) · cites this paper as [23]
Self-check
Percentages, sums and reported differences re-computed from the paper’s own numbers.
The self-check needs the paper’s full text.
Citations
Cites
Myofibroblasts and mechano-regulation of connective tissue remodelling
Tomasek, J. J., Gabbiani, G., Hinz, B., Chaponnier, C., & Brown, R. A. (2002) · Nature Reviews Molecular Cell Biology · doi:10.1038/nrm809 · Cited by 4,290 · cited 1×
“For example, cell contractility is responsible for many self-assembly or morphogenic processes in vivo, such as shaping tissues in embryonic development (8) and closing wounds during healing (9).”
BackgroundA practical guide to hydrogels for cell culture
Caliari, S. R., & Burdick, J. A. (2016) · Nature Methods · doi:10.1038/nmeth.3839 · Cited by 2,075
Self-citationNo evidence that carotenoid pigments boost either immune or antioxidant defenses in a songbird
Koch, R. E., Kavazis, A. N., Hasselquist, D., Hood, W. R., Zhang, Y., Toomey, M. B., & Hill, G. E. (2018) · Nature Communications · doi:10.1038/s41467-018-02974-x · Cited by 1,924
3D bioprinting of collagen to rebuild components of the human heart
Lee, A., Hudson, A. R., Shiwarski, D. J., Tashman, J. W., Hinton, T. J., Yerneni, S., Bliley, J. M., Campbell, P. G., & Feinberg, A. W. (2019) · Science · doi:10.1126/science.aav9051 · Cited by 1,782
Nonlinear elasticity in biological gels
Storm, C., Pastore, J. J., MacKintosh, F. C., Lubensky, T. C., & Janmey, P. A. (2005) · Nature · doi:10.1038/nature03521 · Cited by 1,703
Self-citationSLIM: Simultaneous Logic-in-Memory Computing Exploiting Bilayer Analog OxRAM Devices
Kingra, S. K., Parmar, V., Chang, C.-C., Hudec, B., Hou, T.-H., & Suri, M. (2020) · Scientific Reports · doi:10.1038/s41598-020-59121-0 · Cited by 1,439
Advanced maturation of human cardiac tissue grown from pluripotent stem cells
Ronaldson-Bouchard, K., Ma, S. P., Yeager, K., Chen, T., Song, L., Sirabella, D., Morikawa, K., Teles, D., Yazawa, M., & Vunjak-Novakovic, G. (2018) · Nature · doi:10.1038/s41586-018-0016-3 · Cited by 1,272
Yang, B.-J., Han, X.-X., Yin, L.-L., Xing, M.-Q., Xu, Z.-H., & Xue, H.-W. (2016) · Nature Communications · doi:10.1038/ncomms11388 · Cited by 1,202
Synthetic alternatives to Matrigel
Aisenbrey, E. A., & Murphy, W. L. (2020) · Nature Reviews Materials · doi:10.1038/s41578-020-0199-8 · Cited by 1,016 · cited 1×
“Furthermore, other ECM-derived matrices, such as Matrigel and decellularized ECM, are widely used in cell culture, in tissue engineering, and even as clinical therapies; however, their batch variability and animal sourcing are limiting (13).”
BackgroundBiomanufacturing of organ-specific tissues with high cellular density and embedded vascular channels
Skylar-Scott, M. A., Uzel, S. G. M., Nam, L. L., Ahrens, J. H., Truby, R. L., Damaraju, S., & Lewis, J. A. (2019) · Science Advances · doi:10.1126/sciadv.aaw2459 · Cited by 943
The Gender Citation Gap in International Relations
Maliniak, D., Powers, R., & Walter, B. F. (2013) · International Organization · doi:10.1017/s0020818313000209 · Cited by 718
Measurement of mechanical tractions exerted by cells in three-dimensional matrices
Legant, W. R., Miller, J. S., Blakely, B. L., Cohen, D. M., Genin, G. M., & Chen, C. S. (2010) · Nature Methods · doi:10.1038/nmeth.1531 · Cited by 647
Baker, B. M., Gee, A. O., Metter, R. B., Nathan, A. S., Marklein, R. A., Burdick, J. A., & Mauck, R. L. (2008) · Biomaterials · doi:10.1016/j.biomaterials.2008.01.032 · Cited by 620 · cited 1×
“The sacrificial fiber population physically blocks interfiber bonds during scaffold fabrication but then dissolves away, allowing easier fragmentation (24).”
BackgroundSelf-citationBaker, B. M., Trappmann, B., Wang, W. Y., Sakar, M. S., Kim, I. L., Shenoy, V. B., Burdick, J. A., & Chen, C. S. (2015) · Nature Materials · doi:10.1038/nmat4444 · Cited by 556
Self-citationThe extent and drivers of gender imbalance in neuroscience reference lists
Dworkin, J. D., Linn, K. A., Teich, E. G., Zurn, P., Shinohara, R. T., & Bassett, D. S. (2020) · Nature Neuroscience · doi:10.1038/s41593-020-0658-y · Cited by 492
Brown, R. A., Wiseman, M., Chuo, C. ‐., Cheema, U., & Nazhat, S. N. (2005) · Advanced Functional Materials · doi:10.1002/adfm.200500042 · Cited by 480
Vascular Tissue Engineering: Progress, Challenges, and Clinical Promise
Song, H.-H. G., Rumma, R. T., Ozaki, C. K., Edelman, E. R., & Chen, C. S. (2018) · Cell Stem Cell · doi:10.1016/j.stem.2018.02.009 · Cited by 476
Recapitulating macro-scale tissue self-organization through organoid bioprinting
Brassard, J. A., Nikolaev, M., Hübscher, T., Hofer, M., & Lutolf, M. P. (2021) · Nature Materials · doi:10.1038/s41563-020-00803-5 · Cited by 469 · cited 2×
“Beyond microtissue formation, fibrous assemblies could potentially be useful for other bottom-up approaches such as the self-assembly of vasculature (2), organoid culture and fusion (42), and microphysiological systems.”
BackgroundDoyle, A. D., Carvajal, N., Jin, A., Matsumoto, K., & Yamada, K. M. (2015) · Nature Communications · doi:10.1038/ncomms9720 · Cited by 461 · cited 1×
“9 m for collagen gel fibers (25)] and ECM-like fiber diameters (14) [~700 nm for NorHA fibers versus ~310 to 899 nm reported for type I collagen gel fibers (25), or ~350 nm for collagen I in this study] (Fig.”
BackgroundA scalable pipeline for designing reconfigurable organisms
Kriegman, S., Blackiston, D., Levin, M., & Bongard, J. (2020) · Proceedings of the National Academy of Sciences · doi:10.1073/pnas.1910837117 · Cited by 461 · cited 1×
“Additionally, we believe that fibrous assemblies could enable developments in other areas, such as the fabrication of biological machines (58) and multi-tissue assembly.”
BackgroundCellular extrusion bioprinting improves kidney organoid reproducibility and conformation
Lawlor, K. T., Vanslambrouck, J. M., Higgins, J. W., Chambon, A., Bishard, K., Arndt, D., Er, P. X., Wilson, S. B., Howden, S. E., Tan, K. S., et al. (2021) · Nature Materials · doi:10.1038/s41563-020-00853-9 · Cited by 435
Microfabricated tissue gauges to measure and manipulate forces from 3D microtissues
Legant, W. R., Pathak, A., Yang, M. T., Deshpande, V. S., McMeeking, R. M., & Chen, C. S. (2009) · Proceedings of the National Academy of Sciences · doi:10.1073/pnas.0900174106 · Cited by 434 · cited 3×
“INTRODUCTION Natural fibrous matrices, such as fibrin and collagen, are components of the extracellular matrix (ECM) and are widely used in vitro for applications such as gel contraction assays in mechanobiology (1), self-assembly of vasculature (2) and microtissues (3), and emerging biofabrication and tissue engineer…”
BackgroundInfluentialOsaki, T., Uzel, S. G. M., & Kamm, R. D. (2018) · Science Advances · doi:10.1126/sciadv.aat5847 · Cited by 421
Stress-stiffening-mediated stem-cell commitment switch in soft responsive hydrogels
Das, R. K., Gocheva, V., Hammink, R., Zouani, O. F., & Rowan, A. E. (2016) · Nature Materials · doi:10.1038/nmat4483 · Cited by 406 · cited 2×
“While other nonlinear synthetic material systems have been described (15, 16, 30), these materials fail to capture the micrometer-scale porosities, fiber diameters, lengths, and 3D architectures that we observe with these fibrous hydrogel assemblies.”
BackgroundDesign and applications of man-made biomimetic fibrillar hydrogels
Prince, E., & Kumacheva, E. (2019) · Nature Reviews Materials · doi:10.1038/s41578-018-0077-9 · Cited by 379
Fibrous nonlinear elasticity enables positive mechanical feedback between cells and ECMs
Hall, M. S., Alisafaei, F., Ban, E., Feng, X., Hui, C.-Y., Shenoy, V. B., & Wu, M. (2016) · Proceedings of the National Academy of Sciences · doi:10.1073/pnas.1613058113 · Cited by 360 · cited 1×
“Our results are also similar to what has been reported for type I collagen gels produced with low and high collagen concentrations (31), are consistent with previous computational models (12, 28), and further validate the ECM-like properties of our fibrous assemblies.”
ResultSelf-citationGramlich, W. M., Kim, I. L., & Burdick, J. A. (2013) · Biomaterials · doi:10.1016/j.biomaterials.2013.08.089 · Cited by 337 · cited 1×
“NorHA was synthesized as previously described (52).”
Self-citationDaly, A. C., Prendergast, M. E., Hughes, A. J., & Burdick, J. A. (2021) · Cell · doi:10.1016/j.cell.2020.12.002 · Cited by 332 · cited 1×
“Photolithography-based printing methods are emerging as highresolution alternatives to extrusion bioprinting with features around 10 to 100 m (44); however, currently, there are no photocrosslinkable fibrous materials that are compatible with the requirements for photolithography-based printing, limiting the utility…”
BackgroundSelf-citationLong-range force transmission in fibrous matrices enabled by tension-driven alignment of fibers
Wang, H., Abhilash, A. S., Chen, C. S., Wells, R. G., & Shenoy, V. B. (2014) · Biophysical Journal · doi:10.1016/j.bpj.2014.09.044 · Cited by 313 · cited 2×
“, strain-stiffening behavior) (11) that support cell contraction and mechanical interactions between cells through the matrix (12).”
BackgroundResultSelf-citationCell contraction induces long-ranged stress stiffening in the extracellular matrix
Han, Y. L., Ronceray, P., Xu, G., Malandrino, A., Kamm, R. D., Lenz, M., Broedersz, C. P., & Guo, M. (2018) · Proceedings of the National Academy of Sciences · doi:10.1073/pnas.1722619115 · Cited by 300 · cited 1×
“These results further support the ECM-like properties of fibrous assemblies, showing that cells can stiffen assemblies and plastically deform them through contraction (32, 33).”
ResultGendered Citation Patterns in International Relations Journals
Mitchell, S. M., Lange, S., & Brus, H. (2013) · International Studies Perspectives · doi:10.1111/insp.12026 · Cited by 295
Gelatin hydrogels formed by orthogonal thiol–norbornene photochemistry for cell encapsulation
Mũnoz, Z., Shih, H., & Lin, C.-C. (2014) · Biomater. Sci. · doi:10.1039/c4bm00070f · Cited by 253
From mechanical resilience to active material properties in biopolymer networks
Burla, F., Mulla, Y., Vos, B. E., Aufderhorst-Roberts, A., & Koenderink, G. H. (2019) · Nature Reviews Physics · doi:10.1038/s42254-019-0036-4 · Cited by 224 · cited 4×
“, covalent versus physical) and the extent to which the assemblies mimic natural ECM fibers (10); however, we have only selected a range of material formulations for this proof-of-concept illustration of the technique and potential utility of the approach.”
BackgroundInfluentialJeon, O., Lee, Y. B., Jeong, H., Lee, S. J., Wells, D., & Alsberg, E. (2019) · Materials Horizons · doi:10.1039/c9mh00375d · Cited by 221
Omidinia‐Anarkoli, A., Boesveld, S., Tuvshindorj, U., Rose, J. C., Haraszti, T., & De Laporte, L. (2017) · Small · doi:10.1002/smll.201702207 · Cited by 210 · cited 1×
“This approach provides a rapid and efficient method to generate fiber suspensions and overcomes challenges with alternate approaches, such as issues with light diffusion and polymer loss using photopatterning (21), lengthy multistep protocols for cryosectioning (26), or harsh chemical treatments with aminolysis (27).”
MethodStrain stiffening in collagen I networks
Motte, S., & Kaufman, L. J. (2013) · Biopolymers · doi:10.1002/bip.22133 · Cited by 181
Nanofibrous Hydrogels with Spatially Patterned Biochemical Signals to Control Cell Behavior
Wade, R. J., Bassin, E. J., Gramlich, W. M., & Burdick, J. A. (2015) · Advanced Materials · doi:10.1002/adma.201404993 · Cited by 179
Self-citationEngineered Tissue Folding by Mechanical Compaction of the Mesenchyme
Hughes, A. J., Miyazaki, H., Coyle, M. C., Zhang, J., Laurie, M. T., Chu, D., Vavrušová, Z., Schneider, R. A., Klein, O. D., & Gartner, Z. J. (2018) · Developmental Cell · doi:10.1016/j.devcel.2017.12.004 · Cited by 177 · cited 1×
“Instabilities created by differential cell contraction are hypothesized to promote tissue bending during development and in engineered tissues (8, 52), and our results suggest that fiber density can influence morphological changes in tissue shape.”
BackgroundCollagen Gel Contraction Assay
Ngo, P., Ramalingam, P., Phillips, J. A., & Furuta, G. T. (2006) · Cell-Cell Interactions in Health and Disease · doi:10.1385/1-59745-113-4:103 · Cited by 169
Mechanisms of Plastic Deformation in Collagen Networks Induced by Cellular Forces
Ban, E., Franklin, J. M., Nam, S., Smith, L., Wang, H., Wells, R. G., Chaudhuri, O., Liphardt, J., & Shenoy, V. B. (2018) · Biophysical Journal · doi:10.1016/j.bpj.2017.11.3739 · Cited by 169
Self-citationIn situ expansion of engineered human liver tissue in a mouse model of chronic liver disease
Stevens, K. R., Scull, M. A., Ramanan, V., Fortin, C. L., Chaturvedi, R. R., Knouse, K. A., Xiao, J. W., Fung, C., Mirabella, T., Chen, A. X., et al. (2017) · Science Translational Medicine · doi:10.1126/scitranslmed.aah5505 · Cited by 164
Hydrogel Network Dynamics Regulate Vascular Morphogenesis
Wei, Z., Schnellmann, R., Pruitt, H. C., & Gerecht, S. (2020) · Cell Stem Cell · doi:10.1016/j.stem.2020.08.005 · Cited by 162
3D Bioprinting of Macroporous Materials Based on Entangled Hydrogel Microstrands
Kessel, B., Lee, M., Bonato, A., Tinguely, Y., Tosoratti, E., & Zenobi‐Wong, M. (2020) · Advanced Science · doi:10.1002/advs.202001419 · Cited by 160
Intestinal epithelial organoids fuse to form self-organizing tubes in floating collagen gels
Sachs, N., Tsukamoto, Y., Kujala, P., Peters, P. J., & Clevers, H. C. (2017) · Development · doi:10.1242/dev.143933 · Cited by 152
Direct 3D bioprinting of cardiac micro-tissues mimicking native myocardium
Liu, J., Miller, K. L., Ma, X., Dewan, S., Lawrence, N., Whang, G. J., Chung, P., McCulloch, A. D., & Chen, S. (2020) · Biomaterials · doi:10.1016/j.biomaterials.2020.120204 · Cited by 151
Fibrotic microtissue array to predict anti-fibrosis drug efficacy
Asmani, M., Velumani, S., Li, Y., Wawrzyniak, N., Hsia, I., Chen, Z., Hinz, B., & Zhao, R. (2018) · Nature Communications · doi:10.1038/s41467-018-04336-z · Cited by 137 · cited 1×
“Microtissues formed from the cellular embedding and remodeling of ECM have been used to study cell and ECM organization during wound healing (41), model healthy and diseased tissue (42, 43), and promote iPSC maturation (44).”
BackgroundCellular forces and matrix assembly coordinate fibrous tissue repair
Sakar, M. S., Eyckmans, J., Pieters, R., Eberli, D., Nelson, B. J., & Chen, C. S. (2016) · Nature Communications · doi:10.1038/ncomms11036 · Cited by 133 · cited 1×
“Microtissues via contractile fibrous hydrogel assemblies Microtissues formed from the cellular embedding and remodeling of ECM have been used to study cell and ECM organization during wound healing (34), model healthy and diseased tissue (35), and promote induced pluripotent stem cell maturation (36).”
BackgroundCrosslinking of fibrous hydrogels
Schoenmakers, D. C., Rowan, A. E., & Kouwer, P. H. J. (2018) · Nature Communications · doi:10.1038/s41467-018-04508-x · Cited by 125
Engineering microenvironment for human cardiac tissue assembly in heart-on-a-chip platform
Zhao, Y., Rafatian, N., Wang, E. Y., Feric, N. T., Lai, B., Knee‐Walden, E. J., Backx, P. H., & Radisic, M. (2019) · Matrix Biology · doi:10.1016/j.matbio.2019.04.001 · Cited by 120
Chen, D., Smith, L., Khandekar, G., Patel, P., Yu, C. K., Zhang, K., Chen, C. S., Han, L., & Wells, R. G. (2020) · Scientific Reports · doi:10.1038/s41598-020-76107-0 · Cited by 111
Quantitative characterization of 3D bioprinted structural elements under cell generated forces
Morley, C. D., Ellison, S. T., Bhattacharjee, T., O’Bryan, C. S., Zhang, Y., Smith, K. F., Kabb, C. P., Sebastian, M., Moore, G. L., Schulze, K. D., et al. (2019) · Nature Communications · doi:10.1038/s41467-019-10919-1 · Cited by 107 · cited 2×
“01) and high (5) strains repeatedly at 1 Hz.”
BackgroundSynthetic Extracellular Matrices with Nonlinear Elasticity Regulate Cellular Organization
Liu, K., Mihaila, S. M., Rowan, A. E., Oosterwijk, E., & Kouwer, P. H. J. (2019) · Biomacromolecules · doi:10.1021/acs.biomac.8b01445 · Cited by 98
Engineered Biomaterial Platforms to Study Fibrosis
Davidson, M. D., Burdick, J. A., & Wells, R. G. (2020) · Advanced Healthcare Materials · doi:10.1002/adhm.201901682 · Cited by 97 · cited 1×
“For example, cell contractility is responsible for many self-assembly or morphogenic processes in vivo, such as shaping tissues in embryonic development (8) and closing wounds during healing (9).”
BackgroundSelf-citationStrong triaxial coupling and anomalous Poisson effect in collagen networks
Ban, E., Wang, H., Franklin, J. M., Liphardt, J., Janmey, P. A., & Shenoy, V. B. (2019) · Proceedings of the National Academy of Sciences · doi:10.1073/pnas.1815659116 · Cited by 95
Self-citationKim, H. S., Mandakhbayar, N., Kim, H., Leong, K. W., & Yoo, H. S. (2020) · Biomaterials · doi:10.1016/j.biomaterials.2020.120214 · Cited by 90
Mondrinos, M. J., Alisafaei, F., Yi, A. Y., Ahmadzadeh, H., Lee, I., Blundell, C., Seo, J., Osborn, M., Jeon, T., Kim, S. M., et al. (2021) · Science Advances · doi:10.1126/sciadv.abe9446 · Cited by 89 · cited 2×
“The 3D fibrous networks remain within the tissue after 14 days of culture, suggesting that these fibers not only facilitate but also integrate with the microtissue, which could be useful to provide further control over contracted microtissue differentiation and maturation (39).”
BackgroundSelf-citationStrain Stiffening Hydrogels through Self‐Assembly and Covalent Fixation of Semi‐Flexible Fibers
Romera, M. F., Lafleur, R. P. M., Guibert, C., Voets, I. K., Storm, C., & Sijbesma, R. P. (2017) · Angewandte Chemie International Edition · doi:10.1002/anie.201704046 · Cited by 88
Cell‐Laden Multiple‐Step and Reversible 4D Hydrogel Actuators to Mimic Dynamic Tissue Morphogenesis
Ding, A., Jeon, O., Tang, R., Lee, Y. B., Lee, S. J., & Alsberg, E. (2021) · Advanced Science · doi:10.1002/advs.202004616 · Cited by 84
Vogt, N. (2021) · Nature Methods · doi:10.1038/s41592-020-01026-x · Cited by 77
Fiber density modulates cell spreading in 3D interstitial matrix mimetics
Matera, D. L., Wang, W. Y., Smith, M. R., Shikanov, A., & Baker, B. M. (2019) · ACS Biomaterials Science & Engineering · doi:10.1021/acsbiomaterials.9b00141 · Cited by 75 · cited 3×
“This approach provides a rapid and efficient method to generate fiber suspensions and overcomes challenges with alternate approaches, such as issues with light diffusion and polymer loss using photopatterning (21), lengthy multistep protocols for cryosectioning (26), or harsh chemical treatments with aminolysis (27).”
BackgroundMethodHuman platelet lysate-based nanocomposite bioink for bioprinting hierarchical fibrillar structures
Mendes, B. B., Gómez‐Florit, M., Hamilton, A. G., Detamore, M. S., Domingues, R. M. A., Reis, R. L., & Gomes, M. E. (2019) · Biofabrication · doi:10.1088/1758-5090/ab33e8 · Cited by 72 · cited 1×
“Support gel preparation and extrusion bioprinting Agarose support gels were made as previously described (56), with some modifications.”
MethodMechanochemical Adhesion and Plasticity in Multifiber Hydrogel Networks
Davidson, M. D., Ban, E., Schoonen, A. C. M., Lee, M., D'Este, M., Shenoy, V. B., & Burdick, J. A. (2020) · Advanced Materials · doi:10.1002/adma.201905719 · Cited by 71
Self-citationMesenchymal Stem Cells Derived from Human Bone Marrow
Gardner, O. F. W., Alini, M., & Stoddart, M. J. (2015) · Methods in molecular biology · doi:10.1007/978-1-4939-2938-2_3 · Cited by 68 · cited 1×
“Cell isolation and culture Human MSCs were isolated from bone marrow aspirate (Lonza) as previously described (55).”
MethodPatil, V. A., & Masters, K. S. B. (2020) · Bioengineering · doi:10.3390/bioengineering7040163 · Cited by 67 · cited 1×
“In addition, we believe that fibrous assemblies could enable developments in other areas, such as studying cell-ECM interactions (48), fabricating multi-tissue assembloids (49), or facilitating the integration of engineered tissue implants within hosts (50).”
Background3D culture models of tissues under tension
Eyckmans, J., & Chen, C. S. (2016) · Journal of Cell Science · doi:10.1242/jcs.198630 · Cited by 66 · cited 2×
“This bottom-up approach relies on stromal cell ECM contraction and physical interactions with the matrix to form high cell density tissue mimics (3, 45).”
BackgroundKrüger, A. J. D., Bakirman, O., Guerzoni, L. P. B., Jans, A., Gehlen, D. B., Rommel, D., Haraszti, T., Kuehne, A. J. C., & Laporte, L. D. (2019) · Advanced Materials · doi:10.1002/adma.201903668 · Cited by 64 · cited 1×
“10 of 14 structural properties; however, these could likely be further improved with emerging microfabrication methods (51).”
BackgroundKim, T. G., & Park, T. G. (2008) · Macromolecular Rapid Communications · doi:10.1002/marc.200800094 · Cited by 62
Davidson, M. D., Song, K. H., Lee, M., Llewellyn, J., Du, Y. M., Baker, B. M., Wells, R. G., & Burdick, J. A. (2019) · ACS Biomaterials Science & Engineering · doi:10.1021/acsbiomaterials.8b01276 · Cited by 60
Self-citationExtracellular Vesicles in Cardiac Regeneration: Potential Applications for Tissues-on-a-Chip
Wagner, K. T., Nash, T. R., Liu, B., Vunjak‐Novakovic, G., & Radisic, M. (2020) · Trends in biotechnology · doi:10.1016/j.tibtech.2020.08.005 · Cited by 53
Guest–Host Supramolecular Assembly of Injectable Hydrogel Nanofibers for Cell Encapsulation
Miller, B., Hansrisuk, A., Highley, C. B., & Caliari, S. R. (2021) · ACS Biomaterials Science & Engineering · doi:10.1021/acsbiomaterials.1c00275 · Cited by 51
Guiding Cell Network Assembly using Shape‐Morphing Hydrogels
Viola, J. M., Porter, C. M., Gupta, A., Long, M. A., Prahl, L. S., & Hughes, A. J. (2020) · Advanced Materials · doi:10.1002/adma.202002195 · Cited by 50 · cited 2×
“Instabilities created by differential cell contraction are hypothesized to promote tissue bending during development and in engineered tissues (8, 43), and our results suggest that fiber density can influence morphological changes in tissue shape.”
BackgroundSmooth muscle: a stiff sculptor of epithelial shapes
Jaslove, J. M., & Nelson, C. M. (2018) · Philosophical Transactions of the Royal Society B Biological Sciences · doi:10.1098/rstb.2017.0318 · Cited by 49 · cited 2×
“Instabilities created by differential cell contraction are hypothesized to promote tissue bending during development and in engineered tissues (8, 52), and our results suggest that fiber density can influence morphological changes in tissue shape.”
BackgroundWang, M., Cui, C., Ibrahim, M. M., Han, B., Li, Q., Pacifici, M., Lawrence, J. T. R., Han, L., & Han, L. (2019) · Advanced Functional Materials · doi:10.1002/adfm.201808967 · Cited by 46 · cited 2×
“Alternative fiber systems that allow cell encapsulation exist, but they use rigid polymers that cells cannot remodel (17), are composites with extensible fibers embedded in a continuous gel phase that limits fiber recruitment (21), or are on scales that are much larger than single cells (19, 20).”
BackgroundSynthetic Extracellular Matrices as a Toolbox to Tune Stem Cell Secretome
Liu, K., Veenendaal, T., Wiendels, M., Ruiz‐Zapata, A. M., van Laar, J., Kyranas, R., Enting, H., van Cranenbroek, B., Koenen, H. J. P. M., Mihaila, S. M., et al. (2020) · ACS Applied Materials & Interfaces · doi:10.1021/acsami.0c16208 · Cited by 41
Han, L., Tong, X., & Yang, F. (2013) · Advanced Materials · doi:10.1002/adma.201304805 · Cited by 37 · cited 2×
“Last, supracellular scale synthetic fibrous (19) or ribbon-like (20) materials that permit cell encapsulation and approximate the size of large collagen fibers (14) have also been described; however, their large sizes hinder multicellular interactions through the matrix.”
BackgroundBiopolymers: life's mechanical scaffoldsPreprint
Burla, F., Mulla, Y., Vos, B. E., et al. (2018) · arXiv (Cornell University) · doi:10.48550/arxiv.1812.00921 · Cited by 35 · cited 4×
“, covalent versus physical) and the extent to which the assemblies mimic natural ECM fibers (10); however, we have only selected a range of material formulations for this proof-of-concept illustration of the technique and potential utility of the approach.”
BackgroundInfluentialDavidson, C. D., Jayco, D. K. P., Wang, W. Y., Shikanov, A., & Baker, B. M. (2020) · Journal of Biomechanical Engineering · doi:10.1115/1.4048191 · Cited by 17 · cited 1×
“While other nonlinear synthetic material systems have been described (15, 16, 30), these materials fail to capture the micrometer-scale porosities, fiber diameters, lengths, and 3D architectures that we observe with these fibrous hydrogel assemblies.”
Background
Cited by
Zhang, Y. S., Haghiashtiani, G., Hübscher, T., Kelly, D. J., Lee, J. M., Lutolf, M., McAlpine, M. C., Yeong, W. Y., Zenobi-Wong, M., & Malda, J. (2021) · Nature Reviews Methods Primers · doi:10.1038/s43586-021-00073-8 · Cited by 391
Engineered hydrogels for mechanobiology
Blache, U., Ford, E. M., Ha, B., Rijns, L., Chaudhuri, O., Dankers, P. Y. W., Kloxin, A. M., Snedeker, J. G., & Gentleman, E. (2022) · Nature Reviews Methods Primers · doi:10.1038/s43586-022-00179-7 · Cited by 227
Light-based vat-polymerization bioprinting
Levato, R., Dudaryeva, O., Garciamendez-Mijares, C. E., Kirkpatrick, B. E., Rizzo, R., Schimelman, J., Anseth, K. S., Chen, S., Zenobi-Wong, M., & Zhang, Y. S. (2023) · Nature Reviews Methods Primers · doi:10.1038/s43586-023-00231-0 · Cited by 176
Ding, A., Tang, F., & Alsberg, E. (2025) · Chemical Reviews · doi:10.1021/acs.chemrev.4c00070 · Cited by 165
Granular Hydrogels in Biofabrication: Recent Advances and Future Perspectives
Daly, A. C. (2023) · Advanced Healthcare Materials · doi:10.1002/adhm.202301388 · Cited by 153
Metadata
- Authors
- Davidson, M. D., Prendergast, M. E., Ban, E., Xu, K. L., Mickel, G., Mensah, P., Dhand, A., Janmey, P. A., Shenoy, V. B., & Burdick, J. A.
- Affiliations
- University of Pennsylvania (US)
- Corresponding author
- Burdick, Jason A.
- ORCID
- Venue
- Science Advances
- Published
- 2021-11-12
- Volume
- 7
- Issue
- 46
- Pages
- eabi8157-eabi8157
- ISSN
- 2375-2548 (ISSN-L)
- PMC
- PMC8580309
- OpenAlex
- W3212440101
- Cited by
- 101
- References
- 76
- Citations by year
- 2026: 15 · 2025: 23 · 2024: 25 · 2023: 22 · 2022: 11 · 2021: 4
- FWCI
- 4.92
- Type
- journal article
- Language
- en
- Open access
- gold
- doi.org
- Licence
- cc-by-nc
- Locations
- Science Advances (publishedVersion, cc-by-nc)
- bioRxiv (Cold Spring Harbor Laboratory) (acceptedVersion)
- PubMed Central (publishedVersion, cc-by-nc)
- PubMed (publishedVersion)
- Funders
- National Science Foundation (1720530, CMMI: 15‐48571, 1548571)
- University of Pennsylvania (1720530, DMR- 1720530)
- National Institutes of Health
- Materials Research Science and Engineering Center, Harvard University (DMR‐1720530, 1720530)
- National Institute of Diabetes and Digestive and Kidney Diseases (F32DK117568)
- National Institute of Arthritis and Musculoskeletal and Skin Diseases (R01AR056624)
- Division of Materials Research (DMR17-20530, 17-20530)
- Division of Civil, Mechanical and Manufacturing Innovation (CMMI 1548571, 15–48571, DMR-1720530)
- Topics
- Physical Sciences › Materials Science › Biomaterials › Hydrogels: synthesis, properties, applications
- Physical Sciences › Engineering › Biomedical Engineering › 3D Printing in Biomedical Research
- Life Sciences › Biochemistry, Genetics and Molecular Biology › Cell Biology › Cellular Mechanics and Interactions
- Keywords
- fibrous hydrogels, cell encapsulation, cell contraction, extracellular matrix mimicry, strain stiffening, fiber alignment, mesenchymal stem cells, photocrosslinking, self-healing hydrogels, shear thinning, extrusion-based bioprinting, photopatterning, microtissues, biofabrication, tissue engineering
About these checks
Registry, retraction, Cites and statistics results are computed, not judged, with one exception: a printed reference that no index lists is read once by a model before it counts as a citation error. Claims are extracted by a model and kept only when their quote appears verbatim in the text; each cited source is then checked, with a model’s help, for whether it says what the claim relies on. Those verdicts can be wrong — read the claim’s quote and the cited source before relying on one.
Statistics and arithmetic are recomputed, not judged.
Confidence bands are shown only for fields calibrated on our annotated test set. None is calibrated yet, so no band is shown.
What counts as a claim ›How we measure confidence ›How we check this ›
Are you an author, or do you see a problem with this page? Request a review
Data sources
Bibliographic data: Semantic Scholar, OpenAlex, Crossref.
Contains information from the Semantic Scholar Academic Graph Datasets, made available under the ODC Attribution License (ODC-BY 1.0).
Semantic Scholar’s data is described in: Kinney, R., et al. (2023). The Semantic Scholar Open Data Platform. arXiv:2301.10140.
