

A fully hardware-based memristive multilayer neural network
Open accessThe DOI matches its Crossref record; 49 of the 49 references it cites were found in a registry or an index.
Abstract
A fully hardware-based memristive neural network is capable of delivering high computing throughput and power efficiency.
Overview
The claims and statistics of this paper haven’t been checked yet.
Free: it reads the open-access text and checks the first 5 claims that cite a source we can check. Create a free account to check every claim.
Integrity signals
Registry
Cites
Statistics
Figures


Verification
Claims the paper makes
The claims and statistics of this paper haven’t been checked yet.
Free: it reads the open-access text and checks the first 5 claims that cite a source we can check. Create a free account to check every claim.
Claims other papers make about this one
Each is checked against this paper’s own text: does it say what the citing paper says it does?
The source backs part of the claim, not all of it — or backs it for a different population, condition or comparison.
In the citing paper
“Some groups prefer to incorporate a transistor in series to each MIM cell to obtain a better control over the currents through the device (i.e., improve conductance controllability and minimize sneak path currents)53–55,60,61,102,113,167,194,218–222,).”
From Hardware implementation of memristor-based artificial neural networks (2024) · cites this paper as [102]
Experimental — accuracy not yet measuredThe source backs part of the claim, not all of it — or backs it for a different population, condition or comparison.
In the citing paper
“The most common approach in this contest is the use of an Off-the-shelf, external DAC to drive the analogue inputs54,55,102,222, which are integrated with the rest of the circuit (i.e. the memristor crossbar) in printed circuit boards.”
From Hardware implementation of memristor-based artificial neural networks (2024) · cites this paper as [102]
Experimental — accuracy not yet measuredThe cited source says what the claim attributes to it.
In the citing paper
“Even though such designs cannot be reconfigured when fabricated, this weakness is compensated by a much reduced power consumption (estimated in ref. 102 for a 65 nm CMOS node to be roughly 30 times lower).”
From Hardware implementation of memristor-based artificial neural networks (2024) · cites this paper as [102]
Self-check
Percentages, sums and reported differences re-computed from the paper’s own numbers.
The self-check needs the paper’s full text.
Citations
Cites
1 retracted
Notice of Retraction: Perceptron Linear Activation Function Design with CMOS-Memristive Circuits
Nursultan, B., & Krestinskaya, O. (2018) · International Conference on Computing and Network Communications · doi:10.1109/coconet.2018.8476812 · Cited by 1 · cited 1×
“Nevertheless, compared with the prior art ( 22 , 23 ), our hardware ReLU is stable for both positive and negative values of input current.”
RetractedAdam: A Method for Stochastic Optimization
Kingma, D. P., & Ba, J. (2014) · arXiv · doi:10.48550/arxiv.1412.6980 · Cited by 98,946
Gradient-based learning applied to document recognition
Lecun, Y., Bottou, L., Bengio, Y., & Haffner, P. (1998) · Proceedings of the IEEE · doi:10.1109/5.726791 · Cited by 58,805 · cited 2×
“To calculate the required amount of weight updating, we used the root mean square propagation (RMSProp) optimizer because of its faster convergence over the stochastic gradient descent (SGD) ( 24 , 32 , 37 – 43 ).”
InfluentialLearning representations by back-propagating errors
Rumelhart, D. E., Hinton, G. E., & Williams, R. J. (1986) · Nature · doi:10.1038/323533a0 · Cited by 31,892 · cited 1×
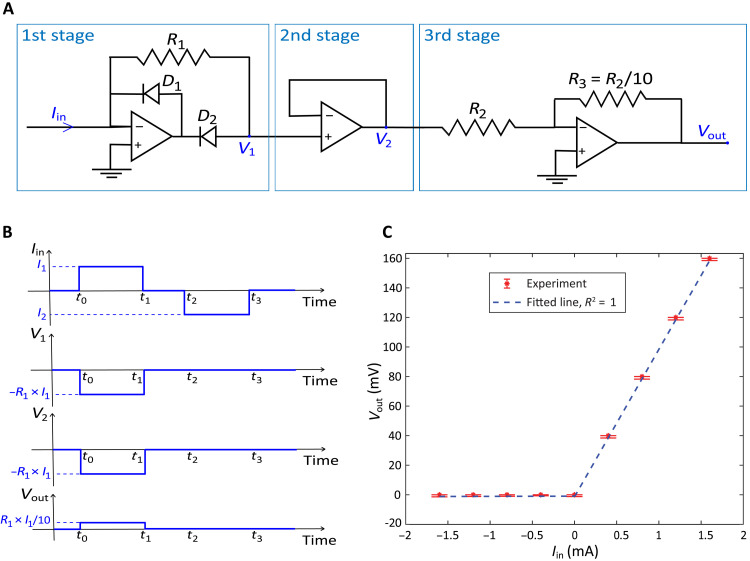
“To backpropagate the errors from the output to the input ( 33 , 34 ), we used cross-entropy ) is duplicated to the output of the second stage ( V 2 ) using the voltage follower and then inverted and scaled in the last stage ( V out ) by multiplying with − R 3 / R 2 (−0.1 in this design).”
InfluentialDraper, N. R., & Smith, H. (1998) · Wiley Series in Probability and Statistics · doi:10.1002/9781118625590 · Cited by 5,024
An overview of gradient descent optimization algorithms
Ruder, S. (2016) · arXiv · doi:10.48550/arxiv.1609.04747 · Cited by 4,962 · cited 1×
“To calculate the required amount of weight updating, we used the root mean square propagation (RMSProp) optimizer because of its faster convergence over the stochastic gradient descent (SGD) ( 24 , 32 , 37 – 43 ).”
Fully hardware-implemented memristor convolutional neural network
Yao, P., Wu, H., Gao, B., Tang, J., Zhang, Q., Zhang, W., Yang, J. J., & Qian, H. (2020) · Nature · doi:10.1038/s41586-020-1942-4 · Cited by 2,179 · cited 2×
“The VMM is achieved by analog computing using physical laws, such as Ohm’s law for multiplications and Kirchhoff’s current law for sum-mations ( 5 – 7 , 17 ) While the analog multilevel resistance of a memristive device has been successfully used as the synaptic weights in a neural network, most…”
Self-citationThe future of electronics based on memristive systems
Zidan, M. A., Strachan, J. P., & Lu, W. D. (2018) · Nature Electronics · doi:10.1038/s41928-017-0006-8 · Cited by 2,138
Analogue signal and image processing with large memristor crossbars
Li, C., Hu, M., Li, Y., Jiang, H., Ge, N., Montgomery, E., Zhang, J., Song, W., Dávila, N., Graves, C. E., et al. (2017) · Nature Electronics · doi:10.1038/s41928-017-0002-z · Cited by 1,292
Self-citationUltrafast machine vision with 2D material neural network image sensors
Mennel, L., Symonowicz, J., Wachter, S., Polyushkin, D. K., Molina-Mendoza, A. J., & Mueller, T. (2020) · Nature · doi:10.1038/s41586-020-2038-x · Cited by 1,167
Research works printed but not linked: 8
- B. Razavi Fundamentals of Microelectronics (Wiley 2013).
- R. G. D. Steel J. H. Torrie Principles and Procedures of Statistics (McGraw-Hill Book Company 1960).
- I. Goodfellow Y. Bengio A. Courville Y. Bengio Deep Learning (The MIT Press 2016).
- Y. LeCun D. Touresky G. Hinton T. Sejnowski A theoretical framework for back-propagation in Proceedings of the 1988 Connectionist Models Summer School (1988) vol. 1 pp. 21–28.
- C. Igel M. Hüsken Improving the Rprop learning algorithm in Proceedings of the Second International ICSC Symposium on Neural Computation (ICSC Academic Press 2000) vol. 2000 pp. 115–121.
- R. V. K. OReddy B. S. Rao K. P. Raju Handwritten hindi digits recognition using convolutional neural network with rmsprop optimization in Second International Conference on Intelligent Computing and Control Systems (ICICCS) (IEEE 2018) pp. 45–51.
- T. Tieleman, G. Hinton, Lecture 6.5-rmsprop: Divide the gradient by a running average of its recent magnitude. COURSERA: Neural networks for machine learning 4, 26–31 (2012).
- H. Hung V. Adzic Monte carlo simulation of device variations and mismatch in analog intregrated circuits in Proceedings of the National Conference on Undergraduate Research (NCUR) (2006) pp. 1–8.
Cited by
Hardware implementation of memristor-based artificial neural networks
Aguirre, F., Sebastian, A., Le Gallo, M., Song, W., Wang, T., Yang, J. J., Lu, W., Chang, M.-F., Ielmini, D., Yang, Y., et al. (2024) · Nature Communications · doi:10.1038/s41467-024-45670-9 · Cited by 564
“This scheme is used in various papers 54,102 .”
Self-citationFerroelectric-defined reconfigurable homojunctions for in-memory sensing and computing
Wu, G., Zhang, X., Feng, G., Wang, J., Zhou, K., Zeng, J., Dong, D., Zhu, F., Yang, C., Zhao, X., et al. (2023) · Nature Materials · doi:10.1038/s41563-023-01676-0 · Cited by 294
“11).”
Memristor-based hardware accelerators for artificial intelligence
Huang, Y., Ando, T., Sebastian, A., Chang, M., Yang, J. J., & Xia, Q. (2024) · Nature Reviews Electrical Engineering · doi:10.1038/s44287-024-00037-6 · Cited by 192
“In the early research of memristor-based hardware accelerators, off-chip peripherals are primarily used to programme the memristive devices to target conductance values, and selecting and writing circuits are designed to interface with off-chip training platforms 37,56,82,83 .”
Self-citationRoadmap to neuromorphic computing with emerging technologies
Mehonić, A., Ielmini, D., Roy, K., Mutlu, O., Kvatinsky, S., Serrano‐Gotarredona, T., Linares-Barranco, B., Spiga, S., Savel'ev, S. E., Balanov, A. G., et al. (2024) · APL Materials · doi:10.1063/5.0179424 · Cited by 199
Self-citationSelf‐Rectifying Memristors for Three‐Dimensional In‐Memory Computing
Ren, S., Dong, A., Yang, L., Xue, Y., Li, J., Yu, Y., Zhou, H., Zuo, W., Li, Y., Cheng, W., et al. (2024) · Advanced Materials · doi:10.1002/adma.202307218 · Cited by 96
Two-Dimensional Materials for Brain-Inspired Computing Hardware
Hadke, S. S., Kang, M., Sangwan, V. K., & Hersam, M. C. (2025) · Chemical Reviews · doi:10.1021/acs.chemrev.4c00631 · Cited by 112
Ji, X., Dong, Z., Han, Y., Lai, C. S., Zhou, G., & Qi, D. (2023) · IEEE Transactions on Consumer Electronics · doi:10.1109/tce.2023.3263672 · Cited by 97
“A fully hardware-based memristive multilayer neural network demonstrated a recognition accuracy of 93.63% on a handwritten digit dataset [17].”
BackgroundMethodInfluentialAn ultrafast bipolar flash memory for self-activated in-memory computing
Huang, X., Liu, C., Tang, Z., Zeng, S., Wang, S., & Zhou, P. (2023) · Nature Nanotechnology · doi:10.1038/s41565-023-01339-w · Cited by 107
“Although analogue circuits 16,17 , vanadium dioxide 18 and ADC 19 have been used to directly accelerate the activation process, the activation power still requires a large proportion of in-memory computing.”
MethodA memristive deep belief neural network based on silicon synapses
Wang, W., Danial, L., Li, Y., Herbelin, E., Pikhay, E., Roizin, Y., Hoffer, B., Wang, Z., & Kvatinsky, S. (2022) · Nature Electronics · doi:10.1038/s41928-022-00878-9 · Cited by 66
Self-citationKim, S., Park, J., Kim, T., Hong, K., Hwang, Y., Park, B., & Kim, H. (2022) · Advanced Intelligent Systems · doi:10.1002/aisy.202100273 · Cited by 65
Byun, K., Choi, I., Kwon, S., Kim, Y., Kang, D., Cho, Y. W., Yoon, S. K., & Kim, S. (2022) · Advanced Materials Technologies · doi:10.1002/admt.202200884 · Cited by 68
Park, J., Kim, S., Song, M. S., Youn, S., Kim, K., Kim, T.-H., & Kim, H. (2024) · ACS Applied Materials & Interfaces · doi:10.1021/acsami.3c13775 · Cited by 56
Chen, Z., Lin, Z., Yang, J., Chen, C., Liu, D., Shan, L., Hu, Y., Guo, T., & Chen, H. (2024) · Nature Communications · doi:10.1038/s41467-024-46246-3 · Cited by 67
Self-citationDong, Z., Ji, X., Lai, C. S., & Qi, D. (2022) · IEEE Communications Magazine · doi:10.1109/mcom.001.2200272 · Cited by 53
“Gradient calculation: the obtained errors are applied into the gradient calculation circuit [11], the desired weights can be obtained immediately.”
BackgroundMethodInfluentialA Bio‐Inspired Neuromorphic Sensory System
Wang, T., Wang, X., Wen, J., Shao, Z.-Y., Huang, H.-M., & Guo, X. (2022) · Advanced Intelligent Systems · doi:10.1002/aisy.202200047 · Cited by 56
Recent Progress in Neuromorphic Computing from Memristive Devices to Neuromorphic Chips
Xiao, Y., Gao, C., Jin, J., Sun, W., Wang, B., Bao, Y., Liu, C., Huang, W., Zeng, H., & Yu, Y. (2024) · Advanced Devices & Instrumentation · doi:10.34133/adi.0044 · Cited by 68
Review of Memristors for In‐Memory Computing and Spiking Neural Networks
Shooshtari, M., Serrano‐Gotarredona, T., & Linares‐Barranco, B. (2025) · Advanced Intelligent Systems · doi:10.1002/aisy.202500806 · Cited by 74
Kumar, A., Bhardwaj, K., Singh, S. P., Lee, Y., Lee, S., Kumar, M., & Sharma, S. K. (2024) · InfoMat · doi:10.1002/inf2.12644 · Cited by 41
From memristive devices to neuromorphic systems
Huang, Y., Kiani, F., Ye, F., & Xia, Q. (2023) · Applied Physics Letters · doi:10.1063/5.0133044 · Cited by 37
Self-citationGradient-Based Neuromorphic Learning on Dynamical RRAM Arrays
Zhou, P., Choi, D.-U., Lu, W. D., Kang, S.-M. S., & Eshraghian, J. K. (2022) · IEEE Journal on Emerging and Selected Topics in Circuits and Systems · doi:10.1109/jetcas.2022.3224071 · Cited by 39
Cao, T., Liu, C., Wang, W., Zhang, T., Lee, H. K., Li, M. H., Song, W., Chen, Z. X., Zhuo, V. Y.-Q., Wang, N., et al. (2022) · IEEE Journal on Emerging and Selected Topics in Circuits and Systems · doi:10.1109/jetcas.2022.3214334 · Cited by 34
“Recently, with the recent advancements in device fabrication and novel device write-verify techniques, multi-level analog memristor crossbar arrays with resolution up to 8-bit have been demonstrated [16], [17], [18].”
BackgroundPark, S.-O., Park, T., Jeong, H., Hong, S., Seo, S., Kwon, Y., Lee, J., & Choi, S. (2023) · Nanoscale Horizons · doi:10.1039/d3nh00121k · Cited by 31
Synapse-Mimetic Hardware-Implemented Resistive Random-Access Memory for Artificial Neural Network
Seok, H., Son, S., Jathar, S. B., Lee, J., & Kim, T. (2023) · Sensors · doi:10.3390/s23063118 · Cited by 31
Fang, Y., Li, Q., Meng, J., Wang, T., Zhu, H., Sun, Q., Zhang, D. W., & Chen, L. (2023) · Advanced Electronic Materials · doi:10.1002/aelm.202300120 · Cited by 27
Aussen, S., Cüppers, F., Funck, C., Jo, J., Werner, S., Pratsch, C., Menzel, S., Dittmann, R., Dunin‐Borkowski, R. E., Waser, R. M., et al. (2023) · Advanced Electronic Materials · doi:10.1002/aelm.202300520 · Cited by 25
Yang, J., Mao, R., Jiang, M., Cheng, Y., Sun, P.-S. V., Dong, S., Pedretti, G., Sheng, X., Ignowski, J., Li, H., et al. (2025) · Nature Communications · doi:10.1038/s41467-025-56254-6 · Cited by 38
Self-citationRadiofrequency signal processing with a memristive system-on-a-chip
Huang, Y., He, C., Ling, Y., Ge, N., Yang, J. J., Hu, M., Katehi, L. P. B., & Xia, Q. (2025) · Nature Electronics · doi:10.1038/s41928-025-01409-y · Cited by 33
“In addition, activation functions between layers of neural networks, implemented in on-chip digital circuits herein, may be replaced by analogue alternatives, such as an analogue sigmoid function 39 and rectified linear unit (ReLU) circuits 40,41 , for fully analogue inference.”
Self-citationMemristive Circuit Implementation of Caenorhabditis Elegans Mechanism for Neuromorphic Computing
Chen, H., Hong, Q., Wang, Z., Wang, C., Zeng, X., & Zhang, J. (2023) · IEEE Transactions on Neural Networks and Learning Systems · doi:10.1109/tnnls.2023.3250655 · Cited by 22
“To validate the robustness of bionic circuit design, we have modeled the variability and nonidentities of transistors, resistors, and memristors [48], aiming to examine their impact on mimicking the locomotion of C. elegans.”
MethodSelf-citationSilicon–van der Waals heterointegration for CMOS-compatible logic-in-memory design
Lee, M., Gao, C., Tsai, M., Lin, C.-Y., Yang, F., Sung, H., Zhang, C., Li, W., Li, J., Zhang, J., et al. (2023) · Science Advances · doi:10.1126/sciadv.adk1597 · Cited by 22
“For instance, current analog in-memory computing systems often use Si-based digital computers/converters to complete the vector-matrix multiplication accelerator ( 13 – 15 ).”
BackgroundJointed pendulums driven by a neural circuit, electromechanical arm model approach
Guo, Y., Wang, C., & Ma, J. (2024) · Chaos Solitons & Fractals · doi:10.1016/j.chaos.2024.115739 · Cited by 19
Current opinions on memristor-accelerated machine learning hardware
Jiang, M., Xu, Y., Li, Z., & Li, C. (2025) · Current Opinion in Solid State and Materials Science · doi:10.1016/j.cossms.2025.101226 · Cited by 28
Park, T. W., Moon, J., Shin, D. H., Kim, H. J., Kim, S. S., Cho, J. M., Park, H., Woo, K. S., Kim, D. Y., Cheong, S., et al. (2024) · ACS Applied Materials & Interfaces · doi:10.1021/acsami.4c15598 · Cited by 18
Noh, K., Kwak, H., Son, J., Kim, S., Um, M., Kang, M., Kim, D., Ji, W., Lee, J.-Y., Jo, H., et al. (2024) · Science Advances · doi:10.1126/sciadv.adl3350 · Cited by 15
“There have been active research efforts to prove the concept and performance of analog architectures using novel NVM devices such as resistive random-access memory, phase-change random-access memory, ferroelectric random-access memory, and magnetic random-access memory ( 22 – 29 ).”
BackgroundMERRC: A Memristor-Enabled Reconfigurable Low-Power Reservoir Computing Architecture at the Edge
Nowshin, F., Huang, Y., Sarkar, M. R., Xia, Q., & Yi, Y. (2024) · IEEE Transactions on Circuits and Systems I: Regular Papers · doi:10.1109/tcsi.2023.3329337 · Cited by 12
“The top electrode which is 20-nm Ta and 20-nm Pt was patterned by photolithography, deposited by DC sputtering, and then lifted off in acetone at room temperature [67].”
MethodSelf-citation11-bit two-dimensional floating-gate memories
Wang, Y., Cai, Y., Wang, F., Yan, T., Li, S., Cao, M.-Y., Hong, R., Zhai, B., Xu, K., Zhan, X., et al. (2025) · Nature Communications · doi:10.1038/s41467-025-64333-x · Cited by 21
Self-citationMemcapacitors in neuromorphic architectures: the mechanisms, challenges, and applications
Chen, K., Shih, L., Chen, Y.-C., Lin, K., & Chen, J. (2025) · Journal of Materials Chemistry C · doi:10.1039/d5tc00993f · Cited by 16
Cao, T., Yu, W., Gao, Y., Liu, C., Yan, S., & Goh, W. L. (2023) · IEEE International Symposium on Circuits and Systems proceedings · doi:10.1109/iscas46773.2023.10181612 · Cited by 13
“Therefore, resistive crossbar array-based processing-in-memory (PIM) architecture is an elegant solution to enhance both computation speed and energy efficiency by several orders compared to conventional memory [17-18].”
BackgroundDual in-memory computing of matrix-vector multiplication for accelerating neural networks
Wang, S., & Sun, Z. (2024) · Device · doi:10.1016/j.device.2024.100546 · Cited by 11
Lab-on-device investigation of phase transition in MoOx semiconductors
Liang, X., Su, D., Tang, Y., Xi, B., Yang, C., Xiu, H., Wang, J., Liu, C., Wang, M., & Chai, Y. (2025) · Nature Communications · doi:10.1038/s41467-025-60050-7 · Cited by 14
“Conventional hardware-implementation of neural networks have often relied on separately fabricated devices to simulate synapses and neurons 50,51 .”
Continuous-time digital twin with analog memristive neural ordinary differential equation solver
Chen, H., Yang, J., Chen, J., Wang, S., Wang, S., Wang, D., Tian, X., Yu, Y., Chen, X., Lin, Y., et al. (2025) · Science Advances · doi:10.1126/sciadv.adr7571 · Cited by 17
Self-citationError-aware probabilistic training for memristive neural networks
Liu, J., Lü, J., Tang, S., Zhou, R., Ma, H., Lyu, B., Tian, Y., Shi, T., & Liu, Q. (2025) · Nature Communications · doi:10.1038/s41467-025-66240-7 · Cited by 17
Liu, Z., Fang, Y., Liu, Q., Tian, B., & Zhao, C. (2026) · Nano-Micro Letters · doi:10.1007/s40820-025-02028-0 · Cited by 19
“Against this backdrop, the advance of intelligent and energy-efficient edge computing relies on synaptic arrays and integrated systems that offer scalable uniformity, multifunctional adaptability, and seamless links between sensing, computation, and action [168, 169].”
Neuromorphic memristor based on amorphous InAlZnO film for synaptic behavior simulation
Xu, Y., Han, X., Xu, W.-D., Ye, C., Dai, Z.-Y., Feng, X.-J., & Qian, K. (2023) · Applied Physics Letters · doi:10.1063/5.0180651 · Cited by 7
Ko, J., Im, J., Kim, J., Shin, W., Koo, R., Park, S., Woo, S. Y., & Lee, J. (2025) · Science Advances · doi:10.1126/sciadv.adt8227 · Cited by 9
“1A) has gained considerable attention ( 11 – 15 ).”
Towards Energy-Efficient Computing Hardware Based on Memristive Nanodevices
Huang, Y., Ravichandran, V., Zhao, W., & Xia, Q. (2023) · IEEE Nanotechnology Magazine · doi:10.1109/mnano.2023.3297106 · Cited by 9
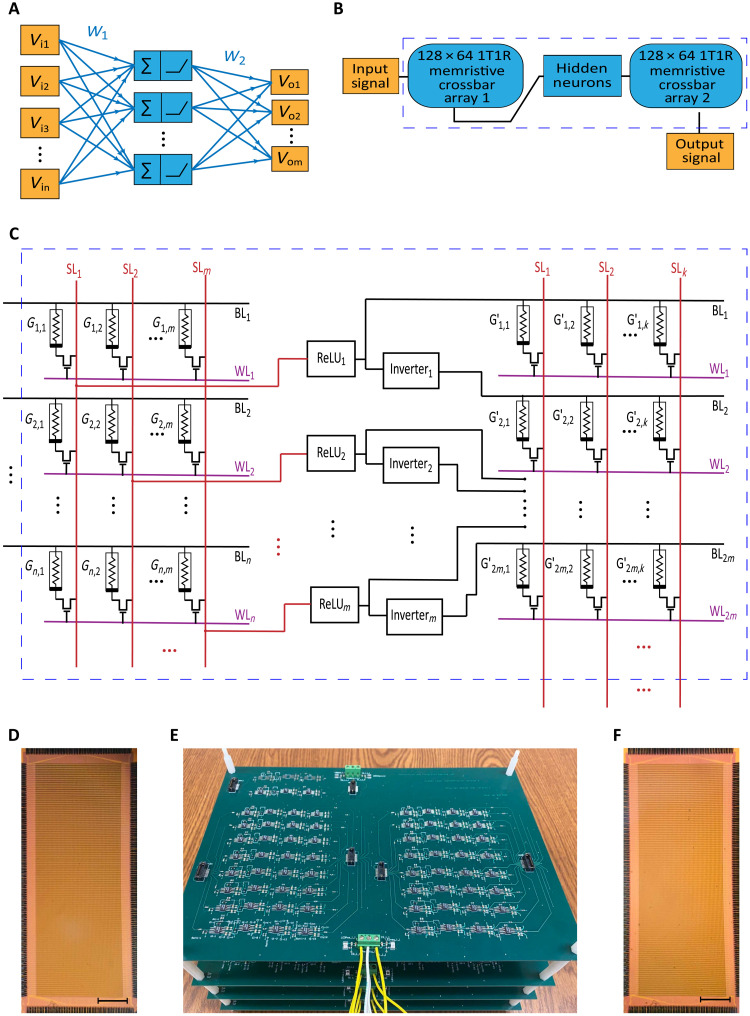
“…network consists of two 1T1R crossbar arrays (left and right) and fully analog hardware neuron circuits made of off-the-shelf-electronics (middle) [36]. neural networks in analog hardware, they verified the potential of fully analog neural networks and their contributions to the computing…”
BackgroundMethodSelf-citationFu, T., Fu, S., Wang, S., & Yao, J. (2024) · Device · doi:10.1016/j.device.2024.100329 · Cited by 11
Quantum nickelate platform for future multidisciplinary research
Zhang, Z., Sun, Y., & Zhang, H. (2022) · Journal of Applied Physics · doi:10.1063/5.0084784 · Cited by 8
Biomimetic Neuromorphic Sensory System via Electrolyte Gated Transistors
Li, S., Gao, L., Liu, C., Guo, H., & Yu, J. (2024) · Sensors · doi:10.3390/s24154915 · Cited by 10
“The artificial neural network emulates the functionality of a biological neural network, processing and analyzing signals to develop artificial perception and cognitive abilities, thereby creating a hardware-based artificial intelligence system [74,75].”
BackgroundKang, M., Cho, U., Kang, J., Han, N., Seo, H. J., Yang, J., Shin, S., Kim, T., Kim, S., Jeong, C., et al. (2024) · Advanced Electronic Materials · doi:10.1002/aelm.202300900 · Cited by 7
Self-citationBackpropagating Errors Through Memristive Spiking Neural Networks
Zhou, P., Choi, D.-U., Kang, S., & Eshraghian, J. K. (2023) · IEEE International Symposium on Circuits and Systems proceedings · doi:10.1109/iscas46773.2023.10182006 · Cited by 8
“The work presented in [24] uses analog ReLU activations with memristive synapses to achieve 93.63 % testing accuracy on the MNIST dataset.”
MethodInfluentialExplainable Learning-Based Intrusion Detection Supported by Memristors
Chen, J., Zhang, L., Riem, J., et al. (2023) · IEEE Conference on Artificial Intelligence (CAI) · doi:10.1109/cai54212.2023.00092 · Cited by 6
“Memristors (also known as resistive switches or ReRAM) are novel, two-terminal memory devices that are ultra-scalable to a few nanometers and can have their internal state programmed in an analog fashion and retained in an energy-efficient manner, similar to an artificial synapse [6], [7].”
BackgroundPan, X., Luo, W., Shuai, Y., Hu, S. G., Luo, W., Qiao, G., Zhou, T. H., Wang, J., Xie, Q., Huang, S., et al. (2023) · IEEE Sensors Journal · doi:10.1109/jsen.2023.3248123 · Cited by 6
“Also, memristor crossbar device exhibits high degrees of computing parallelism, especially in N × ( N × M ) vector–matrix multiplication, which is fundamental for neural network computing [5], [6], [9].”
BackgroundUltrahigh-precision analog computing using memory-switching geometric ratio of transistors
Yangdong, X.-J., Wang, C., Zhao, Y., Wang, Z.-C., Yang, Z., Liu, Z., Yu, W., Zeng, Z., Wang, S., Wei, W., et al. (2025) · Science Advances · doi:10.1126/sciadv.ady4798 · Cited by 6
Self-citationSurvey of Security Issues in Memristor-Based Machine Learning Accelerators for RF Analysis
Lillis, W., Hoffing, M. C., & Burleson, W. P. (2024) · Chips · doi:10.3390/chips3020009 · Cited by 5
2D Materials for Neuron Devices and Neuromorphic Computing
Ye, C., Liu, Y., Zeng, T., Shen, D., Wu, G., & Wang, J. (2026) · Small · doi:10.1002/smll.202506454 · Cited by 4
Lim, K., Go, S., Tan, C., Jiang, Y., Cai, K., Chong, T., Elliott, S. R., Lee, T. H., & Loke, D. K. (2024) · Advanced Physics Research · doi:10.1002/apxr.202300085 · Cited by 4
Difficulties and approaches in enabling learning-in-memory using crossbar arrays of memristors
Wang, W. J., Li, Y., & Wang, M. (2024) · Neuromorphic Computing and Engineering · doi:10.1088/2634-4386/ad6732 · Cited by 6
“For instance, Kiani et al reports a fully hardware-based memristive multilayer neural network with the ReLU activation function is implemented by analog circuits [34].”
Ta/HfO2 memristors: from device physics to neural networks
Jiang, H., Li, C., & Xia, Q. (2022) · Japanese Journal of Applied Physics · doi:10.35848/1347-4065/ac665d · Cited by 4
Self-citationEnergy-Efficient Brain Floating Point Convolutional Neural Network Using Memristors
Tong, S.-Q., Bao, H., Li, J.-C., Yang, L., Zhou, H.-J., Li, Y., & Miao, X.-S. (2024) · IEEE Transactions on Electron Devices · doi:10.1109/ted.2024.3379953 · Cited by 3
“Designing and deploying larger-scale networks has become an important topic in the field of deep learning [35], [36].”
BackgroundCommunication-aware in-memory wireless neural networks
Yang, Z.-Z., Wang, C., Zhao, Y., Ruan, G.-J., Yangdong, X.-J., Yang, Y., Pan, C., Cheng, B., Liang, S.-J., & Miao, F. (2026) · Nature Electronics · doi:10.1038/s41928-026-01577-5 · Cited by 5
Kim, J. G., Liu, R., Dhakal, P., Hou, A., Gao, C., Qiu, J., Merkel, C. E., Zoran, M. J., & Wang, S. (2024) · Matter · doi:10.1016/j.matt.2024.01.008 · Cited by 4
Li, Y., Xu, K., Ma, Y., Li, J., Luo, Y., Li, X., Shen, P., Zhao, L., Liu, H., Ren, L., et al. (2025) · Advanced Materials · doi:10.1002/adma.202420218 · Cited by 4
Bipolar flash for bifunctional computing operations
Kiani, F., & Xia, Q. (2023) · Nature Nanotechnology · doi:10.1038/s41565-023-01358-7 · Cited by 3
Self-citationKawano, C., & Hashimoto, M. (2023) · IEEE International Conference on Rebooting Computing (ICRC) · doi:10.1109/icrc60800.2023.10386352 · Cited by 3
“Actual hardware implementations are also demonstrated, for example, in [3], [6].”
BackgroundStability analysis of stochastic Lyapunov functions: Applications to memristor neural networks
Rahimi, V., & Ahmadian, D. (2025) · Mathematical Methods in the Applied Sciences · doi:10.1002/mma.10574 · Cited by 2
“This includes research on memristor-based object detection using neural networks [12, 13], as well as multilayer neural networks based on mem-ristors with online gradient descent training [10, 14].”
Jin, Y., Xu, X., Gao, Y., & Liu, S. (2025) · Solid-State Electronics · doi:10.1016/j.sse.2025.109129 · Cited by 2
PySpice-Simulated In Situ Learning with Memristor Emulation for Single-Layer Spiking Neural Networks
Jurj, S. L. (2024) · Electronics · doi:10.3390/electronics13234665 · Cited by 3
Enhanced Resistive Switching in Dopant-Free BFO Devices via TiO 2 Insertion
Yousuf, S. Z., Mamilla, S., & Murty, N. V. L. N. (2025) · IEEE Transactions on Materials for Electron Devices · doi:10.1109/tmat.2025.3552354 · Cited by 2
“R ESISTIVE random-access memory (RRAM) devices, leveraging redox-based mechanisms and bipolar switching hold promise, particularly when fabricated from material stacks compatible with CMOS technology [1], [2], [3], [4].”
Memristive Based In-Memory Computing Using Novel RISC-V Architectures
Mallios, K.-A., Tompris, I., Passias, A., Fyrigos, I.-A., & Sirakoulis, G. C. (2024) · Panhellenic Conference on Electronics & Telecommunications (PACET) · doi:10.1109/pacet60398.2024.10497068 · Cited by 2
“…CMOS-compatible fabrication, exhibit substantial integration density [8], [9], even when used in a 1T1R configuration, which is employed in this design, and also demonstrate remarkable energy efficiency by enabling analog-domain computations through exclusive reliance on Kirchhoff’s Law [10], [11].”
MethodYang, J., Chen, H., Chen, J., et al. (2024) · Technical digest - International Electron Devices Meeting/Technical digest · doi:10.1109/iedm50854.2024.10873487 · Cited by 1
Self-citationCircuit design of in-situ training memristive backpropagation neural network
Yang, L., Cheng, M., & Su, T. (2025) · AEU - International Journal of Electronics and Communications · doi:10.1016/j.aeue.2025.155919 · Cited by 1
Dudkin, A. P., Ryndin, E. A., & Andreeva, N. V. (2025) · Russian Microelectronics · doi:10.1134/s106373972560044x · Cited by 2
Chen, L., He, W. T., Xi, G., et al. (2025) · Chemical Engineering Journal · doi:10.1016/j.cej.2025.170840 · Cited by 1
Pandit, N., Mandal, R., Pal, A., Mandal, A., Nath, R., & Mukherjee, B. (2025) · Organic Electronics · doi:10.1016/j.orgel.2025.107364 · Cited by 1
Stretchable neuromorphic electronics for future human-integrated intelligence
Fu, T., Yang, R., Weires, M., Yin, J., Liao, Y., & Guo, Y. (2026) · International Journal of Extreme Manufacturing · doi:10.1088/2631-7990/ae5004 · Cited by 4
“…a digital-to-analog convertor (DAC) to deliver precise programming voltages to the device and an op-amp-based transimpedance amplifier plus an analog-to-digital convertor (ADC) to digitize current outputs [63,159,160] —blocks that are power-hungry and footprint-dominated, ill-suited for wear-ables.”
Self-citationFerroelectric Devices for In‐Memory and In‐Sensor Computing
Fang, H., Xie, R., Cao, Q., Yan, S., Wang, X. L., & Zheng, L. (2026) · Advanced Science · doi:10.1002/advs.202600007 · Cited by 2
“Furthermore, the ferroelectric synaptic devices can be arranged in a cross array to construct a complete hardware neural network (Figure 2c ) [ 82, 84 ].”
Printed 1T1R Arrays for Next-Generation Electronics
Martins, R. A., Hu, H., Pereira, M., Marques, G. C., Kiazadeh, A., Aghassi‐Hagmann, J., & Carlos, E. (2026) · ACS Applied Electronic Materials · doi:10.1021/acsaelm.6c00778 · Cited by 1
Efficient training of neuromorphic electronics
Yang, S., Tang, J., Zhou, T., Linares-Barranco, B., Indiveri, G., Zheng, X., Azghadi, M. R., & Chen, B. (2026) · Nature Electronics · doi:10.1038/s41928-026-01631-2 · Cited by 2
Straightforward data transfer in a blockwise dataflow for an analog RRAM-based CIM system
Liu, Y., Gao, B., Yao, P., Liu, Q., Zhang, Q., Wu, D. M., Tang, J., Qian, H., & Wu, H. (2023) · Frontiers in Electronics · doi:10.3389/felec.2023.1129675 · Cited by 1
“However, the proposed components in Bayat et al. (2018), Kiani et al. (2021), and Zhou et al. (2021) cannot buffer intermediate data.”
BackgroundMethodDevices and Architectures for Efficient Computing In-Memory (CIM) Design
Bengel, C., Gebregiorgis, A., Menzel, S., Waser, R. M., Gaydadjiev, G. N., & Hamdioui, S. (2023) · Lecture notes in computer science · doi:10.1007/978-3-031-46077-7_29 · Cited by 1
Redox-Based Bi-Layer Metal Oxide Memristive Devices
Zahari, F., Park, S., Mahadevaiah, M. K., Wenger, C., Kohlstedt, H., & Ziegler, M. (2023) · Springer series on bio- and neurosystems · doi:10.1007/978-3-031-36705-2_3
Dual In-Memory Computing of Matrix-Vector MultiplicationPreprint
Wang, S., & Sun, Z. (2024) · SSRN Electronic Journal · doi:10.2139/ssrn.4821734
A simple interface circuit for edge inference kernels based on SC-LNO memristor crossbar
Wang, S.-C., Liu, Y., Liu, X., Liu, Y., Liu, Z., & Xing, Z. (2025) · Microelectronics Journal · doi:10.1016/j.mejo.2024.106537
Ayson, J. M., Cabrera, E. J. R., Crisostomo, G. C. C., Santos, K. F. G., & Alonzo, N. D. (2024) · IEEE International Conference on Humanoid, Nanotechnology, Information Technology, Communication and Control, Environment, and Management (HNICEM) · doi:10.1109/hnicem64917.2024.11258701
“[ 11], [12], [13], [14], [15] There are also implementations on Field Programmable Gate Arrays (FPGAs) that benefits on modularity and hardware flexibility.”
Obernberger, S., González, Y., Sarkissian, A., Schindler, C., & Ruediger, A. P. (2026) · Advanced Electronic Materials · doi:10.2139/ssrn.6250359
Ko, J., Im, J., Koo, R., Park, S., & Lee, J. (2026) · Advanced Intelligent Systems · doi:10.1002/aisy.202501499
Yousuf, S. Z., Mamilla, S., & Murty, N. V. L. N. (2026) · Memories - Materials Devices Circuits and Systems · doi:10.1016/j.memori.2026.100139
Cho, Y., Kim, D., Lee, J., Kim, D., Park, S., Bae, J., Jang, T., & Choi, S. (2026) · Advanced Science · doi:10.1002/advs.75594
“Moreover, the capability of vector-matrix multiplication when fabricated in a crossbar array makes the memristor more promising as a device for constructing a bio-inspired computing architecture [ 8–10 ].”
Zhang, J., Chaocheng, S., Yan, J., Pei, Y., Xu, J., Yan, X., & Zhao, J. (2026) · 中国科学通报:英文版 · doi:10.1016/j.scib.2026.06.005
Silicon-compatible ferroelectric memristor for high-fidelity temporal computing
He, Q., He, Y., Zhang, Y., Wang, H., Wang, Z., Zhong, S., Xu, H., Chai, J., Wang, X. L., Tang, K., et al. (2026) · Device · doi:10.1016/j.device.2026.101207
Self-citationAnalog neural network–based wireless receiver
He, C., Huang, Y., Korkmaz, A., Rad, A. J., Xia, Q., & Katehi, L. (2026) · Science Advances · doi:10.1126/sciadv.aeg7153
“In addition, replacing the activation functions between NN layers with analog alternatives, such as analog sigmoid circuits ( 45 ) and rectified linear unit (ReLU) circuits ( 17 , 46 ), would reduce the number of TIAs required, which would then only be needed between distinct NN modules.”
Self-citationToward optically programmable crossbar arrays for array-level artificial neural network hardware
Jang, H., Choi, J.-H., Lee, T., & Park, H. (2026) · Nano Futures · doi:10.1088/2399-1984/ae925f
Single‐Step Analog In‐Memory Matrix Computation in Three‐Dimensional Circuits
Rad, A. J., Kumar, K., Kiani, F., Huang, Y., Abdel-Maksoud, A., Xiong, Z., Ling, Y., Zhao, W., & Xia, Q. (2026) · Advanced Intelligent Systems · doi:10.1002/aisy.70500
Self-citationSpiral wave in cardiac tissue under spatial electromagnetic radiation
Wang, B., Guo, Q., Wang, C., et al. (2026) · Mathematics and Computers in Simulation · doi:10.1016/j.matcom.2026.08.031
Feng, S., Li, K., Yan, S., et al. (2026) · Science and Technology of Advanced Materials · doi:10.1080/14686996.2026.2718043
Metadata
- Authors
- Kiani, F., Yin, J., Wang, Z., Yang, J. J., & Xia, Q.
- Affiliations
- University of Massachusetts Amherst (US)
- Corresponding author
- Xia, Qiangfei
- Venue
- Science Advances
- Published
- 2021-11-26
- Volume
- 7
- Issue
- 48
- Pages
- eabj4801-eabj4801
- ISSN
- 2375-2548 (ISSN-L)
- PMC
- PMC11559551
- OpenAlex
- W3217269745
- Semantic Scholar
- 58068f93c4ce64e5c557b416b4319589a6f74e2c
- Cited by
- 97
- References
- 45
- Citations by year
- 2026: 20 · 2025: 21 · 2024: 24 · 2023: 23 · 2022: 9
- FWCI
- 4.11
- Type
- journal article
- Language
- en
- Open access
- gold
- doi.org
- Licence
- cc-by-nc
- Locations
- Science Advances (publishedVersion, cc-by-nc)
- PubMed Central (publishedVersion, cc-by-nc)
- PubMed (publishedVersion)
- ScholarWorks@UMassAmherst (University of Massachusetts Amherst) (submittedVersion, cc-by-nc)
- Topics
- Physical Sciences › Engineering › Electrical and Electronic Engineering › Advanced Memory and Neural Computing
- Physical Sciences › Computer Science › Artificial Intelligence › Neural Networks and Applications
- Physical Sciences › Computer Science › Artificial Intelligence › Neural Networks and Reservoir Computing
- Keywords
- memristor crossbar, in-memory computing, analog neural networks, rectified linear units, multilayer perceptron, handwritten digit recognition, MNIST, energy efficiency, analog signal transmission
About these checks
Registry, retraction, Cites and statistics results are computed, not judged, with one exception: a printed reference that no index lists is read once by a model before it counts as a citation error. Claims are extracted by a model and kept only when their quote appears verbatim in the text; each cited source is then checked, with a model’s help, for whether it says what the claim relies on. Those verdicts can be wrong — read the claim’s quote and the cited source before relying on one.
Statistics and arithmetic are recomputed, not judged.
Confidence bands are shown only for fields calibrated on our annotated test set. None is calibrated yet, so no band is shown.
What counts as a claim ›How we measure confidence ›How we check this ›
Are you an author, or do you see a problem with this page? Request a review
Data sources
Bibliographic data: Semantic Scholar, OpenAlex, Crossref.
Contains information from the Semantic Scholar Academic Graph Datasets, made available under the ODC Attribution License (ODC-BY 1.0).
Semantic Scholar’s data is described in: Kinney, R., et al. (2023). The Semantic Scholar Open Data Platform. arXiv:2301.10140.
