

The DOI matches its Crossref record; 7 of the 7 references it cites were found in a registry or an index.
Recurring volcanic winters during the latest Cretaceous: Sulfur and fluorine budgets of Deccan Traps lavas
Abstract
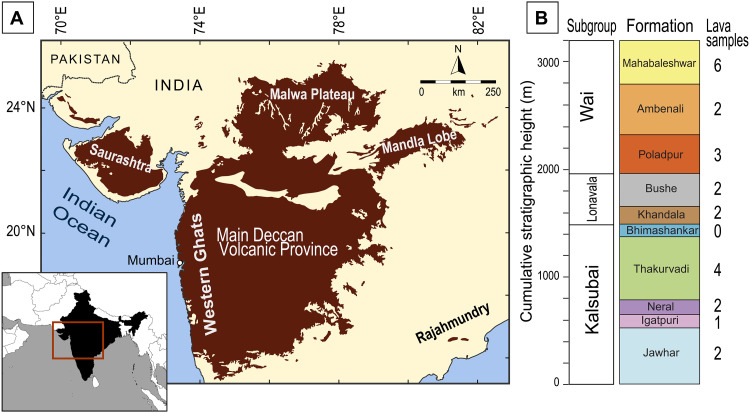
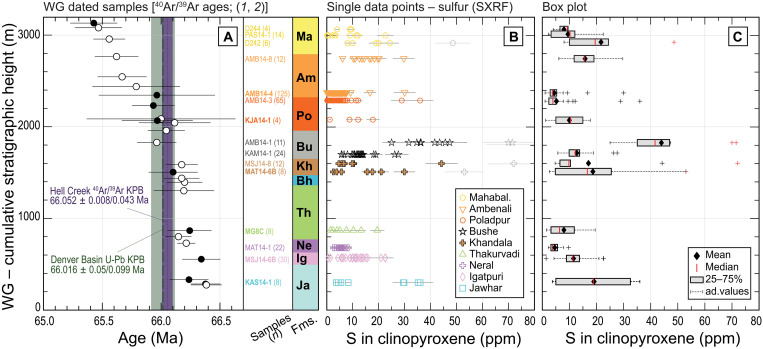
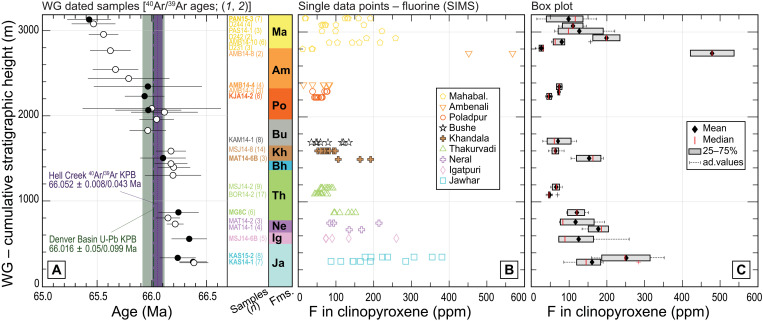
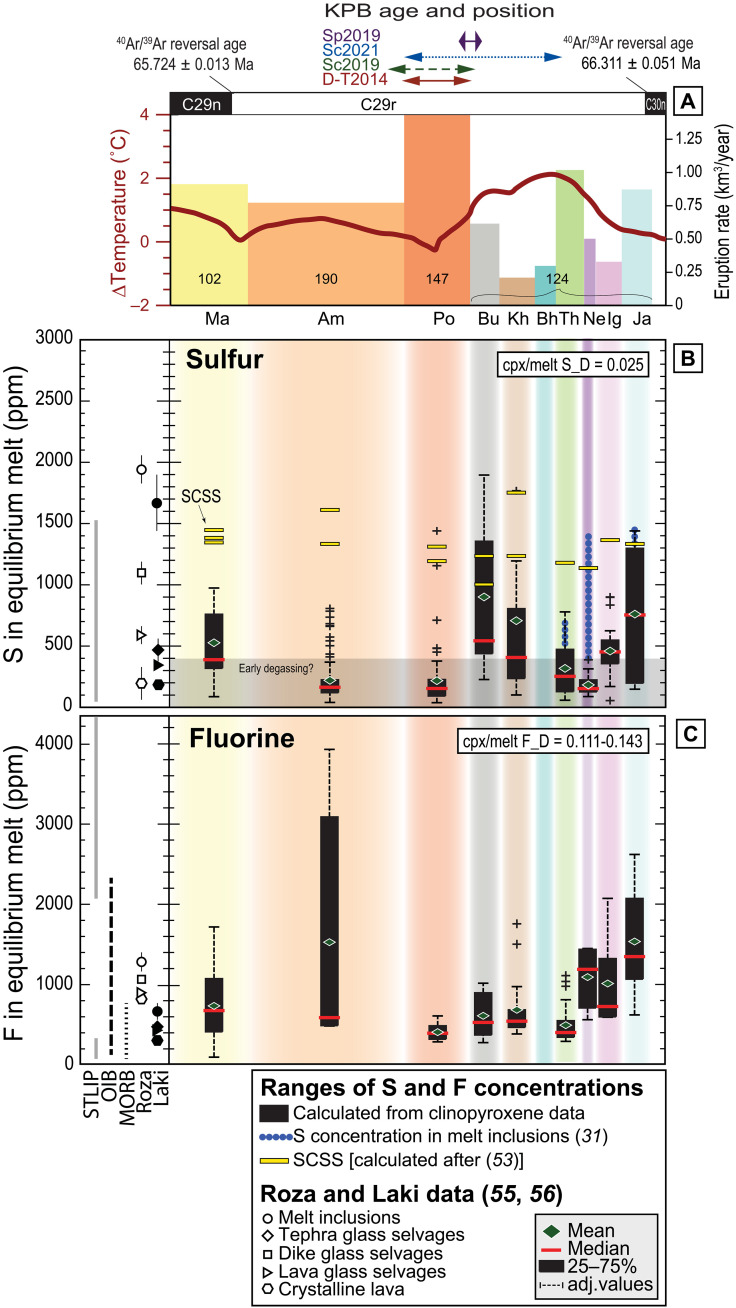
Two events share the stage as main drivers of the Cretaceous-Paleogene mass extinction—Deccan Traps volcanism, and an asteroid impact recorded by the Chicxulub crater. We contribute to refining knowledge of the volcanic stressor by providing sulfur and fluorine budgets of Deccan lavas from the Western Ghats (India), which straddle the Cretaceous-Paleogene boundary. Volcanic fluorine budgets were variable (400 to 3000 parts per million) and probably sufficient to affect the environment, albeit only regionally. The highest sulfur budgets (up to 1800 parts per million) are recorded in Deccan lavas emplaced just prior (within 0.1 million years) to the extinction interval, whereas later basalts are generally sulfur-poor (up to 750 parts per million). Independent evidence suggests the Deccan flood basalts erupted in high-flux pulses. Our data suggest that volcanic sulfur degassing from such activity could have caused repeated short-lived global drops in temperature, stressing the ecosystems long before the bolide impact delivered its final blow at the end of the Cretaceous.
Overview
The claims and statistics of this paper haven’t been checked yet.
Run the check — free, no account needed. It reads the open-access text and checks the sources it cites.
Integrity signals
Registry
Cites
Statistics
Figures
Verification
Claims the paper makes
The claims and statistics of this paper haven’t been checked yet.
Run the check — free, no account needed. It reads the open-access text and checks the sources it cites.
Claims other papers make about this one
Each is checked against this paper’s own text: does it say what the citing paper says it does?
In the citing paper
“Also of interest is the observation that global benthic foraminifera δ13C start to shift toward heavier values at 66.07 Ma being synchronous with the Bushe Formation sulfur-rich lavas (30) just before the K/Pg boundary when Os isotope data start to shift as well.”
From Earth orbital rhythms links timing of Deccan trap volcanism phases and global climate change (2025) · cites this paper as [30]
In the citing paper
“Both observations indicate that major phases in the DT volcanism start with sulfur-rich eruptions, stressing the ecosystem locally (30) and, possibly, more globally (31).”
From Earth orbital rhythms links timing of Deccan trap volcanism phases and global climate change (2025) · cites this paper as [30]
Self-check
Percentages, sums and reported differences re-computed from the paper’s own numbers.
The self-check needs the paper’s full text.
Citations
Cites
U-Pb constraints on pulsed eruption of the Deccan Traps across the end-Cretaceous mass extinction
Schoene, B., Eddy, M. P., Samperton, K. M., Keller, C. B., Keller, G., Adatte, T., & Khadri, S. F. R. (2019) · Science · doi:10.1126/science.aau2422 · Cited by 542
The eruptive tempo of Deccan volcanism in relation to the Cretaceous-Paleogene boundary
Sprain, C. J., Renne, P. R., Vanderkluysen, L., Pande, K., Self, S., & Mittal, T. (2019) · Science · doi:10.1126/science.aav1446 · Cited by 395
Self-citationAsteroid impact, not volcanism, caused the end-Cretaceous dinosaur extinction
Chiarenza, A. A., Farnsworth, A., Mannion, P. D., Lunt, D. J., Valdes, P. J., Morgan, J. V., & Allison, P. A. (2020) · Proceedings of the National Academy of Sciences · doi:10.1073/pnas.2006087117 · Cited by 228
Petersen, S. V., Dutton, A., & Lohmann, K. C. (2016) · Nature Communications · doi:10.1038/ncomms12079 · Cited by 210
Triggering of the largest Deccan eruptions by the Chicxulub impact
Richards, M. A., Alvarez, W., Self, S., Karlstrom, L., Renne, P. R., Manga, M., Sprain, C. J., Smit, J., Vanderkluysen, L., & Gibson, S. A. (2015) · Geological Society of America Bulletin · doi:10.1130/b31167.1 · Cited by 210
Self-citationMercury linked to Deccan Traps volcanism, climate change and the end-Cretaceous mass extinction
Keller, G., Mateo, P., Monkenbusch, J., Thibault, N., Punekar, J., Spangenberg, J. E., Abramovich, S., Ashckenazi-Polivoda, S., Schoene, B., Eddy, M. P., et al. (2020) · Global and Planetary Change · doi:10.1016/j.gloplacha.2020.103312 · Cited by 130
Fendley, I. M., Mittal, T., Sprain, C. J., Marvin-DiPasquale, M., Tobin, T. S., & Renne, P. R. (2019) · Earth and Planetary Science Letters · doi:10.1016/j.epsl.2019.115721 · Cited by 71
Self-citation
Research works printed but not linked: 92
- 10.1126/science.aac7549 · DOI · Paper page
- J. J. Sepkoski Patterns of phanerozoic extinction: A perspective from global data bases in Global Events and Event Stratigraphy in the Phanerozoic O. H. Walliser Ed. (Springer 1996). · DOI
- 10.1073/pnas.1905989116 · DOI
- 10.1007/BF01073513 · DOI · Paper page
- 10.1016/0012-821X(88)90153-7 · DOI · Paper page
- 10.1126/science.208.4448.1095 · DOI · Paper page
- 10.1073/pnas.1909479116 · DOI
- 10.1016/j.cretres.2008.05.030 · DOI
- 10.1126/science.1177265 · DOI · Paper page
- 10.1126/science.aay5055 · DOI · Paper page
- 10.1130/G39771.1 · DOI · Paper page
- 10.1130/G49214.1 · DOI
- N. C. Arens, A. Thompson, A. H. Jahren, A preliminary test of the press-pulse extinction hypothesis: Palynological indicators of vegetation change preceding the Cretaceous-Paleogene boundary, McCone County, Montana USA. Spec. Pap. Geol. Soc. Am. 503, 209–227 (2014).
- 10.1073/pnas.2120441119 · DOI
- 10.1038/s43017-021-00221-4 · DOI
- 10.5194/acp-21-9009-2021 · DOI
- 10.1038/ngeo2588 · DOI · Paper page
- 10.1073/pnas.2007797118 · DOI · Paper page
- 10.1016/j.epsl.2020.116249 · DOI · Paper page
- 10.1130/G50016.1 · DOI
- 10.1130/G37451.1 · DOI
- 10.1126/science.1152830 · DOI · Paper page
- 10.1016/j.lithos.2019.07.002 · DOI
- 10.1002/9781119507444.ch4 · DOI
- 10.1130/G35983.1 · DOI
- 10.2138/am-2020-7188 · DOI
- 10.2138/am-2021-7868 · DOI
- 10.1016/0016-7037(94)90464-2 · DOI · Paper page
- 10.1093/petrology/egq082 · DOI · Paper page
- 10.1130/B35018.1 · DOI
- 10.1016/j.lithos.2005.12.007 · DOI
- 10.1016/j.jseaes.2007.10.001 · DOI
- 10.1007/s00126-009-0271-1 · DOI
- 10.5194/gchron-3-181-2021 · DOI · Paper page
- A. E. Jay “Volcanic architecture of the Deccan Traps western Maharashtra India: An integrated chemostratigraphic and paleomagnetic study ” thesis The Open University (2005).
- L. Melluso S. Sethna Mineral compositions in the Deccan igneous rocks of India: An overview in Topics in Igneous Petrology: A Tribute to Prof. Mihir K. Bose J. Ray G. Sen B. Ghosh Eds. (Springer 2011) pp. 135–159. · DOI
- 10.1093/petrology/egac075 · DOI · Paper page
- 10.1016/j.lithos.2020.105754 · DOI
- 10.1016/j.gca.2015.03.022 · DOI
- 10.1016/j.epsl.2012.05.003 · DOI
- 10.1016/S0377-0273(96)00054-6 · DOI
- 10.1007/s004450050136 · DOI
- 10.1016/j.epsl.2011.12.001 · DOI
- P. J. Wallace T. Plank M. Edmonds E. H. Hauri Volatiles in Magmas (Elsevier ed. 2 2015) pp. 163–183. · DOI
- 10.1016/j.gca.2022.08.032 · DOI
- 10.1029/2022GC010552 · DOI
- 10.1016/j.gca.2007.01.004 · DOI
- 10.1016/j.gca.2013.06.025 · DOI
- 10.1093/petrology/egac094 · DOI
- A. Lecomte M. Cathelineau R. Michels C. Peiffert M. Brouand Uranium mineralization in the Alum Shale Formation (Sweden): Evolution of a U-rich marine black shale from sedimentation to metamorphism. 88 71–98 (2017). · DOI
- 10.1016/j.chemgeo.2008.11.013 · DOI
- M. R. Carroll, J. D. Webster, Solubilities of sulfur, noble gases, nitrogen, chlorine, and fluorine in magmas. Rev. Mineral. Geochem. 30, 231–279 (1994).
- T. Thordarson S. Self Atmospheric and environmental effects of the 1783–1784 Laki eruption: A review and reassessment. 108 AAC 7-1–AAC 7-29 (2003). · DOI
- 10.1016/j.chemgeo.2019.06.014 · DOI
- 10.1016/j.lithos.2022.106696 · DOI
- 10.1016/j.gca.2020.02.018 · DOI
- 10.1016/j.epsl.2022.117946 · DOI
- 10.1016/j.gca.2023.03.014 · DOI
- 10.1016/S0883-2927(00)00075-5 · DOI
- 10.1016/j.apgeochem.2017.03.018 · DOI
- 10.1016/j.apgeochem.2018.12.016 · DOI · Paper page
- 10.1016/j.palaeo.2012.06.029 · DOI · Paper page
- 10.2475/08.2018.01 · DOI
- 10.1016/j.epsl.2010.10.037 · DOI
- 10.1016/j.epsl.2014.07.043 · DOI
- 10.1038/s41561-018-0261-y · DOI
- 10.1073/pnas.0234701100 · DOI · Paper page
- 10.1029/JD094iD08p11165 · DOI
- 10.1029/1998RG000054 · DOI · Paper page
- 10.1146/annurev.ea.16.050188.000445 · DOI
- 10.1029/2008JB005644 · DOI · Paper page
- 10.1107/S0909049509032282 · DOI
- 10.1016/j.sab.2006.12.002 · DOI
- J. Goldstein D. E. Newbury D. C. Joy C. E. Lyman P. Echlin E. Lifshin L. Sawyer J. R. Michael Scanning Electron Microscopy and X-Ray Microanalysis (Springer ed. 3 2003) p. 690. · DOI
- R. M. Rousseau, Detection limit and estimate of uncertainty of analytical XRF results. Rigaku J. 18, 33–47 (2001).
- 10.1029/2005GC001060 · DOI
- 10.1016/j.gca.2015.08.023 · DOI
- 10.1007/s00410-017-1368-7 · DOI
- 10.1016/j.epsl.2013.06.023 · DOI
- 10.1016/j.epsl.2014.08.027 · DOI
- 10.1093/petrology/egh097 · DOI
- 10.1016/j.gca.2010.07.022 · DOI
- 10.1007/BF00376966 · DOI
- 10.1016/0016-7037(84)90403-4 · DOI
- R. W. Le Maitre Igneous Rocks: A Classification and Glossary of Terms (Cambridge Univ. Press 2002). · DOI
- 10.2465/minerj.14.198 · DOI
- 10.1002/2013GC005112 · DOI
- 10.2138/am-2017-5968 · DOI
- 10.1093/petrology/42.12.2175 · DOI
- 10.1007/BF02704024 · DOI
- 10.1029/2022GC010750 · DOI
- 10.1007/s12594-018-1033-4 · DOI
Cited by
Earth orbital rhythms links timing of Deccan trap volcanism phases and global climate change
Westerhold, T., Dallanave, E., Penman, D., Schoene, B., Röhl, U., Gussone, N., & Kuroda, J. (2025) · Science Advances · doi:10.1126/sciadv.adr8584 · Cited by 17
Tholt, A. J., Renne, P. R., Marzoli, A., Vanderkluysen, L., Mohabey, D., Samant, B., Dhobale, A., Pande, K., & Self, S. (2023) · Geochemistry, Geophysics, Geosystems · doi:10.1029/2023gc011137 · Cited by 15
Self-citationKale, V. S., Upasani, D., Rajput, M., Dole, G., & Pillai, S. P. (2026) · Geological Society of America Bulletin · doi:10.1130/b38412.1 · Cited by 3
Metadata
- Authors
- Callegaro, S., Baker, D. R., Renne, P. R., Melluso, L., Geraki, K., Whitehouse, M. J., De Min, A., & Marzoli, A.
- Affiliations
- Centre for Earth Evolution and Dynamics, University of Oslo, Sem Sælands vei 2A, 0371 Oslo, Norway.
- Department of Earth and Planetary Sciences, McGill University, 3450 University St., Montreal, QC, Canada.
- Berkeley Geochronology Center, 2455 Ridge Road, Berkeley, CA 94709, USA.
- Dipartimento di Scienze della Terra, Ambiente e Risorse, University of Napoli Federico II, via Cintia 21, 80126 Napoli, Italy.
- Diamond Light Source, Harwell Science and Innovation Campus, Didcot OX11 0DE, UK.
- Swedish Museum of Natural History, Stockholm, Sweden.
- Department of Mathematics and Geoscience, University of Trieste, via Weiss 2, 34128 Trieste, Italy.
- Dipartimento Territorio e Sistemi Agro-Forestali, University of Padova, 35020 Legnaro, Italy.
- ORCID
- Venue
- Science Advances
- Published
- 2023-10-06
- Volume
- 9
- Issue
- 40
- ISSN
- 2375-2548
- PMC
- PMC10550224
- Cited by
- 31
- References
- 7
- Language
- en
About these checks
Registry, retraction, Cites and statistics results are computed, not judged, with one exception: a printed reference that no index lists is read once by a model before it counts as a citation error. Claims are extracted by a model and kept only when their quote appears verbatim in the text; each cited source is then checked, with a model’s help, for whether it says what the claim relies on. Those verdicts can be wrong — read the claim’s quote and the cited source before relying on one.
Statistics and arithmetic are recomputed, not judged.
Confidence bands are shown only for fields calibrated on our annotated test set. None is calibrated yet, so no band is shown.
What counts as a claim ›How we measure confidence ›How we check this ›
Are you an author, or do you see a problem with this page? Request a review
