

The DOI matches its Crossref record; 105 of the 105 references it cites were found in a registry or an index; 60 of the 84 sources its claims cite were checked for support.
Transcriptomics and Phenotyping Define Genetic Signatures Associated with Echinocandin Resistance in Candida auris
Open accessAbstract
Echinocandin-resistant Candida auris isolates share differential expression signatures enriched for mitochondrial and cell-wall-function genes, correlating with adhesive traits and altered cell wall properties.
Overview
CoChat Summary
TL;DR
Transcriptomic and phenotypic profiling of three echinocandin-resistant (ECN-R) and two echinocandin-susceptible (ECN-S) clade I *Candida auris* clinical isolates identified a shared 362-gene ECN-R core signature, alongside cell wall and mitochondrial changes. The authors propose that such transcriptomic fingerprints may help predict antifungal resistance and virulence-related traits.
Key findings
- All ECN-R isolates carried the FKS1 S639F hot spot mutation and had elevated echinocandin MICs: CSP 4–8 μg/mL, MFG 8 μg/mL, and AFG 8 μg/mL, versus CSP 0.25–1 μg/mL, MFG 0.125–0.25 μg/mL, and AFG 0.125–0.5 μg/mL for ECN-S isolates.
- RNA-seq showed 12–24% of detected *C. auris* coding sequences differentially expressed between ECN-R and ECN-S isolates, whereas only 93 genes (2%) differed between the two ECN-S isolates; 362 genes were commonly differentially expressed across all three ECN-R isolates versus both ECN-S isolates, representing about 6% of the 5,397 genes detected.
- The ECN-R core signature was enriched for translation, ergosterol biosynthetic processes, and mitochondrial gene expression; ECN-R isolates also showed roughly 2- to 3-fold lower antimycin A IC50 values than ECN-S isolates.
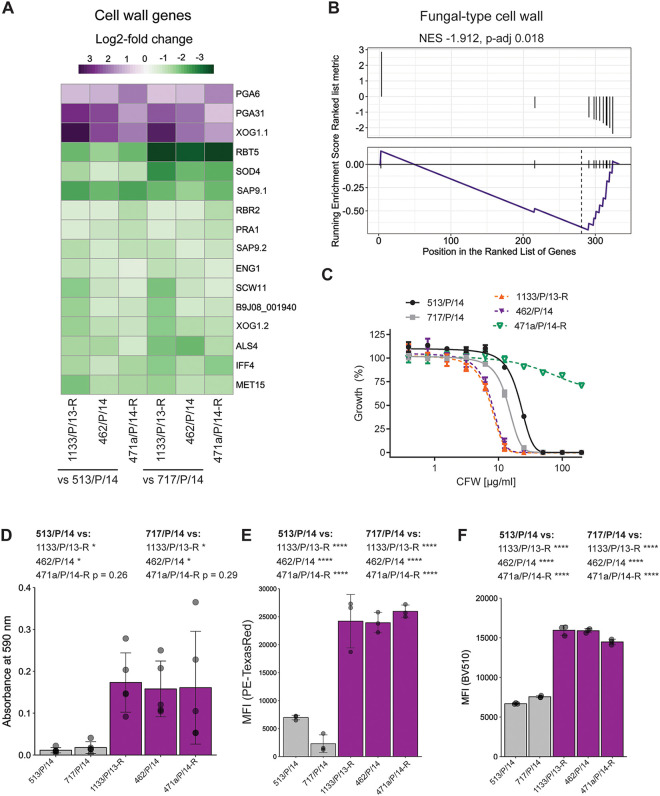
- ECN-R isolates displayed enhanced plastic adhesion, increased mannan and β-glucan content, altered calcofluor white sensitivity, and approximately 2-fold higher macrophage phagocytosis at 45 and 120 min than ECN-S isolate 717/P/14; ROS release was diminished with the ECN-S isolate.
Methods
- The study used clade I *C. auris* clinical isolates from a Delhi culture collection, including three ECN-R isolates (471a/P/14-R, 1133/P/13-R, 462/P/14) and two ECN-S isolates (513/P/14, 717/P/14), after screening 64 additional isolates plus previously analyzed isolates for antifungal susceptibility.
- Antifungal susceptibility was assessed by robotic solid-medium screening, liquid YPD growth inhibition assays, and CLSI M27-A3 broth microdilution MIC testing.
- RNA-seq was performed with three biological replicates per strain after growth in YPD at 30°C for 4 h, using Illumina 150-bp paired-end reads mapped to the *C. auris* B8441 genome; differential expression was analyzed with edgeR, followed by PCA, GO enrichment, and GSEA. Phenotyping included plastic adhesion, flow-cytometric cell wall component quantification, and primary murine BMDM coculture assays for phagocytosis, ROS, and fungal killing.
Limitations
- Stated: the authors note that they investigated only a few patient isolates, and that future studies should address the competitive fitness of *C. auris* strains with distinct phenotypic traits.
- Stated: the solid-medium robotic antifungal screen is not a validated or clinically approved susceptibility testing method, so results were confirmed by liquid growth inhibition and CLSI MIC assays.
- Evident from the text: transcriptomic comparisons were performed under basal growth conditions rather than during echinocandin exposure, all isolates were clade I, and PGA6 deletion alone only moderately reduced adhesion and did not affect CSP susceptibility, so causal roles for most core genes remain unresolved.
Model-written summary. Check it against the paper before relying on it.
Integrity signals
Registry
Cites
Statistics
Figures



Verification
Claims the paper makes
40 Valid · 3 Not valid · 14 Not checked · 103 Own results and interpretations
Every source the paper cites for this claim was checked and supports it.
In the paper
“Recent work from our group demonstrated that specific transcriptional signatures correlate with phenotypic traits of C. auris patient isolates with opposing antifungal susceptibility profiles (33).”
§ Transcriptomics and Phenotyping Define Genetic Signatures Associated with Echinocandin Resistance in Candida auris > INTRODUCTION
What the sources say
- Supportedcites [33] Jenull S, Tscherner M, Kashko N, Shivarathri R, Stoiber A, Chauhan M, Petryshyn A, Chauhan N, Kuchler K. 2021. Transcriptome signatures predict phenotypic variations of Candida auris. Front Cell Infect Microbiol 11: 662563. doi: 10.3389/fcimb.2021.662563. 33937102 PMC8079977 source
The Introduction states that the study presents transcriptional signatures of C. auris clade I isolates with distinct antifungal susceptibility profiles. The Results section on transcriptional aberrations links isolate-specific gene expression to phenotypic differences, including antifungal susceptibility and proteolytic activity. The Discussion likewise says the signatures help predict phenotypic variability, while noting that only a limited set of isolates was profiled. (LLM, conf=0.94)
boostedstates an association- Asserted: passes — The authors put it forward as true.
- Checkable: passes — It can be checked against evidence.
- Load-bearing: passes — The paper’s conclusions depend on it.
- Based: passes — The paper gives a reason why it holds.
- Supported
The cited sources support only part of this claim — read each source’s verdict below.
In the paper
“Additionally, PGA6 was also upregulated in other C. auris isolates treated with CSP for 24 h (55).”
§ Transcriptomics and Phenotyping Define Genetic Signatures Associated with Echinocandin Resistance in Candida auris > DISCUSSION
What the sources say
- Partly supportedcites [55] Zamith-Miranda D, Amatuzzi RF, Munhoz da Rocha IF, Martins ST, Lucena ACR, Vieira AZ, Trentin G, Almeida F, Rodrigues ML, Nakayasu ES, Nosanchuk JD, Alves LR. 2021. Transcriptional and translational landscape of Candida auris in response to caspofungin. Comput Struct Biotechnol J 19: 5264– 5277. doi: 10.1016/j.csbj.2021.09.007. 34630944 PMC8481930 sourceExperimental — accuracy not yet measured
The Results section reports that C. auris strains B11244 and MMC1 were treated with caspofungin for 24 hours and that GPI-anchored-protein transcripts were among the most expressed in treated cells. However, the passages in our copy do not identify PGA6 as upregulated in either isolate, so they support the treatment context but not the gene-specific claim. (LLM, conf=0.79)
plainstates an association- Asserted: passes — The authors put it forward as true.
- Checkable: passes — It can be checked against evidence.
- Load-bearing: unclear — It is unclear whether the paper’s conclusions depend on it.
- Based: passes — The paper gives a reason why it holds.
- Partly supported
Every source the paper cites for this claim was checked and supports it.
In the paper
“However, as C. auris can be transmitted from person to person by skin contact (76), the possibility remains that these isolates may originate from another patient with previous ECN exposure.”
§ Transcriptomics and Phenotyping Define Genetic Signatures Associated with Echinocandin Resistance in Candida auris > DISCUSSION
What the sources say
- Supportedcites [76] Proctor DM, Dangana T, Sexton DJ, Fukuda C, Yelin RD, Stanley M, Bell PB, Baskaran S, Deming C, Chen Q, Conlan S, Park M, NISC Comparative Sequencing Program, Welsh RM, Vallabhaneni S, Chiller T, Forsberg K, Black SR, Pacilli M, Kong HH, Lin MY, Schoeny ME, Litvintseva AP, Segre JA, Hayden MK. 2021. Integrated genomic, epidemiologic investigation of Candida auris skin colonization in a skilled nursing facility. Nat Med 27: 1401– 1409. doi: 10.1038/s41591-021-01383-w. 34155414 PMC9396956 source
The Abstract describes contact-mediated transmission: a healthcare provider may pick up C. auris by touching a colonized patient’s skin and then transmit it to another patient if hand hygiene is inadequate. This supports person-to-person transmission by skin contact, though the route described involves an intermediary rather than direct patient-to-patient contact. (LLM, conf=0.91)
plainstates a cause- Asserted: passes — The authors put it forward as true.
- Checkable: passes — It can be checked against evidence.
- Load-bearing: unclear — It is unclear whether the paper’s conclusions depend on it.
- Based: passes — The paper gives a reason why it holds.
- Supported
Every source the paper cites for this claim was checked and supports it.
In the paper
“Indeed, ECN resistance is a multistep developmental process consisting of stress adaptations such as cell wall integrity signaling (86).”
§ Transcriptomics and Phenotyping Define Genetic Signatures Associated with Echinocandin Resistance in Candida auris > DISCUSSION
What the sources say
- Supportedcites [86] Healey KR, Perlin DS. 2018. Fungal resistance to echinocandins and the MDR phenomenon in Candida glabrata. J Fungi (Basel) 4: 105. doi: 10.3390/jof4030105. PMC6162769 30200517 source
Section 2.1 describes drug adaptation as an intermediate step before resistant FKS mutants emerge in C. glabrata. Section 2.2 identifies cell wall integrity signaling as an important stress response during echinocandin adaptation, supporting the cited paraphrase. (LLM, conf=0.90)
plainstates a cause- Asserted: passes — The authors put it forward as true.
- Checkable: passes — It can be checked against evidence.
- Load-bearing: unclear — It is unclear whether the paper’s conclusions depend on it.
- Based: passes — The paper gives a reason why it holds.
- Supported
The cited sources support only part of this claim — read each source’s verdict below.
In the paper
“Moreover, ECN resistance can develop quickly upon the onset of ECN treatment (73, 74).”
§ Transcriptomics and Phenotyping Define Genetic Signatures Associated with Echinocandin Resistance in Candida auris > DISCUSSION
What the sources say
- Supportedcites [73] Lewis JS, II, Wiederhold NP, Wickes BL, Patterson TF, Jorgensen JH. 2013. Rapid emergence of echinocandin resistance in Candida glabrata resulting in clinical and microbiologic failure. Antimicrob Agents Chemother 57: 4559– 4561. doi: 10.1128/AAC.01144-13. 23817368 PMC3754289 source
The Abstract (p. 4559) reports a case in which Candida glabrata developed resistance to micafungin within 8 days of starting therapy. This directly supports the claim that echinocandin resistance can develop quickly after treatment begins. (LLM, conf=0.94)
- Partly supportedcites [74] Singh-Babak SD, Babak T, Diezmann S, Hill JA, Xie JL, Chen Y-L, Poutanen SM, Rennie RP, Heitman J, Cowen LE. 2012. Global analysis of the evolution and mechanism of echinocandin resistance in Candida glabrata. PLoS Pathog 8: e1002718. doi: 10.1371/journal.ppat.1002718. 22615574 PMC3355103 sourceExperimental — accuracy not yet measured
The Results section reports that C. glabrata isolates became more resistant to caspofungin during treatment. However, the Discussion describes this evolution over 10 months and multiple rounds of treatment, not quickly upon treatment onset. No page number is available in our copy. (LLM, conf=0.84)
plainstates a cause- Asserted: passes — The authors put it forward as true.
- Checkable: passes — It can be checked against evidence.
- Load-bearing: unclear — It is unclear whether the paper’s conclusions depend on it.
- Based: passes — The paper gives a reason why it holds.
- Supported
94 more claims · 7 with their cited sources checked
Create a free account to see all 160 claims and to verify the 3 references still open.
- It may state two separate claims as one. 18
- Probably not a substantial claim. 46
- The quote only partly states this claim. 2
Claims other papers make about this one
Each is checked against this paper’s own text: does it say what the citing paper says it does?
The source backs part of the claim, not all of it — or backs it for a different population, condition or comparison.
In the citing paper
“Transcriptomics of MDR strains versus drug-sensitive clinical isolates revealed numerous genes implicated in carboxylic acid metabolism, mitochondrial function, translation and membrane transports as critical hallmarks of antifungal resistance traits in C. auris15–17.”
From Candida auris skin tropism and antifungal resistance are mediated by carbonic anhydrase Nce103 (2025) · cites this paper as [15]
Experimental — accuracy not yet measuredThe check wasn’t confident either way, so it gives no verdict — never disputed.
In the citing paper
“However, major effectors or sensing mechanisms implicated in antifungal resistance escaped discovery15,16.”
From Candida auris skin tropism and antifungal resistance are mediated by carbonic anhydrase Nce103 (2025) · cites this paper as [15]
Experimental — accuracy not yet measured
Self-check
Percentages, sums and reported differences re-computed from the paper’s own numbers.
Each contradiction between two passages listed here was confirmed by an independent check.
Rated minor: it would not touch a result — a value no result rests on, a p-value that stays on the same side of the significance level, or a conflict that is clerical, resolved elsewhere in the paper, or outside its own findings.
In the paper
§ Transcriptomics and Phenotyping Define Genetic Signatures Associated with Echinocandin Resistance in Candida auris > MATERIALS AND METHODS > Coculture assays with primary macrophages.
“The percentage of fungal killing represents the ratio of recovered CFU from C. auris cells cultured with BMDMs to CFU from C. auris single cultures (input control).”
§ Transcriptomics and Phenotyping Define Genetic Signatures Associated with Echinocandin Resistance in Candida auris > RESULTS > ECN-R isolates trigger enhanced macrophage responses.
“(D) Fungal survival after 4 h of coculture with macrophages.”
Rated minor: it would not touch a result — a value no result rests on, a p-value that stays on the same side of the significance level, or a conflict that is clerical, resolved elsewhere in the paper, or outside its own findings.
In the paper
§ Transcriptomics and Phenotyping Define Genetic Signatures Associated with Echinocandin Resistance in Candida auris > RESULTS > ECN-R isolates trigger enhanced macrophage responses.
“Fungal coculture experiments showed that the rate of phagocytosis of fluorescein isothiocyanate (FITC)-labeled ECN-R isolates was approximately 2-fold higher for 717/P/14 after 45-min and 120-min interactions with BMDMs (Fig. 4A and B).”
§ Transcriptomics and Phenotyping Define Genetic Signatures Associated with Echinocandin Resistance in Candida auris > DISCUSSION
“Alternatively, ECN-R isolates may be more resistant to killing by BMDMs despite increased phagocytosis and ROS stress.”
Citations
Cites
Controlling the False Discovery Rate: A Practical and Powerful Approach to Multiple Testing
Benjamini, Y., & Hochberg, Y. (1995) · Journal of the Royal Statistical Society Series B: Statistical Methodology · doi:10.1111/j.2517-6161.1995.tb02031.x · Cited by 109,482 · cited 1×
“The false discovery rate (FDRs) represent P values adjusted for multiple testing using the Benjamini-Hochberg procedure (98).”
MethodRobinson, M. D., McCarthy, D. J., & Smyth, G. K. (2010) · Bioinformatics · doi:10.1093/bioinformatics/btp616 · Cited by 41,364 · cited 1×
“expression analysis was done using pairwise comparisons in edgeR (97).”
MethodclusterProfiler: an R Package for Comparing Biological Themes Among Gene Clusters
Yu, G., Wang, L.-G., Han, Y., & He, Q.-Y. (2012) · OMICS: A Journal of Integrative Biology · doi:10.1089/omi.2011.0118 · Cited by 36,259
HTSeq—a Python framework to work with high-throughput sequencing data
Anders, S., Pyl, P. T., & Huber, W. (2015) · Bioinformatics · doi:10.1093/bioinformatics/btu638 · Cited by 21,464 · cited 2×
“Read counting was done using HTseq (95) in the union mode and the genomic annotation from C.”
MethodRobinson, J. T., Thorvaldsdóttir, H., Winckler, W., Guttman, M., Lander, E. S., Getz, G., & Mesirov, J. P. (2011) · Nature Biotechnology · doi:10.1038/nbt.1754 · Cited by 15,390 · cited 2×
“Read counting was done using HTseq (95) in the union mode and the genomic annotation from C. auris B8841 (settings -f bam -r pos -t gene -i ID), and read coverage profiles were visualized using the Integrative Genomics Viewer (IGV) (96).”
MethodAntibiotic resistance threats in the United States, 2019
(U.S.), C. F. D. C. A. P. (2019) · doi:10.15620/cdc:82532 · Cited by 5,782
The antibiotic resistance crisis: part 1: causes and threats.
Ventola, C. L. (2015) · PubMed · Cited by 4,516
Pappas, P. G., Kauffman, C. A., Andes, D. R., Clancy, C. J., Marr, K. A., Ostrosky-Zeichner, L., Reboli, A. C., Schuster, M. G., Vazquez, J. A., Walsh, T. J., et al. (2016) · Clinical Infectious Diseases · doi:10.1093/cid/civ933 · Cited by 4,200 · cited 1×
“As ECN stands out as the recommended first-line therapy against invasive candidiasis (72), an increase in ECN resistance among Candida spp.”
BackgroundAntibacterial resistance worldwide: causes, challenges and responses
Levy, S. B., & Marshall, B. (2004) · Nature Medicine · doi:10.1038/nm1145 · Cited by 4,052 · cited 1×
“microbials in agricultural, animal mass production, and clinical settings (4, 5).”
BackgroundVennDiagram: a package for the generation of highly-customizable Venn and Euler diagrams in R
Chen, H., & Boutros, P. C. (2011) · BMC Bioinformatics · doi:10.1186/1471-2105-12-35 · Cited by 3,131 · cited 1×
“Venn diagrams were generated using the VennDiagram package in R (100).”
Method
Research works printed but not linked: 4
- Public Health England. 2017. Guidance for the laboratory investigation, management and infection prevention and control for cases of Candida auris. Public Health England, London, United Kingdom.
- Centers for Disease Control and Prevention. 2017. Recommendations for identification of Candida auris. Centers for Disease Control and Prevention, Atlanta, GA.
- Clinical and Laboratory Standards Institute. 2008. Reference method for broth dilution antifungal susceptibility testing of yeast. Approved standard, CLSI document M27-A3. Clinical and Laboratory Standards Institute, Wayne, PA.
- RStudio Team. 2020. RStudio: integrated development environment for R. R Foundation for Statistical Computing, Vienna, Austria.
Cited by
Candida auris Genetics and Emergence
Chowdhary, A., Jain, K., & Chauhan, N. (2023) · Annual Review of Microbiology · doi:10.1146/annurev-micro-032521-015858 · Cited by 158
Self-citationAbid, F. B., Salah, H., Sundararaju, S., Dalil, L., Abdelwahab, A. H., Salameh, S., Ibrahim, E. B., Almaslmani, M. A., Tang, P., Pérez‐López, A., et al. (2023) · Clinical Microbiology and Infection · doi:10.1016/j.cmi.2023.04.025 · Cited by 59
Native human and mouse skin infection models to study Candida auris-host interactions
Seiser, S., Arzani, H., Ayub, T., Phan-Canh, T., Staud, C., Worda, C., Kuchler, K., & Elbe-Bürger, A. (2024) · Microbes and Infection · doi:10.1016/j.micinf.2023.105234 · Cited by 29
Self-citationUniqueness of Candida auris cell wall in morphogenesis, virulence, resistance, and immune evasion
Dakalbab, S., Hamdy, R., Holigová, P., Abuzaid, E. J., Abu-Qiyas, A., Lashine, Y., Mohammad, M. G., & Soliman, S. S. M. (2024) · Microbiological Research · doi:10.1016/j.micres.2024.127797 · Cited by 31
Ramos, L. S., Barbosa, P. F., Lorentino, C. M. A., Lima, J. C., Braga, A. L., Lima, R., Giovanini, L., Casemiro, A. L., Siqueira, N. L. M., da Costa, S. C., et al. (2025) · Current Research in Microbial Sciences · doi:10.1016/j.crmicr.2025.100354 · Cited by 33
Metadata
- Authors
- Jenull, S., Shivarathri, R., Tsymala, I., Penninger, P., Trinh, P.-C., Nogueira, F., Chauhan, M., Singh, A., Petryshyn, A., Stoiber, A., Chowdhary, A., Chauhan, N., & Kuchler, K.
- Affiliations
- University of Veterinary Medicine Vienna (AT)
- Rutgers, The State University of New Jersey (US)
- Max Perutz Labs (AT)
- Department of Medical Biochemistry, Max Perutz Labs Vienna, Medical University of Vienna, Campus Vienna Biocenter, Vienna, Austria
- University of Delhi (IN)
- Corresponding author
- Jenull, Sabrina
- Chowdhary, Anuradha
- Chauhan, Neeraj
- Kuchler, Karl
- ORCID
- Venue
- mBio
- Publisher
- American Society for Microbiology
- Published
- 2022-08-30
- Volume
- 13
- Issue
- 4
- Pages
- e0079922-e0079922
- ISSN
- 2150-7511 (ISSN-L)
- PMC
- PMC9426441
- OpenAlex
- W4291605667
- Cited by
- 32
- References
- 104
- Citations by year
- 2026: 10 · 2025: 13 · 2024: 5 · 2023: 4
- FWCI
- 2.68
- Type
- journal article
- Language
- en
- Open access
- gold
- doi.org
- Licence
- cc-by
- creativecommons.org/licenses/by/4.0/ (vor)
- journals.asm.org/non-commercial-tdm-license (tdm)
- Locations
- mBio (publishedVersion, cc-by)
- PubMed Central (publishedVersion, cc-by)
- PubMed (publishedVersion)
- DOAJ (DOAJ: Directory of Open Access Journals) (submittedVersion, cc-by-sa)
- Funders
- Austrian Science Fund (P-32582, SFB-F70-HIT, TissueHome)
- HHS | National Institutes of Health (R01AI124499)
- Topics
- Health Sciences › Medicine › Infectious Diseases › Antifungal resistance and susceptibility
- Life Sciences › Biochemistry, Genetics and Molecular Biology › Molecular Biology › Fungal and yeast genetics research
- Life Sciences › Agricultural and Biological Sciences › Plant Science › Fungal Plant Pathogen Control
- Keywords
- Candida auris, echinocandin resistance, antifungal resistance, gene expression signatures, differentially expressed genes, fitness cost, host-pathogen interaction, multidrug resistance
- MeSH terms
- Candida auris, Antifungal Agents, Candida, Humans, Microbial Sensitivity Tests, Drug Resistance, Fungal, Echinocandins, Candidiasis, Invasive, Transcriptome
About these checks
Registry, retraction, Cites and statistics results are computed, not judged, with one exception: a printed reference that no index lists is read once by a model before it counts as a citation error. Claims are extracted by a model and kept only when their quote appears verbatim in the text; each cited source is then checked, with a model’s help, for whether it says what the claim relies on. Those verdicts can be wrong — read the claim’s quote and the cited source before relying on one.
The claim verdicts this report counts are experimental: their accuracy is not yet measured.
A language model drew the claims from the paper on 2026-10-10, under version 3 of the claim definition (model deepseek-v4.1-flash, prompt extract-v3).
A second model labelled each claim on 2026-10-10 (model jev-1.13-20260917, definition revision gold-guideline-v0.2).
Cited sources are checked with a language model’s help (gpt-6-sol).
Statistics and arithmetic are recomputed, not judged.
Confidence bands are shown only for fields calibrated on our annotated test set. None is calibrated yet, so no band is shown.
What counts as a claim ›How we measure confidence ›How we check this ›
Are you an author, or do you see a problem with this page? Request a review
How to cite
Cite CoChat for the checks on this page, and the paper for its own findings.
- This page
- CoChat. (2026). Citation check: Transcriptomics and Phenotyping Define Genetic Signatures Associated with Echinocandin Resistance in Candida auris. https://app.cochat.ai/papers/10.1128/mbio.00799-22
- The paper
- Jenull, S., Shivarathri, R., Tsymala, I., Penninger, P., Trinh, P.-C., Nogueira, F., Chauhan, M., Singh, A., Petryshyn, A., Stoiber, A., Chowdhary, A., Chauhan, N., & Kuchler, K. (2022). Transcriptomics and Phenotyping Define Genetic Signatures Associated with Echinocandin Resistance in Candida auris. mBio. https://doi.org/10.1128/mbio.00799-22
Data sources
Bibliographic data: Semantic Scholar, OpenAlex, Crossref.
Contains information from the Semantic Scholar Academic Graph Datasets, made available under the ODC Attribution License (ODC-BY 1.0).
Semantic Scholar’s data is described in: Kinney, R., et al. (2023). The Semantic Scholar Open Data Platform. arXiv:2301.10140.
